Rep:Mod:SHMGO
Introduction
Magnesium oxide is an important compound that has numerous uses such as the production of cement, catalysis and in medicine, therefore it is very important to study the physical and chemical properties of magnesium oxide, so that we can understand how to better use this compound. In this study the thermal coefficient of magnesium oxide was calculated, this property plays a very important role in cement production using magnesium oxide. The thermal expansion coefficient of magnesium oxide was calculated with computational simulations using two methods, quasi-harmonic approximation and molecular dynamics. [1][2][3]
Methodology
Helmholtz free energy
In the quasi-harmonic simulation, the Helmholtz free energy is calculated using formula (1):
Where F is the Helmholtz free energy, E0 is the zero-point energy, ω is the vibrational frequency and T is the temperature. Due to the fact that quasi-harmonic simulation was done under constant temperature, the only variable that affects the Helmholtz free energy is the vibrational frequency. The vibrational frequency is calculated by converting the MgO lattice in real space into a reciprocal lattice in K-space, then from the reciprocal lattice the brillouin zone is calculated. From the brillouin zone the phonon DOS is calculated and each peak on the phonon DOS corresponds to a vibrational frequency. This means that the volume of the MgO lattice will affect the vibrational frequency and hence the Helmholtz free energy. The quasi-harmonic simulation uses the fact that Helmholtz free energy is determined by the volume to work out the volume of the primitive cell at a set temperature.[4][5]
Calculation of temperature in molecular dynamics
In molecular dynamics the temperature of the system is determined using formula (2):
Where T is instantaneous temperature, m is the mass of the molecule, v is the velocity of the molecule and Nf is the number of degrees of freedom. In the molecular dynamics simulation, the volume of the MgO super cell at a particular temperature is determined by the average volume of all the frames of the simulation. The volumes of each frame of the simulation will be affected by the speed at which the ions in the MgO super cell are moving, which is determined by the temperature of the system. Hence for molecular dynamics simulations temperature of the system is the main factor in determining the volume.[6]
Thermal expansion coefficient
The 3D thermal expansion coefficient is determined using formula (3):
Where α is the thermal expansion coefficient, V is the volume, V0 is the initial volume and T is the temperature. From the formula, it can be seen that the thermal expansion coefficient can be calculated by plotting a volume vs temperature graph, and then calculating the gradient of the linear line of best fit.
Computational Details
All the results obtained for this experiment were from simulations done using the GULP software package. Two methods of simulation were used to calculate the thermal expansion coefficient, quasi-harmonic approximation and molecular dynamics. In both simulations the MgO lattice was approximated to be a perfect lattice and period boundary conditions were applied to the x, y and z directions. The Mg2+ ions in the lattice were approximated to be charged spheres with a +2 charge, similarly the O2- ions were approximated to be spheres with -2 charge. For each simulation, the volume was calculated for the temperatures from 100 to 1000 K with 100 K increments and was done under NPT conditions with the pressure set to 0. For the quasi-harmonic approximation, the system used was a conventional MgO cell and for the molecular dynamics simulation a 2x2x2 super cell of MgO containing 8 conventional cells was used.
Results
Quasi-harmonic simulation
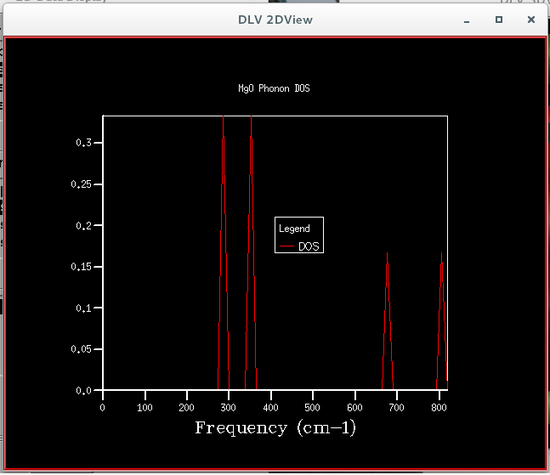
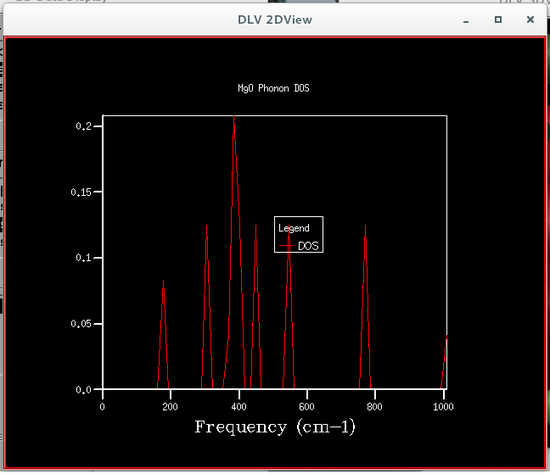
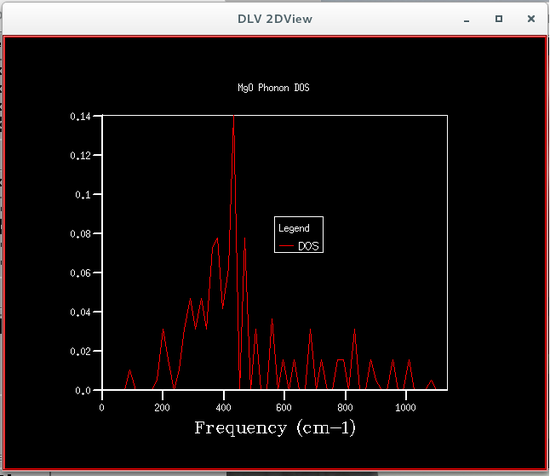
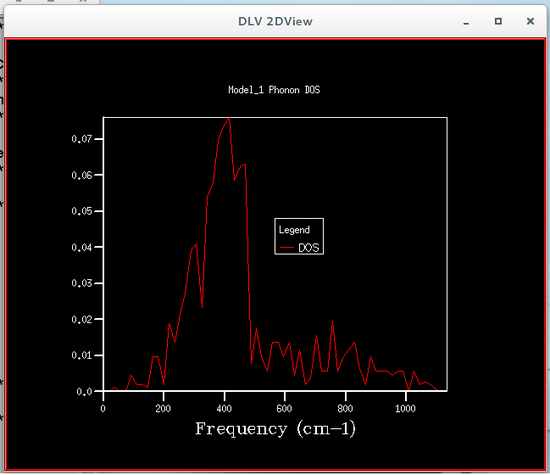
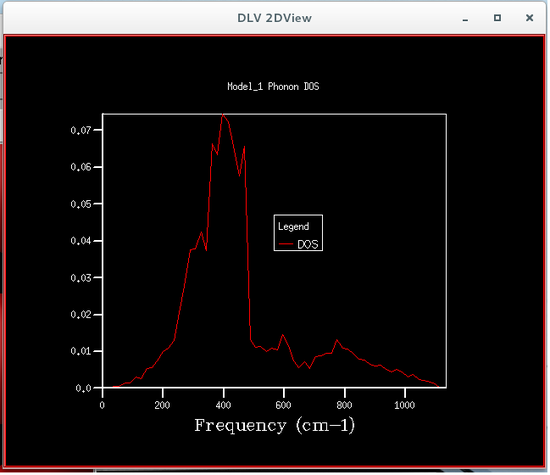
The phonon density of states were calculated using quasi-harmonic approximations, this was so that the Helmholtz free energy could be calculated, which is required to obtain the volume of the primitive cell. Six different phonon density of states were calculated, each corresponding to a particular grid size, the sizes were 1x1x1, 2x2x2, 4x4x4, 8x8x8, 16x16x16 and 32x32x32. The plots of these phonon density of states are shown below.
 |
 |
 |
 |
 |
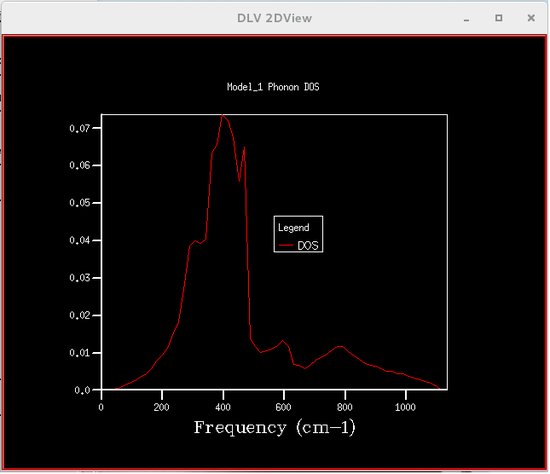 |
From the figures of the phonon density of states it could be seen that the density of states computed for the smaller grid sizes contains discrete sharp peaks that are not continuous. As the grid size increases the number of peaks also increases, and at grid sizes of 8x8x8 and larger the peaks overlap with each other to form a continuous plot and as the grid sizes increase the plots become more and more smooth.
The Helmholtz free energy calculated using each density of state is shown in the table below.
| Grid Size | Helmholtz Free Energy (eV) |
|---|---|
| 1x1x1 | -40.930301 |
| 2x2x2 | -40.926609 |
| 4x4x4 | -40.926450 |
| 8x8x8 | -40.926478 |
| 16x16x16 | -40.926482 |
| 32x32x32 | -40.926483 |
The table above clearly shows that the Helmholtz free energy converges as the grid size increases, it was therefore decided that the grid size of 32x32x32 will be used for the calculation of volume of the primitive cell using quasi-harmonic approximation. This is due to the fact that the Helmholtz free energy is used to calculate the volume of the primitive cell and so the more accurate the Helmholtz free energy the more accurate the volume.
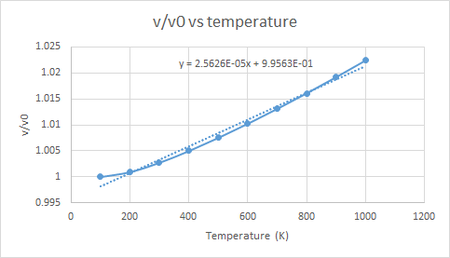
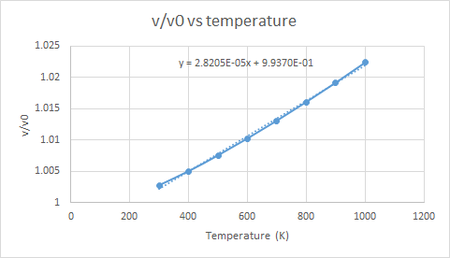
The figure below shows the volume vs temperature plot for the quasi-harmonic simulation, and from the equation of the linear line of best fit we can see that the thermal expansion coefficient of MgO calculated using quasi-harmonic simulation is 2.5626 x 10⁻⁵ K-1 for the temperature range 100 to 1000 K. However it can be seen that the plot is not fully linear and that it starts out with a lower slope at lower temperatures and eventually becomes linear after about 300 K. This is due to the fact that the equation for Helmholtz free energy includes a zero point energy and an internal energy both of which are not affected by temperature. Thus at lower temperatures the contribution of entropy to the Helmholtz free energy is not as significant as the zero point energy and the internal energy and so the slope is lower. If the linear line of best fit is only fitted to the linear portion of the plot (300 to 1000 K), it can be seen that the thermal expansion coefficient of MgO for the quasi-harmonic simulation would be 2.8205 x 10⁻⁵ K-1.
 |
 |
Molecular dynamics simulation
The figure below shows the volume vs temperature plot for the molecular dynamics simulation, and from the equation of the linear line of best fit we can see that the thermal expansion coefficient of MgO calculated using molecular dynamics simulation is 2.9963 x 10⁻⁵ K-1 for the temperature range 100 to 1000 K. Unlike the plot for the quasi-harmonic simulation, the plot for molecular dynamics simulation is linear throughout the whole plot, this is due to the fact that in molecular dynamics the volume is determined by the kinetic energy of the Mg2+ and O2- ions. Due to the fact that kinetic energy of the particles in a system is directly linked to the temperature of the system, the temperature of the system will have a large contribution for all temperatures and so the plot is linear.

Comparison of thermal expansion coefficient
There is a large difference for the thermal expansion coefficient from 100 to 1000 K between the quasi-harmonic (2.5626 x 10⁻⁵ K-1) and molecular dynamics (2.9963 x 10⁻⁵ K-1) simulation. However, for the quasi-harmonic simulation if only the linear portion of the plot was used to calculate the line of best fit, then the thermal expansion coefficient would be 2.8205 x 10⁻⁵ K-1 which is much closer to the molecular dynamics result. When compared to the literature value of the thermal expansion coefficient for MgO of 1.39 x 10⁻⁵ K-1 from 25 to 1000 °C (298 to 1273 K) [3], it can be seen that the simulation values are more than double that of the literature value. The reason why the difference is so big is due to the fact that approximations were made for the simulations. The biggest one was that of approximating the Mg2+ and O2- ions as uniformly charged spheres, this is clearly not the case in reality as the electrons in the ions would be constantly moving and so the charge on the ions would not be evenly distributed. This approximation meant that the interactions between the ions in the system being simulated were being treated very differently from the interactions between the ions in an MgO lattice in real life. This would have a big effect on the volume of the lattice being calculated by the simulations, resulting in discrepancy between calculated thermal expansion coefficient and experimental values. There were also other approximations such as assuming the MgO lattice was perfect and that the lattice was infinitely large, which would have contributed to this difference.
Conclusion
The thermal expansion coefficient of magnesium oxide calculated using quasi-harmonic simulation from 300 to 1000 K was 2.8205 x 10⁻⁵ K-1 and the thermal expansion coefficient calculated using molecular dynamics from 100 to 1000 K was 2.9963 x 10⁻⁵ K-1, both these results were over double the value of the experimental value of 1.39 x 10⁻⁵ K-1. The reason why there was such a large difference between the calculated values and the experimental value was because of the numerous approximations made when simulating the magnesium oxide system.
References
- ↑ Y. He, S, Ingudam, S. Reed, A. Gehring, T. P. Strobaugh Jr, and P. Irwin, Journal of Nanobiotechnology, 2016, 14, 54.
- ↑ X. Liu and Y. Li, Cement and Concrete Research, 2005, 35, 1685-1687.
- ↑ 3.0 3.1 Y. Shiratori, F. Tietz, H. P. Buchkremer and D. Stover, Solid State Ionics, 2003, 163, 27-33.
- ↑ Dove, Martin T. (1993). Introduction to lattice dynamics, Cambridge university press.
- ↑ Kittel, Charles (1996). Introduction to Solid State Physics. New York City: Wiley.
- ↑ Frenkel, Daan and Smit, Berend. Understanding Molecular Simulation, Academic Press.
