Rep:Mod:SBrepp1
Cyclopentadienyl dimers

Dimerization of cyclopentadiene
Dimerization of cyclopentadiene is a classic example of a Diels-Alder cycloaddition. The reaction was studied by Alder himself [1] and the predominating product is always the endo dimer (molecule 2 in Figure 1). In order to assess whether the reason behind this selectivity is stability of the endo product (i.e. whether endo is the thermodynamic product), molecular mechanics simulation was performed using Avogadro software. The result is that the energy of the endo product (which is formed) is actually ca. 5% higher than exo:
| exo (1) | endo (2) |
|---|---|
| 55.37342 | 58.19067 |
This result suggests that the reactivity is instead controlled by activation energies (i.e. the endo product is the kinetic product). This is confirmed by the computaional study performed by Caramella et al. in 2002[2], who calculated energies of the transition states leading to both endo and exo products - the energy of the endo transition state was lower.
Hydrogentation of the endo dimer
The endo dimer can be hydrogenated and this process occurs stepwise - one bond is hydrogenated first. Literature shows that the principal product of the first hydrogenation is 4[3]. As above, molecular mechanics simulation was performed to compute energies of both products as well as various contributions to these energies:
| contribution | product 3 | product 4 |
|---|---|---|
| bond stretching | 3.31159 | 2.8231 |
| angle bending | 31.93276 | 24.68545 |
| stretch bending | -2.10217 | -1.6572 |
| torsional | -1.4684 | -0.37852 |
| out-of-plane bending | 0.01308 | 0.00028 |
| van der Waals | 13.63935 | 10.63737 |
| electrostatic | 5.11949 | 5.14702 |
| total | 50.4457 | 41.25749 |
As can be seen, product 4 is predicted to be more stable, which can be the reason behind the observed hydrogenation selectivity. The data in the above table shows that two major energy contributions (angle bending and van der Waals interaction energies) are both lower for product 4, which means that this product has both less bond strain and less "steric clash".
Atropoisomerism in a Taxol intermediate

Molecules 9 and 10, shown in Figure 2 are atropoisomers of a compound studied by Paquette[4]. In order to determine which of these is more stable, molecular mechanics simulation was performed in Avogadro software. First, it should be noted how many conformations of each atropoisomer are possible. After many trial-and-error optimizations, it was found that the cyclohexane ring in each atropoisomer can attain at most 6 different conformations, shown schematically in Figure 3.
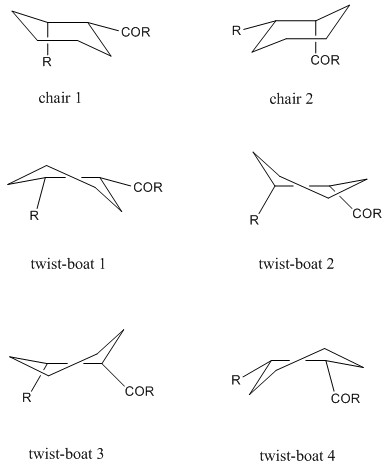
3D models, together with computed energies are shown below:
| conformation of the cyclohexane ring | 9 | 10 |
|---|---|---|
| chair - opposite | 70.55343 3D model | 60.55606 3D model |
| chair - aligned | 82.68761 3D model | 74.81268 3D model |
| twist-boat 1 | 77.91055 3D model | unstable |
| twist-boat 2 | 88.23044 3D model | unstable |
| twist-boat 3 | 94.22560 3D model | 68.87734 3D model |
| twist-boat 4 | unstable | 66.29247 3D model |
In the above table, the "opposite" chair form is the one where the CH2 carbon beta to the carbonyl points to the the opposite direction to the carbonyl oxygen and "aligned" chair is the one where it points in (approximately) the same way. These were the lowest energy conformers. In three cases, conformers couldn't be obtained, because they turned into others, for example the twist-boat 4 of atropoisomer 9 instantly turned into twist-boat 1.
The only remainig source of conformation changes is the configuration at the saturated, tertiary carbon atom in the norbornene ring. Figure 2 does not specify this configuration. It was found that when the hydrogen bonded to this carbon points inside the ring, the enrgies are much higher. All energies shown here are for configuration where it points outside (visible in the 3D models).
The most stable conformation of all is the "opposite" chair conformation of isomer 10. Hence, we can conclude that isomer 10 is more stable than 9. Therefore, a sample initially containing only 9 will after some time become a mixture of 9 and 10 with a (very large) excess of 10. The excess of isomer 10 will also determine the dominant product of a nucleophilic addition to the carbonyl group - during such reaction the nucleophile approaches the group with Burgi-Dunitz trajectory[5], so the dominant product will have the added nucleophile on the outside of the ring and the oxygen pointing down (as viewed in Figure 2).
Functionalization of the double bond in the compound 9/10 proceeds slower than expected. Maier et al.[6] found in their MM1 computations that some "bridgehead" alkenes can have less strain than their "parent" (unsaturated) hydrocarbons. Here, energies of the saturated counterparts of 9 and 10 were calculated:
| conformation of the cyclohexane ring | saturated 9 | saturated 10 |
|---|---|---|
| chair - opposite | 81.7523 3D model | 71.51038 3D model |
It was assumed that the lowest energy cyclohexane ring conformation of 9 and 10 also has the lowest energy in the saturated molecules. As can be seen above, saturated versions of 9 and 10 are both higher in energy (i.e. more strained) than these alkenes. This can be also true for the products of alkene functionalization meaning that the reaction is endothermic.
Spectroscopic simulation of other Taxol intermediates
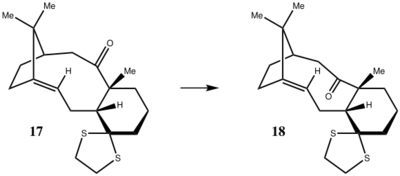
Compounds 17 and 18 shown in Figure 4. are derivatives of 9 and 10. Paquette at al. observed[7] that 17 converts to 18 when heated in a THF reflux for several days. In that paper, they reported the 1H and 13C spectra for both conformers.
Knowing that the chair conformations of 9 and 10 were more stable than twist-boat conformations, molecular mechanics simulations were set up in Avogadro software to explore energies of 2 chair conformations of 17 and 18 together with two conformations of the thioketal ring:
| HHCCHH clockwise | HHCCHH anticlockwise | |
| chair - opposite | 104.48086 | 104.31959 3D model |
| chair - aligned | 117.95593 | 118.41216 |
| HHCCHH clockwise | HHCCHH anticlockwise | |
| chair - opposite | 100.49966 | 100.44086 3D model |
| chair - aligned | 105.70536 | 105.77461 |
The lowest energy conformation (chair, clockwise CH2CH2 bridge) from the above tables was then used to optimize the molecule geometry using B3LYP/6-31G(d,p) simulation (performed in Gaussian software) and compute the 1H and 13C NMR shifts. The simulated 13C NMR spectrum for molecule 18 is shown in Figure 5, together with peaks reported by Paquette et al.[7]. Comparison of the corresponding peaks is shown in Figure 6.
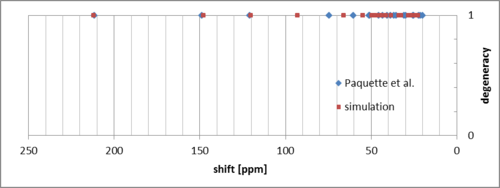

There appears to be a good match between the experimental and computed shifts, with some systematic error in the downfield peaks. The only exception is the peak at 92.8 ppm, which is downfield to its corresponding peak by ca. 18 ppm. The origin of this peak is the carbon atom bonded to two sulfur atoms, which may suggest that this can be due to spin-orbit coupling, like in case of carbon atoms bonded to heavier halogens[8]. 1H spectrum is shown below:

There is some resemblence, but the most upfield peak (due to alkene H) is quite moved upfield and the dispersion of other peaks around the experimental ones is large. After changing the conformation to "aligned" chair of the cyclohexane ring (CH2CH2 bridge clockwise), the simulated spectrum resembles the measured spectrum only a little more:

What is interesting, the alkene peak position changed by ca. 0.2 ppm despite the conformational changes made to the part of the molecule several atoms away.
Using similar B3LYP/6-31G(d,p) simulations, Gibbs free energies (G) of the molecules 17 and 18 were computed as well (as a sum of electronic and thermal G). In both cases, the solvent was set as chloroform.
| conformation of the cyclohexane ring | 17 | 18 |
|---|---|---|
| chair - opposite, CH2CH2 anticlockwise | -1651.459445 | -1651.464197 |
As expected, 18 has lower energy. In order to estimate the ratio of isomers in an equilibrium mixture at temperature T, the following equation was used:
where ΔG is the difference between the computed G values of 18 and 17. The value of K is 168 (ratio of 18 to 17), which means a very large excess of 18.
Asymmetric epoxidation of alkenes

Numerous catalysts, including Shi catalyst[9] and Jacobsen catalyst[10] (21 and 23 in Figure 7) can be used for asymmetrical epoxidation of alkenes. In the following investigation, epoxidation of the following alkenes using Shi and Jacobsen catalysts were invesigated:
- styrene
- trans-beta-methyl styrene
- cis-beta-methyl styrene
The reaction with either catalyst proceeds via transition state where oxygen atom is added from one face of the alkene (i.e. syn addition), so the possible products of the epoxidation are:
- styrene: (R)-styrene oxide, (S)-styrene oxide
- trans-beta-methyl styrene: (R,R)-trans-beta-methyl styrene oxide, (S,S)-trans-beta-methyl styrene oxide
- cis-beta-methyl styrene: (R,S)-trans-beta-methyl styrene oxide, (S,R)-trans-beta-methyl styrene oxide
Crystal structures of catalysts
NMR spectra simulation of expected products
In order to simulate the 1H and 13C NMR spectra of epoxides, their geometries were optimized using molecular mechanics (Avogadro software) and then the reults used to optimize the geometries using B3LYP/6-31G(d,p) simulation (performed in Gaussian software) and compute the 1H and 13C NMR shifts. Results are shown together with literature experimental values, which were recorded with the same solvent (chloroform) and reference compound (TMS). The spectra below assume no J-coupling: it isn't present in the simulations and the experimental values were entered as singlets with appropriate intensity (degeneracy). One can assume that the spectra of enantiomers would look identical (due to the same atoms, same connectivity and same bond angles in both enantiomers).
(R)-styrene oxide (3D model)
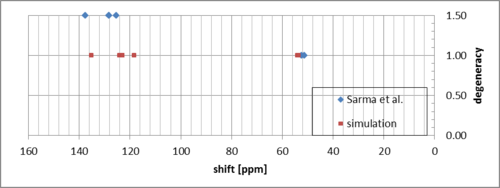
The simulation seems to match the measurements well, with some systematic error for the carbon atoms in the aromatic ring.

The five protons bonded to the aromatic ring match well. The simulated protons in the epoxide group are shifted slightly downfield.
(R,R)-trans-beta-methyl styrene oxide (3D model)


The simulated downfield peaks correspond to the methyl protons and in reality are equivalent - there is a single peak corresponding to these protons in the measured spectrum. The average shift value is quite close (1.33 ppm compared to the experimental 1.43 ppm). The rest compares to the experimental much like for (R,R)-trans-beta-methyl styrene oxide.
Simulation of specific rotation - assigning the absolute configuration
Another B3LYP/6-31G(d,p) simulation was set up to compute the specific rotation of (R)-styrene oxide and (R,R)-trans-beta-methyl styrene oxide. The results and comparison to the values reported in the literature are shown below:
| specific rotation at 589 nm, chloroform solution [deg] | |
| simulation | -30.12 |
| Forbes et al. [13] | -24 |
| Schrittwieser et al. [14] | -19.5 |
| White et al. [15] | -19.5 |
| specific rotation at 589 nm, chloroform solution [deg] | |
| simulation | 46.77 |
| Besse et al. [16] | 46 |
| Fronza et al. [17] | 47 |
| Pedragosa-Moreau et al. [18] | 45.7 |
As can be seen, there is a very good agreement both in sign and magnitude of specific rotations. The opposite enantiomers are expected to have exactly the opposite specfic rotations. Therefore, it's possible to assign the absolute configuration of a synthesized enantiomer with
large certainty using a simple polarimeter.
Relative energies of transition states - quantifying stereoselectivity
In order to estimate the selectivity of the catalysts, energies of reaction transition states were compared for different stereoisomeric products. From the Boltzmann distribution it follows that the ratio of numbers of molecules occupying energy levels differing in energy by ΔE is:
Here, molar Gibbs free energy (called "free energy" further) difference was used:
Using the above formula we can calculate the ratio of two products produced via pathways having transition states which free energy differ by ΔG. However, in case of reactions analysed, more than one pathway leads to a given product. As a crude simplification, K for each reaction was calculated using as ΔG the difference between the lowest G values among transitions states leading to given enantiomer. Temperature was taken as 293 K. From K the enantiomeric excess was calculated from its definition[19]. The real enantiomeric exess can be calculated from polarimetry measurements using a simple notion that specific rotation of a mixture of two enantiomers depends linearly on the ratio of enantiomers.
The transition state energies were computed using the wb97xd/6-311G(d,p) method. Water was set as solvent.
Shi catalyst - epoxidation of trans-beta-methyl styrene
The arrangement of the alkene and catalyst in the transition state depends on: a) whether (R,R) or (S,S)-product is formed b) which oxygen atom is transferred to the double bond c) whether the substrate is oriented in endo or exo fashion Therefore, there are 8 transition states possible:
| (R,R)-product | (S,S)-product | |
| endo 1 | -1343.032443 | -1343.023766 |
| endo 2 | -1343.02297 | -1343.015603 |
| exo 1 | -1343.029272 | -1343.024742 |
| exo 2 | -1343.019233 | -1343.017942 |
The product ratio obtained from above energies is 4022 (R,R product/S,S product) and enantiomeric excess is 99.95% (excess of R,R product). Wang et al. [9] carried this epoxidation in various non-aqueous solvents. Their epoxide product (dissolved in chloroform) had specific rotation of +47.8 degree which, according to the section above, means that the product was indeed (R,R). The enantiomeric excess obtained in the same paper is lower (usually 80%-90%), but these values can't really be compared since in the above computations water was assumed to be the solvent and the transition state energies can depend on the solvent used.
Jacobsen catalyst - epoxidation of cis-beta-methyl styrene
In this case, the arrangement of alkene and catalyst depends on: a) whether (S,R) or (R,S)-product is formed b) whether the substrate is oriented in endo or exo fashion Therefore, 4 transition states are possible:
| (S,R)-product | (R,S)-product | |
| endo | -3383.259559 | -3383.25027 |
| exo | -3383.253442 | -3383.25106 |
The product ratio obtained from above energies is 9505 (S,R product/R,S product) and enantiomeric excess is 99.98% (excess of S,R product). The exess obtained by Jacobsen et al.[10] was 92% for the reaction in dichloromethane, but again - these values can't really be compared because of different solvents. They report that the main product was (1S,2R)-(-), so the same enantiomer as the main product predicted here.
Non-covalent interactions in the active-site of a transition state
The energy of the transition state is influenced not only by the strain of the reacting molecules but also by the intermolecular interactions between them, including hydrogen bonds, electrostatic interactions and Van der Waals interactions (non-covalent interactions, NCI). For the transition state "endo 1" in epoxidation of trans-beta-methyl styrene (see: section above), these interactions were computed using Gaussian software and are visualized below:
RR TS 4 - endo 1 |
This is the lowest energy transition state in that reaction. As can be seen (green color denotes attraction), the Van der Waals interactions between the alkene and catalyst contribute to stabilization of the transition state.
Covalent interactions in the transition state
The same transition state was processed by a Quantum Theory of Atoms in Molecules (QTAIM) algorithm in the Avogardo software. Bond critical points are shown in the figure on the right.
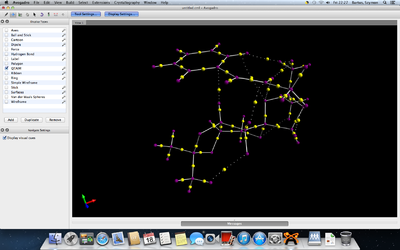
BCPs appeared both along covalent bonds and along along lines connecting atoms separated by distances expected for van der Waals interactions (see above). It's easy to notice that the BCP in the covalent bonds are shifted towards the more electropositive atoms.
References
- ↑ (a) Alder, K.; Stein, G. Liebigs Ann. Chem. 1933, 504, 210-257. (b) Alder, K.; Stein, G. Angew. Chem. 1934, 47, 837-842. DOI:10.1002/ange.19340475202 (c) Alder, K.; Stein, G. Angew. Chem. 1937, 50, 514-519.
- ↑ DOI:10.1021/ja016622h
- ↑ DOI:10.1021/ie0487437
- ↑ DOI:10.1016/S0040-4039(00)92617-0
- ↑ DOI:10.1016/S0040-4020(01)90678-7
- ↑ DOI:10.1021/ja00398a003
- ↑ 7.0 7.1 7.2 7.3 7.4 7.5 DOI:10.1021/ja00157a043
- ↑ DOI:10.1016/S0009-2614(98)00998-1
- ↑ 9.0 9.1 DOI:10.1021/ja972272g
- ↑ 10.0 10.1 DOI:10.1021/ja00018a068
- ↑ 11.0 11.1 DOI:10.1016/j.tetasy.2009.05.001
- ↑ 12.0 12.1 DOI:10.1021/jo060709+
- ↑ DOI:10.1016/j.tet.2008.10.019
- ↑ DOI:10.1016/j.tetasy.2009.02.035
- ↑ DOI:10.1016/j.tetasy.2003.09.024
- ↑ DOI:10.1016/0957-4166(94)80167-3
- ↑ DOI:10.1021/jo00021a011
- ↑ DOI:10.1016/0040-4020(96)00135-4
- ↑ DOI:10.1351/goldbook.E02070
