Rep:Mod:SAMROWE002
3rd Year Computational Chemistry - Sam Rowe
Module 2 - Bonding (ab initio and density functional molecular orbitals)
Introduction
The aim of Module 2 is to show how computational analysis can be incorporated into Inorganic Chemistry. In an Inorganic sense, computational techniques are useful in the assessment of the more unusual bonding systems which can be present in metal complexes. Additionally, supplementary data can also be calculated such as IR spectra, NMR spectra, dipole moments and thermodynamic information regarding stable states and energy barriers. Recently, theoretical methods have been employed to design better catalysts. It was reported[1] that the methods have been used to discover cheaper alloys which can selectively remove ethyne from a stream of ethene.
In this task, Gaussian 09W was employed to carry out the various calculations on each of the molecules. The HPC server was used for jobs which required extra computing power. GaussView 5 was used to create and prepare the molecules for Gaussian analysis as well as for visualising the vibrational spectra and the molecular orbitals of the optimised molecules.
During an optimisation, the Schrödinger equation is initially solved for the electron density (the SFC part of the calculation) with the nuclei held in a fixed position which conforms with the Born-Oppenheimer approximation. Next, the equation is solved for the position of the nuclei (the OPT part of the calculation). The nuclei are then moved and the two parts of the calculation are carried out again. The B3LYP method with a basis set of 3-21G is chosen because of the fast calculation speed. A drawback of this method is that the accuracy of this method is relatively low compared to higher level basis sets.
The two energies can then be compared directly and the internuclear separation with the lowest energy can then be used as the starting point for the next set of energy calculations. This process is repeated until the lowest energy configuration is found, and at this point, the geometry is said to be optimised. When the electrons and nuclei are in equilibrium, they experience no forces attempting to alter their positions. Taking this into account, the first derivative (i.e. the gradient) of a potential energy surface curve (potential energy at a particular position) will be zero at a minimum point. Unfortunately, the gradient will also be zero at a maximum point and at a point of inflection. To overcome this problem, the second derivative of the curve can be taken. A positive value relates to a minimum point and a negative value relates to a maximum point. All of these factors are used computationally to optimise the structure of a given molecule.
BH3
Geometry Optimisation
A molecule of BH3 was created on GaussView. A trigonal planar arrangement was selected and all of the bond lengths were set to 1.5Å. The molecule was then submitted to Gaussian so that its geometry could be optimised. The optimised molecule can be viewed in 3D by following the provided link. The summary of the optimisation is detailed below and the published LOG FILE[2] has been provided in the reference section:
BH3 Optimisation
File Name = BH3_OPT_2
File Type = .log
Calculation Type = FOPT
Calculation Method = RB3LYP
Basis Set = 3-21G
Charge = 0
Spin = Singlet
E(RB3LYP) = -26.46226338 a.u.
RMS Gradient Norm = 0.00020672 a.u.
Imaginary Freq = ---
Dipole Moment = 0.0000 Debye
Point Group = D3H
Job cpu time:  0 days  0 hours  0 minutes 32.0 seconds.
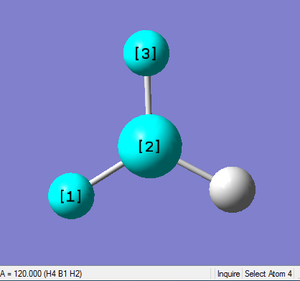
A dipole moment of zero can be attributed to the highly symmetrical nature of the molecule. BH3 was found to have H-B-H bond angles of 120.0° and a B-H bond distance of 1.19Å. This correlates with the liteature values of 1.19Å[3] for the bond length and 120°[4] for the bond angle. The output data and the bond angle is shown below:
                           !   Optimized Parameters   !
                           ! (Angstroms and Degrees)  !
 --------------------------                            --------------------------
 ! Name  Definition              Value          Derivative Info.                !
 --------------------------------------------------------------------------------
 ! R1    R(1,2)                  1.1935         -DE/DX =    0.0004              !
 ! R2    R(1,3)                  1.1935         -DE/DX =    0.0004              !
 ! R3    R(1,4)                  1.1935         -DE/DX =    0.0004              !
 ! A1    A(2,1,3)              120.0            -DE/DX =    0.0                 !
 ! A2    A(2,1,4)              120.0            -DE/DX =    0.0                 !
 ! A3    A(3,1,4)              120.0            -DE/DX =    0.0                 !
 ! D1    D(2,1,4,3)            180.0            -DE/DX =    0.0                 !
 --------------------------------------------------------------------------------
The section of the output file below confirms that the geometry has indeed been optimised. The Root Mean Squared (RMS) value is very close to 0 (below 0.001) which indicates that a minimum point on the graph has been found. The two corresponding graphs are also provided below:
Item               Value     Threshold  Converged?
 Maximum Force            0.000413     0.000450     YES
 RMS     Force            0.000271     0.000300     YES
 Maximum Displacement     0.001643     0.001800     YES
 RMS     Displacement     0.001076     0.001200     YES
 Predicted change in Energy=-1.018634D-06
 Optimization completed.
    -- Stationary point found.
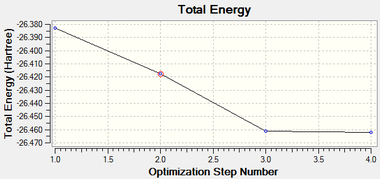
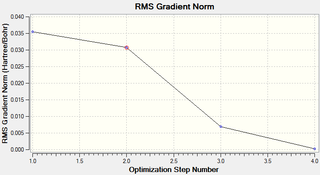
It can be seen that the geometry was fully optimised after 4 iterations. The energy curve can be seen to reach a minimum value and the RMS gradient curve can be seen to reach a value close to zero.
Frequency Analysis
A frequency analysis of BH3 was subsequently carried out on the optimised geometry of the molecule. This method predicts the IR spectrum of a given molecule as well as all of the vibrational modes within a given molecule. This type of analysis will determine whether the geometry has been fully optimised and a global minimum in terms of energy has been attained. If all the frequencies are positive, then a global minimum has been found. If any of the frequencies are found to be negative, it proves that the optimisation has been unsuccessful and the geometry is in fact a transition state.
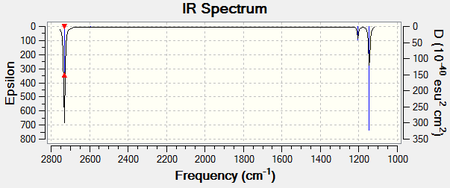
The following figure displays the predicted IR spectrum. The summary is also shown and the LOG FILE[5] is provided:
BH3 Frequency
File Name = sr2709_FREQ_2
File Type = .chk
Calculation Type = FREQ
Calculation Method = RB3LYP
Basis Set = 3-21G
Charge = 0
Spin = Singlet
E(RB3LYP) = -26.46226338 a.u.
RMS Gradient Norm = 0.00020672 a.u.
Imaginary Freq = ---
Dipole Moment = 0.0000 Debye
Point Group = ---
Job cpu time:  0 days  0 hours  0 minutes 18.0 seconds.
The frequency analysis has shown that there are six different vibrational modes associated with the molecule which contribute to the appearance of the bands within the IR spectrum. The following table describes each of the stretching modes:
| Type of Vibrational Mode | Diagram of Vibrational Mode | Description of Vibration Mode | Frequency of Vibrational Mode
(cm-1) |
Intensity of Vibrational Mode | Literature[6] Frequency
(cm-1) |
Percentage Difference |
|---|---|---|---|---|---|---|
| A2 ' ' | 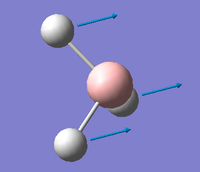 |
Umbrella deformation. All the Hydrogens move in a concerted motion backwards and forwards between the two opposite faces of the Boron atom. | 1144 | 93 | 1147.5 | 0.3% |
| E' | 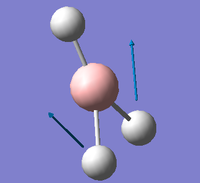 |
Symmetric B-H scissoring. One B-H bond remains static as the other two Hydrogens move in a symmetric, concerted rocking backwards and forwards. | 1204 | 12 | 1196.7 | 0.6% |
| E' | 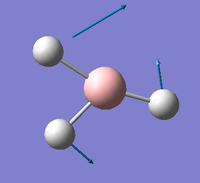 |
Asymmetric B-H rock. All B-H bonds rock backwards and forwards with two of the Hydrogens rocking with less magnitude than the third. | 1204 | 12 | 1196.7 | 0.6% |
| A1 ' | 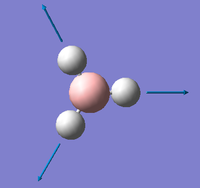 |
Completely symmetric B-H stretch. All B-H bonds stretch in a concerted motion showing elongation to a maximum point followed by a shortening of the bond as the Hydrogen approaches the Boron atom. | 2598 | 0 | 2503 | 3.8% |
| E' | 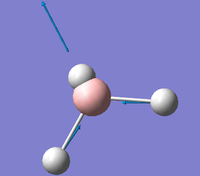 |
Asymmetric B-H stretch. Two B-H bonds stretch symmetrically with respect to each other but asymmetrically with respect to the third B-H bond. | 2737 | 104 | 2601.6 | 5.2% |
| E' | 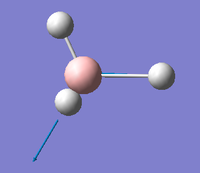 |
Asymmetric B-H stretch. One B-H bond remains static as the other two stretch in an asymmetric fashion. | 2737 | 104 | 2601.6 | 5.2% |
Even though six vibrational modes have been predicted for the molecule, the IR spectrum only exhibits three peaks. This can be rationalised by assessing the types of vibrational modes present. The pairs of E' type modes are degenerate meaning that only one peak will be found for these vibrations. Additionally, the A1' mode is totally symmetric meaning that there is no change in dipole moment as the motion takes place. No change in dipole moment results in the absence of a peak at this frequency.
The predicted spectrum was found to be much more accurate at lower wavenumbers and there are some fairly large percentage differences associated with the peaks above 2000cm-1. These findings are consistent with those found in MODULE 1[7]. The predicted peaks were all found to be within 8% of the literature[8] which is known to be the maximum error to take into consideration when dealing with this strategy of predicting IR peaks[9].
Molecular Orbital Analysis
The optimised BH3 molecule was then used as a precursor for molecular orbital analysis. The file was submitted to the SCAN server with the 'Energy' and 'Full NBO' options selected to ensure the correct process was carried out. This produced the following LOG FILE[10]. The eight molecular orbitals which were lowest in energy have been visualised and analysed. The following figure displays the energy (in Hartrees) of each of these levels:
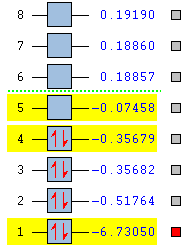
It can be seen that the MO labelled 4 is the HOMO and the MO labelled 5 is the LUMO. The accuracy of this method can be analysed by creating a molecular orbital diagram from first principles using the LCAO (Linear Combination of Atomic Orbitals) approach. The BH3 molecule was first split in to two fragments: the H3 unit and the B unit. Both of the fragments have a a similar electronegativity (Hydrogen = 2.08 and Boron = 1.85)[11] but Boron is slightly more electropositive. Therefore, it was deemed that the H3 fragment orbitals should be placed at a slightly lower energy than the B fragment orbitals. The symmetry labels were determined for each orbital and a combination was allowed between orbitals of the same symmetry. Finally, the electrons were added to the molecular orbitals (three for the H3 unit and five for the B unit) for facile determination of the HOMO and LUMO levels. The Boron 1s atomic orbital (symmetry label = a1') has been excluded from the diagram, following the usual convention because it is very low in energy. This notion has been proven by the fact that this MO has a value of -6.73 Ha whereas the rest of the MO's have energy values much closer to 0 Ha. This orbital was predicted by the computational molecular orbital analysis and has been included below:
The MO diagram was produced on ChemDraw Pro 12.0 and the predicted molecular orbitals have been placed next to the corresponding orbitals which were found through the LCAO method. The exact order of the top two orbitals was difficult to predict qualitatively. In one sense, the original a1' orbitals are lower than the e' orbitals making it likely that the post-mixing 3a1' level is lower than the 2e' level. On the other hand, s-s antibonding interactions are stronger than s-p antibonding interactions leading to the 3a1' level actually being higher in energy[12]. Further mathematical calculations would need to be carried out to determine the exact order of these energy levels if computational methods were unavailable:
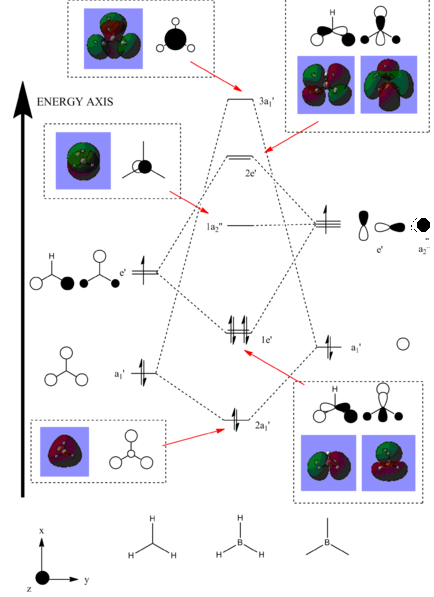
The computationally predicted molecular orbitals show an excellent likeness to the ones found qualitatively. There aren't any major differences between the pairs of diagrams suggesting that computational analysis for this purpose is very accurate for small molecules such as BH3. As the complexity of a given molecule is raised and the number of electrons is increased, the computing power required will be much higher.
Charge Distribution And NBO Analysis
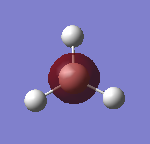
Since the 'Full NBO' option was selected for the molecular orbital analysis, the same LOG FILE[13] also contains information regarding the charge distribution and Natural Bond Orbitals (NBOs) of BH3. An option within GaussView allows the atoms to be coloured with respect to the relative charge distribution. The colour is bright red for highly negative atoms and bright green for highly positive regions. It can be seen that the Boron atom is bright green because of its high Lewis acidity (the Boron has a vacant p orbital which is able to readily accept electron density).
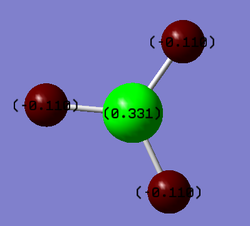
The matching data is given below:
Summary of Natural Population Analysis:

                                       Natural Population
                Natural  -----------------------------------------------
    Atom  No    Charge         Core      Valence    Rydberg      Total
 -----------------------------------------------------------------------
      B    1    0.33161      1.99903     2.66936    0.00000     4.66839
      H    2   -0.11054      0.00000     1.11021    0.00032     1.11054
      H    3   -0.11054      0.00000     1.11021    0.00032     1.11054
      H    4   -0.11054      0.00000     1.11021    0.00032     1.11054
 =======================================================================
   * Total *    0.00000      1.99903     6.00000    0.00097     8.00000
Each Hydrogen has the same natural charge value because of the high symmetry of the molecule. Each of these three charges cancel out the natural charge associated with the Boron atom to give a neutral molecule. This file also contains some information about the nature of the bonds between the atoms within the molecule. This section is given below:
(Occupancy)   Bond orbital/ Coefficients/ Hybrids
 ---------------------------------------------------------------------------------
     1. (1.99853) BD ( 1) B   1 - H   2
                ( 44.48%)   0.6669* B   1 s( 33.33%)p 2.00( 66.67%)
                                            0.0000  0.5774  0.0000  0.0000  0.0000
                                            0.8165  0.0000  0.0000  0.0000
                ( 55.52%)   0.7451* H   2 s(100.00%)
                                            1.0000  0.0000
     2. (1.99853) BD ( 1) B   1 - H   3
                ( 44.48%)   0.6669* B   1 s( 33.33%)p 2.00( 66.67%)
                                            0.0000  0.5774  0.0000  0.7071  0.0000
                                           -0.4082  0.0000  0.0000  0.0000
                ( 55.52%)   0.7451* H   3 s(100.00%)
                                            1.0000  0.0000
     3. (1.99853) BD ( 1) B   1 - H   4
                ( 44.48%)   0.6669* B   1 s( 33.33%)p 2.00( 66.67%)
                                            0.0000  0.5774  0.0000 -0.7071  0.0000
                                           -0.4082  0.0000  0.0000  0.0000
                ( 55.52%)   0.7451* H   4 s(100.00%)
                                            1.0000  0.0000
     4. (1.99903) CR ( 1) B   1           s(100.00%)
                                            1.0000  0.0000  0.0000  0.0000  0.0000
                                            0.0000  0.0000  0.0000  0.0000
     5. (0.00000) LP*( 1) B   1           s(100.00%)
The first three orbitals detail the electronic contributions from each of the atoms towards the bond between them. It is evident that the Hydrogens contributes 55.52% of the electron density to the B-H bonds and the Boron contributes 44.48%. Boron is a more electropositive atom so it makes sense that it contributes less electron density to the bond. This section can also be used to determine the hybridisation of each of the bonds. The first three orbitals have a 1:2 ratio between the s character and the p character of the bond. This relates to an sp2 hybridised bond, conforming with the D3h point group and the H-B-H bond angles of 120°. Orbital 4 is the core 1s atomic orbital of the Boron atom. Being the 1s orbital, it is logical that there is 100% s character associate with it. Orbital 5 is the unoccupied p orbital on the Boron atom. The data above actually suggests that this orbital has 100% s character which shouldn't be the case. This orbital should in fact have 100% p character. This error could be attributed to the fact that this method of characterisation isn't completely accurate and the data collected should always be thoroughly reviewed before taking it as fact.
TlBr3
For the next part of the module, a molecule of TlBr3 is to be analysed computationally. Molecules such as TlBr3 are far more complex than a simple molecule like BH3 by virtue of the fact that they contains many more electrons. The molecule has a total of 186 electrons and exhibits relativistic effects which cannot be recovered by the standard Schrödinger equation. The main assumption for a system with many electrons is that it is only the valence electrons which predominate in the bonding interactions. The remaining core electrons can be modelled using pseudo potentials[14] to make the computations much faster and simpler. Additionally, a higher level basis set needs to be employed for the TlBr3 calculations. A larger basis set is important to consider for second row (and below) elements because a more thorough analysis of the molecule can be acquired.
Geometry Optimisation
First, the molecule was created on GaussView and was assigned a trigonal planar geometry. The point group of the molecule was constricted to D3h and the tolerance was increased to 'very tight (0.0001)'. This will greatly reduce the time taken for the calculations to be completed. The molecule was then submitted to the SCAN server for a geometry optimisation. The DFT-B3LYP method was used with the LANL2DZ basis set which is a medium level basis set and takes pseudo potentials into account. The LOG FILE[15] is provided and the summary is shown below:
TlBr3 Optimisation
File Name = TLBR3_OPTIMISATION
File Type = .log
Calculation Type = FOPT
Calculation Method = RB3LYP
Basis Set = LANL2DZ
Charge = 0
Spin = Singlet
E(RB3LYP) = -91.21750131 a.u.
RMS Gradient Norm = 0.00275003 a.u.
Imaginary Freq = ---
Dipole Moment = 0.0000 Debye
Point Group = D3H
Job cpu time:  0 days  0 hours  0 minutes 35.0 seconds.
A dipole moment of zero can be attributed to the highly symmetrical nature of the molecule. TlBr3 was found to have Br-Tl-Br bond angles of 120.0° and a Tl-Br bond distance of 2.65Å. This is fairly consistent with the literature values of 2.52Å[16] and 120°[17].
 ----------------------------
                           !   Optimized Parameters   !
                           ! (Angstroms and Degrees)  !
 --------------------------                            --------------------------
 ! Name  Definition              Value          Derivative Info.                !
 --------------------------------------------------------------------------------
 ! R1    R(1,2)                  2.651          -DE/DX =    0.0                 !
 ! R2    R(1,3)                  2.651          -DE/DX =    0.0                 !
 ! R3    R(1,4)                  2.651          -DE/DX =    0.0                 !
 ! A1    A(2,1,3)              120.0            -DE/DX =    0.0                 !
 ! A2    A(2,1,4)              120.0            -DE/DX =    0.0                 !
 ! A3    A(3,1,4)              120.0            -DE/DX =    0.0                 !
 ! D1    D(2,1,4,3)            180.0            -DE/DX =    0.0                 !
 --------------------------------------------------------------------------------
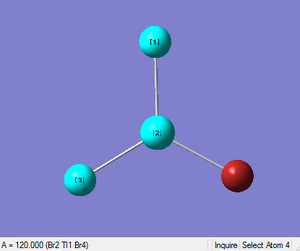
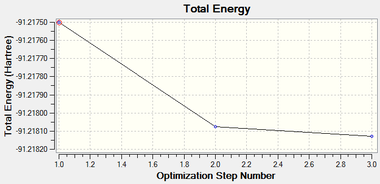
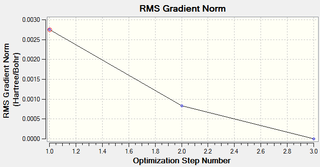
The optimisation was found to be successful as the RMS values were very close to zero. The geometry was optimised in three iterations:
 Item               Value     Threshold  Converged?
 Maximum Force            0.000002     0.000450     YES
 RMS     Force            0.000001     0.000300     YES
 Maximum Displacement     0.000022     0.001800     YES
 RMS     Displacement     0.000014     0.001200     YES
 Predicted change in Energy=-6.082801D-11
 Optimization completed.
    -- Stationary point found.
Frequency Analysis
The frequency analysis of TlBr3 was then carried out to support the notion that a global minimum has been found. As before, if all the frequencies are positive, then a global minimum has been found. If any of the frequencies are found to be negative, it proves that the optimisation has been unsuccessful and the geometry is in fact a transition state. The LOG FILE[18] for the frequency analysis is provided and the summary of the computation is given below:
TlBr3 Frequency
File Name = sr2709_TlBr3_freq
File Type = .log
Calculation Type = FREQ
Calculation Method = RB3LYP
Basis Set = LANL2DZ
Charge = 0
Spin = Singlet
E(RB3LYP) = -91.21812851 a.u.
RMS Gradient Norm = 0.00000088 a.u.
Imaginary Freq = ---
Dipole Moment = 0.0000 Debye
Point Group = D3H
Job cpu time:  0 days  0 hours  0 minutes 40.0 seconds.
The following IR spectrum was predicted for TlBr3:
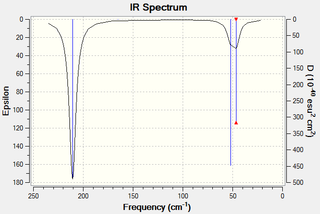
As with the BH3 molecule, six vibrational modes were found. These are described below:
| Type of Vibrational Mode | Diagram of Vibrational Mode | Description of Vibration Mode | Frequency of Vibrational Mode
(cm-1) |
Intensity of Vibrational Mode | Literature[19] Frequency
(cm-1) |
Percentage Difference |
|---|---|---|---|---|---|---|
| E' | 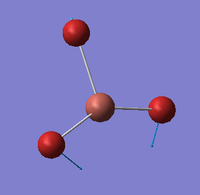 |
Symmetric Tl-Br scissoring. One Tl-Br bond remains static as the other two Bromines move in a symmetric, concerted rocking backwards and forwards. | 46 | 4 | 47 | 2.1% |
| E' | 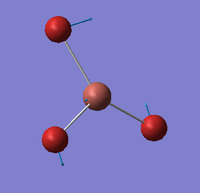 |
Asymmetric Tl-Br rock. All Tl-Br bonds rock backwards and forwards with two of the Bromines rocking with less magnitude than the third. | 46 | 4 | 47 | 2.1% |
| A2 ' ' | 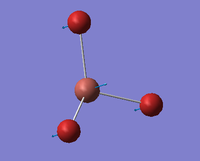 |
Umbrella deformation. All the Bromines move in a concerted motion backwards and forwards between the two opposite faces of the Thallium atom. | 52 | 6 | 63 | 17.5% |
| A1 ' | 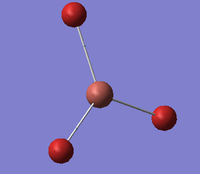 |
Completely symmetric Tl-Br stretch. All Tl-Br bonds stretch in a concerted motion showing elongation to a maximum point followed by a shortening of the bond as the Bromine approaches the Thallium atom. | 165 | 0 | 185 | 10.8% |
| E' | 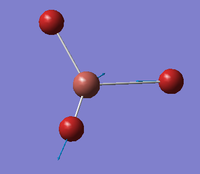 |
Asymmetric Tl-Br stretch. One Tl-Br bond remains static as the other two stretch in an asymmetric fashion. | 211 | 25 | 203 | 3.9% |
| E' | 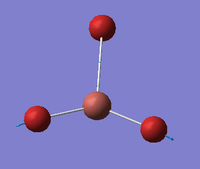 |
Asymmetric Tl-Br stretch. Two Tl-Br bonds stretch symmetrically with respect to each other but asymmetrically with respect to the third Tl-Br bond. | 211 | 25 | 203 | 3.9% |
Please note that the literature[20] values are actually those for the following thallic bromide system: TlBr3-LiBr 1:1 in EtOH. Although the exact molecule wasn't found, it is still possible to roughly compare the vibrational modes with this system. Only three peaks are observed in the spectrum because the pairs of e' vibrational modes are degenerate, leading to only one peak in this region. Also, the a1' vibrational mode is totally symmetric meaning that its motion does not incur a change in dipole moment in the molecule and doesn't relate to a peak. All of the percentage differences are relatively low considering that the comparison is between a slightly different thallic system.
The following low frequencies (cm-1) have been retrieved from the frequency analysis LOG FILE[21]:
Low frequencies --- -3.4213 -0.0026 -0.0004 0.0015 3.9367 3.9367
The lowest "real" normal mode is at 46cm-1 for the e' symmetry mode. The better the quality of the method employed, the closer to zero the low frequency values will be. It can be seen that these values are much lower than the first "real" frequency so it is possible to take the vibrational modes as accurate.
What Is A Bond?
Sometimes, GaussView will not actually draw bonds where they are expected. This is because GaussView already has a pre-defined list of bond lengths within its system. Therefore, if a molecule does not conform to these standards, a line will not be drawn between the two atoms. However, this does not necessarily mean that there isn't a bond present. When considering Inorganic molecules, the bonds lengths can actually be longer than those in normal Organic systems and aren't detected by GaussView. This is a fairly simplistic approach and should not be taken as fact. Hence, chemical intuition should always be applied to the analysis of optimised molecules.
This ultimately leads to the question: What Is A bond?. The three main types of bond can be described in simple terms. An ionic chemical bond can be defined as the electrostatic attraction between two oppositely charged atoms. A metallic chemical bond can be defined as loosely bound, delocalised electrons associated with positively charged nuclei held in fixed positions. A covalent chemical bond can be defined as the overlap of valence electronic molecular orbitals between two atoms. This can result in anything from a single bond to a quadruple bond depending on the number of electrons involved. As a chemist, it is possible to qualitatively analyse a particular chemical bond in terms of the atom type as well as other factors such as reactivity and steric environment. Computationally, only a quantitative analysis can be used and the method must abide by strict parameters.
Isomers of Mo(CO)4L2
The cis- and trans- isomers of this complex were studied in the second year laboratory course, experiment 4 (spring term). In these labs, the L type ligand was PPh3. The trans- complex was found to only exhibit one stretching frequency in the carbonyl region whereas the cis- complex displayed four. Using computational techniques, it is possible to model both of the isomers, optimise their geometries and predict the streching modes, and thus the IR specta, associated with each. For this analysis, the PPh3 ligands are too complex by virtue of the fact that they contain a high number of electrons and the computing power required is beyond the scope of this module. Therefore, the Phenyl groups have been altered to Chlorine atoms producing a complex containing 17 atoms and 230 electrons. This is a useful strategy to use because the Chlorine atoms have an equivalent steric demand and contribute similarly in terms of bonding.
Geometry Optimisation
First, the two isomers were drawn on GaussView. The cis- isomer and the trans- isomer can be viewed in 3D by following the links. Next, a loose optimisation method was employed to roughly set the geometry in the correct position. For this, the B3LYP method was used with a basis set of LANL2MB (minimum basis). This is an example of a low level basis set and pseudo potential. The initial LOG FILES (cis-[22] and trans-[23]) are provided. The loosely optimised structures give a good starting point for a further, more thorough, optimisation.
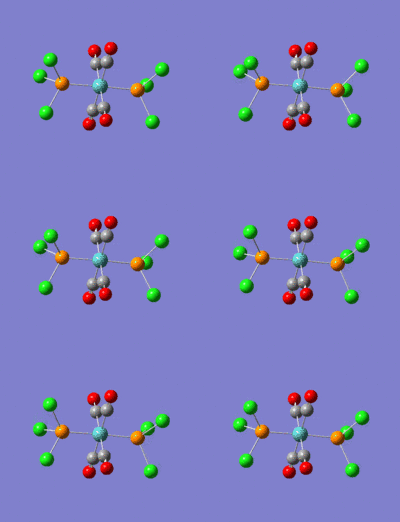
The loosely optimised structures are quite accurate but can be tweaked further to allow a faster optimisation. Manually, it was possible to alter the dihedral angles within both of the isomers. The trans- isomer was given a dihedral angle of 0° between the Chlorine atoms on the trans- Phosphorus atoms. From above, the three Chlorine are now in an eclipsed conformation. For the cis- isomer, a Chlorine atom attached to one of the Phosphorus ligands was given a dihedral of 0° with respect to a carbonyl ligand. A Chlorine atom attached to the second Phosphorus ligand was then given a dihedral angle of 180° with respect to the same carbonyl ligand. An image of these dihedral angles is shown below:
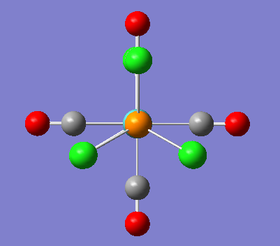
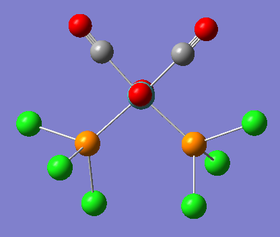
Once these dihedral angles had been set, a more thorough geometry optimisation was carried out using better pseudo potential and basis set. The method used was B3LYP with the LANL2DZ (double zeta) basis set. Furthermore, 'int=ultrafine scf=conver=9' was typed into the keywords section of the gaussian calculation setup page. The job was run on the SCAN server and produced the following LOG FILES (cis-[24] and trans-[25]). The optimisation summaries are also provided below:
Cis - Proper Optimisation
File Name = CIS_FULLY_OPTIMISED
File Type = .fch
Calculation Type = FOPT
Calculation Method = RB3LYP
Basis Set = LANL2DZ
Charge = 0
Spin = Singlet
E(RB3LYP) = -623.57707194 a.u.
RMS Gradient Norm = 0.00000787 a.u.
Imaginary Freq = ---
Dipole Moment = 1.3097 Debye
Point Group = ---
Job cpu time:  0 days  0 hours  18 minutes 2.0 seconds.
Trans Mo - Proper Optimisation
File Name = TRANS_FULLY_OPTIMISED
File Type = .fch
Calculation Type = FOPT
Calculation Method = RB3LYP
Basis Set = LANL2DZ
Charge = 0
Spin = Singlet
E(RB3LYP) = -623.57603101 a.u.
RMS Gradient Norm = 0.00003216 a.u.
Imaginary Freq = ---
Dipole Moment = 0.3049 Debye
Point Group = ---
Job cpu time:  0 days  0 hours  12 minutes 32.0 seconds.
All of the bond lengths were measured in the fully optimised structures. The results are shown below:
| Diatomic Bond | Cis- Isomer Bond Length (Å) | Literature[26] Bond Length (Å) | Trans- Isomer Bond Length (Å) | Literature[27] Bond Length (Å) |
|---|---|---|---|---|
| Mo-C | 2.01 | 2.01 | 2.06 | 1.87 |
| C-O | 1.18 | 1.15 | 1.17 | 1.15 |
| Mo-P | 2.51 | 2.58 | 2.44 | 2.37 |
| P-Cl | 2.24 | 1.83 | 2.24 | --- |
It wasn't possible to locate a reference containing the same complexes which were analysed in this part of the module. Therefore, two very similar complexes have been found in the literature. The trans- isomer has been compared with trans-Cr(CO)4(PPH3)2 and the cis- isomer has been compared with cis-Mo(CO)4(PPH3)2. All of the bond distances show a good correlation with the literature. The bond distance which is most dissimilar to that in the literature is that for P-Cl. If more complex orbital interactions are taken into account, a more accurate bond distance can be predicted. The Mo-P bonds show the greatest difference between the cis- and trans- isomers with the cis- isomer having a longer, and hence weaker, bond. This is due to the fact that this isomer is forced to lengthen the Mo-P bond because of the close proximity of the two bulky trichlorophosphine ligands. This arrangement causes unfavourable interactions and a less thermodynamically stable configuration.
Advanced Geometry Optimisation
It is possible to modify the Gaussian input file further to allow for d-orbital interactions to be taken into consideration. This becomes important when an atom like Phosphorus is being analysed because it has a propensity towards hypervalency. The updated input files were submitted to the SCAN server and the following results were obtained. The LOG FILES (cis-[28] and trans-[29]) have also been provided.
Cis - Proper Optimisation
File Name = CIS_EXTRA_OPTIMISED
File Type = .fch
Calculation Type = FOPT
Calculation Method = RB3LYP
Basis Set = GEN
Charge = 0
Spin = Singlet
E(RB3LYP) = -623.69291231 a.u.
RMS Gradient Norm = 0.00000587 a.u.
Imaginary Freq = ---
Dipole Moment = 0.0744 Debye
Point Group = ---
Job cpu time:  0 days  0 hours  20 minutes 49.0 seconds.
Trans Mo - Proper Optimisation
File Name = TRANS_EXTRA_OPTIMISED
File Type = .fch
Calculation Type = FOPT
Calculation Method = RB3LYP
Basis Set = GEN
Charge = 0
Spin = Singlet
E(RB3LYP) = -623.69415609 a.u.
RMS Gradient Norm = 0.00000695 a.u.
Imaginary Freq = ---
Dipole Moment = 0.2300 Debye
Point Group = ---
Job cpu time:  0 days  0 hours  15 minutes 2.0 seconds.
All of the bond lengths were measured for the optimised structures which were produced by taking d atomic orbital contributions into consideration. The results are shown below:
| Diatomic Bond | Cis- Isomer Bond Length (Å) | Literature[30] Bond Length (Å) | Trans- Isomer Bond Length (Å) | Literature[31] Bond Length (Å) |
|---|---|---|---|---|
| Mo-C | 2.02 | 2.01 | 2.06 | 1.87 |
| C-O | 1.18 | 1.15 | 1.17 | 1.15 |
| Mo-P | 2.48 | 2.58 | 2.42 | 2.37 |
| P-Cl | 2.12 | 1.83 | 2.12 | --- |
By taking these further orbital effects into consideration, it is possible to see that much more accurate bond lengths have been predicted. This is especially true for the P-Cl bond length which has decreased by 0.12Å and is much closer to the reported literature value. The extra d-orbital interactions allow more favourable interactions to occur between the Phosphorus and the Molybdenum metal centre. This electron donation allows for a stronger bond to be formed and hence a shorter bond length.
Interestingly, the trans- effect of ligands can also be seen in these results. In the cis- isomer, the trans- effect can occur between the carbonyl ligands and the Phosphorus ligands. In this isomer, the Phosphorus is able to donate electron density to the metal centre. This induces greater back bonding to the carbonyl ligand situated trans- to the Phosphorus. This can be seen by the fact that the Mo-C bond is shorter (made stronger by the increased back bonding) for the cis- isomer. In addition to this, the C-O bond can be seen to be longer (made weaker by the increased back bonding) for the cis- isomer.
Frequency Analysis
The optimised structures were then submitted to the SCAN server for a full frequency analysis. This produced the two following spectra and the following two LOG FILES (cis-[32] and trans-[33]):
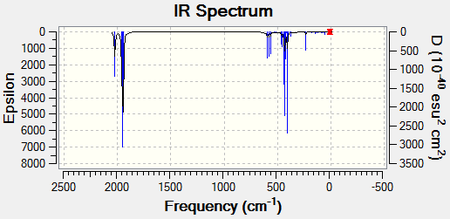
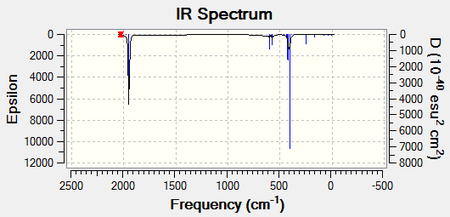
The carbonyl region can be analysed further by looking at all the individual vibrational modes for both of the isomers. The lowest stretching frequencies have also been provided as animations. These vibrational modes are associated with the Mo-P bonds.
Each type of vibrational mode has been determined using the point groups of the complexes. The point group of the cis-isomer is C2v and the point group of the trans- isomer is D4h.
| Type of Vibrational Mode | Diagram of Vibrational Mode | Description of Vibration Mode | Frequency of Vibrational Mode
(cm-1) |
Intensity of Vibrational Mode | Literature Frequency[34]
(cm-1) |
Percentage Difference |
|---|---|---|---|---|---|---|
| --- | 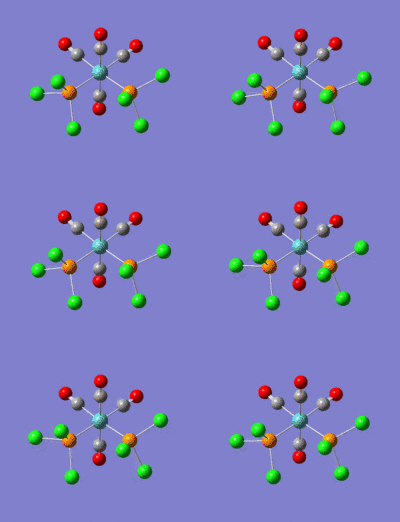 |
Rotation of the PCl3 groups around the Mo-P bond. Both groups rotate symmetrically. | 11 | 0 | --- | --- |
| --- | 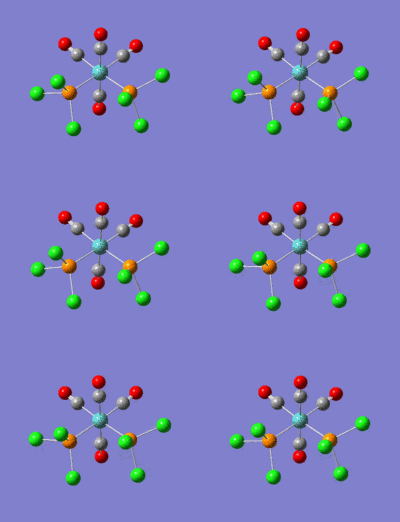 |
Rotation of the PCl3 groups around the Mo-P bond. Both groups rotate asymmetrically. | 18 | 0 | --- | --- |
| B2' | 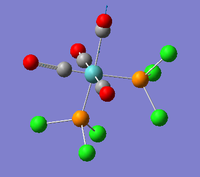 |
The two carbonyl groups trans- to the PCl3 groups stretch asymmetrically. | 1945 | 763 | 1869 | 4.1% |
| B2 | 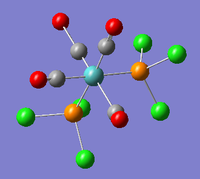 |
The two trans- carbonyl groups stretch asymmetrically. | 1949 | 1499 | 1896 | 2.8% |
| A1' | 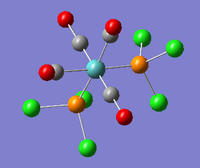 |
Stretching mode for all four carbonyl groups. The two pairs stretch asymmetry with respect to one another. | 1956 | 633 | 1924 | 1.7% |
| A1' | 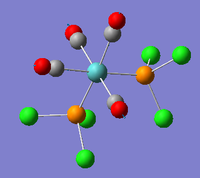 |
Stretching mode for all four carbonyl groups. The two pairs stretch symmetry with respect to one another. | 2023 | 598 | 2026 | 0.5% |
| Type of Vibrational Mode | Diagram of Vibrational Mode | Description of Vibration Mode | Frequency of Vibrational Mode
(cm-1) |
Intensity of Vibrational Mode | Literature Frequency[35]
(cm-1) |
Percentage Difference |
|---|---|---|---|---|---|---|
| --- |  |
Rotation of the PCl3 groups around the Mo-P bond. Both groups rotate symmetrically. | 5 | 0 | --- | --- |
| --- |  |
Rotation of the PCl3 groups around the Mo-P bond. Both groups rotate asymmetrically. | 6 | 0 | --- | --- |
| Eu | 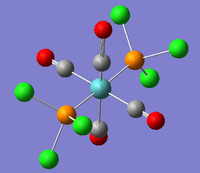 |
Two trans- carbonyl groups stretch asymmetrically. | 1950 | 1475 | 1890 | 3.2% |
| Eu | 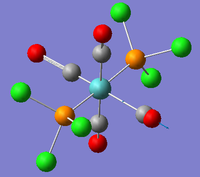 |
The other two trans- carbonyl groups stretch asymmetrically. | 1951 | 1467 | 1890 | 3.2% |
| B1g | 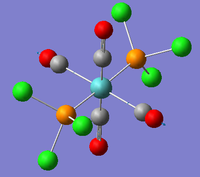 |
Stretching mode for all four carbonyl groups. The two pairs stretch asymmetry with respect to one another. | 1977 | 1 | --- | --- |
| A1g | 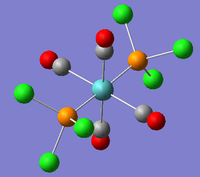 |
Stretching mode for all four carbonyl groups. The two pairs stretch symmetry with respect to one another. | 2031 | 4 | --- | --- |
The predicted frequencies for each of the carbonyl stretches relate very well to the literature and display a low percentage difference. It is evident that the cis- isomer has four distinct vibrational modes solely associated with the carbonyl groups. The four modes can be isolated because each of them are found with a high intensity at isolated wavenumbers. The trans- isomer only has one distinct vibrational mode associated with the carbonyl groups. The vibrational modes at 1977cm-1 and 2031cm-1 have such low intensities because the mode does not change the dipole moment of the complex. This means that a peak will not be present at these positions. Although it would appear that there are two more distinct modes however, the 1950cm-1 and 1951cm-1 are in fact degenerate and will therefore display only one peak. There is a slight difference between the two peaks because this method for predicting IR vibrational modes is not 100% accurate.
Advanced Frequency Analysis
As with the geometry optimisation, the gaussian input files were modified to take into account d atomic orbital contributions. The revised files were then submitted to the SCAN server for frequency analysis. This produced the following LOG FILES (cis-[36] and trans-[37]) The four carbonyl vibrational modes were only found to alter slightly between the two types of frequency analysis. A noticeable difference was found between the low energy vibrational modes. These low frequencies have been tabulated below:
| Description of Vibrational Mode | Cis- Isomer - Frequency of Vibrational Mode
(cm-1) |
Intensity of Vibrational Mode | Trans- Isomer - Frequency of Vibrational Mode
(cm-1) |
Intensity of Vibrational Mode |
|---|---|---|---|---|
| Rotation of the PCl3 groups around the Mo-P bond. Both groups rotate symmetrically. | 60 | 0 | 49 | 0 |
| Rotation of the PCl3 groups around the Mo-P bond. Both groups rotate asymmetrically. | 67 | 0 | 67 | 0 |
All of the peaks have shifted to higher wavenumbers meaning that there is a stronger bond between the Molybdenum and the Phosphorus. Both of the Mo-P bonds rotate at a very low frequency meaning that the energy required to allow this vibrational mode is very small. With Molybdenum being a relatively heavy element, the reduced mass of the bond is high. The inverse relationship between reduced mass and vibrational frequency means that a low frequency will be attained when there is a high reduced mass. At room temperature, the complex already has enough energy to allow this vibrational mode. This suggests that at room temperature, there is free rotation around this bond.
Relative Energies Of The Two Isomers
The geometry optimisations have provided a method of comparing the two isomers in an energetic sense. The 'Summary' section of the file details the total energy of each system. BEFORE the advanced geometry optimisation, the cis- isomer has an energy of -623.5771 Ha and the trans- isomer has an energy of -623.5760 Ha. AFTER the advanced geometry optimisation, the cis- isomer has an energy of -623.6929 Ha and the trans- isomer has an energy of -623.6942 Ha. It is known[38] that there is roughly a 10 kJ mol-1 error associated with these energy values. In Hartrees, the error is roughly 0.0038 Ha.
Before the extra interactions were considered, it can be seen that the cis- isomer is the most thermodynamically stable by approximately 2.89 kJ mol-1. However, after the extra interactions were considered, it is in fact the trans- isomer which is predicted to be the most thermodynamically stable by approximately 3.41 kJ mol-1. The latter prediction is the one which agrees with the literature and the experimental analysis carried out during the second year laboratory course. It was found that the cis- isomer will isomerise to form the trans- isomer at elevated temperatures. Once this initial energy barrier is passed, the isomer will exist solely as the trans-configuration. This is also supported by the decomposition temperatures of the two complexes. These are 148°C - 150°C for the cis- isomer[39] and 163°C - 168°C for the trans- isomer[40].
It is possible to vary the relative stability of the two isomers by altering the substituents attached to the Phosphorus atoms. Changing the substituents could be important when considering the catalytic behaviour of the complexes. If the cis- form of the complex is the only isomer capable of catalysing a particular reaction, it would be necessary to synthesise an isomer which is as thermodynamically stable as possible whilst still being an effective catalyst.
After taking the d-orbital contributions into account, the trans- isomer has been found to be the most thermodynamically stable. This is most likely due to the bulky Phosphorus ligands being as far apart as they can be on an octahedral complex. To change this, and make the cis- isomer more stable, the groups attached to the Phosphorus ligand need to be altered in such a way as to create enough favourable interactions to form a more stable complex. The close proximity of the cis- groups means that the addition of stabilising Hydrogen bonds could allow this isomer to become the most thermodynamically stable. A Hydrogen bond is the attraction between a highly electronegative atom and a Hydrogen atom which is also attached to a highly electronegative atom.
Replacing all of the Chlorine groups with hydroxyl groups (-OH) is a simple way to create bonds of this type within the following complex: cis-Mo(CO)4(POH3)2. In this system, Hydrogen bonding could occur both ways between the Phosphorus ligands.
Mini Project:
Introduction
The aim of the Mini Project is to demonstrate the application of all the techniques learnt throughout Module 2. The following analysis will include geometry optimisations, frequency analysis, molecular orbital visualisation and charge distribution analysis. Computational chemistry has been shown to be a useful tool when interpreting the more unusual bonding and structures present within Inorganic molecules. It can be used to rationalise the way that atoms bond when simple VSEPR theory breaks down. Molecular orbital data can provide a more thorough bond description when this is the case.
A classic example of this problem is seen in the structure of diborane - B2H6 which is a highly toxic, colourless gas and is part of a homologous series of boranes with the following general structure: BnHn+4. In this molecule, a problem is encountered if the Boron atoms are assumed to have an sp3 hydridisation. This bonding system would require seven electron pairs, one more than there are present in the molecule (three electrons from each Boron atom, one electron from each Hydrogen atom). Therefore, a new bonding system needed to be devised. A structure with two fold symmetry was proposed and found to be consistent with the IR data[41]. This structure exhibits two bridging Hydrogens forming three centre - two electron bonds.
Examples of this type of structure have also been found with an Aluminium or a Gallium atom in place of the Boron and various other substituents in place of the Hydrogens (E.g. hydrocarbon groups, halides). Aluminium-halide and Gallium-halide structures can become particularly interesting when there are two different type of halogens present. All structures of this nature are highly Lewis acidic at the Boron (or Aluminium / Gallium) centres and can readily accept a lone pair of electrons. Reactions with a base will readily cleave the molecule in one of two manners, homolytically or heterolytically, depending on the nature of the base[42].
Specific Aims Of The Mini-Project:
1) Explore the bonding in diborane by constructing and analysing the molecular orbital diagram. This will give an insight into the properties of this unusual structure.
2) Explore the differences between the cis-, trans- and bridging- forms of Al2Cl4Br2 by inspection of the relative energies and charge distributions. This will allow the preferred structure to be determined and rationalised.
3) Compare the Aluminium and the Gallium analogues of the bridging- forms of M2Cl4Br2. This will display the electronic and steric effects of the heavier elements in Group 13.
Diborane
A molecule of diborane was drawn on GaussView and the geometry was optimised using the B3LYP method with a basis set of LANL2DZ. The fully optimised molecule can be viewed by following the link. This produced the following LOG FILE[43] and the summary is given below:
Diborane - Optimisation
File Name = DIBORANE_OPT
File Type = .fch
Calculation Type = FOPT
Calculation Method = RB3LYP
Basis Set = LANL2DZ
Charge = 0
Spin = Singlet
E(RB3LYP) = -53.26050420 a.u.
RMS Gradient Norm = 0.00002345 a.u.
Imaginary Freq = ---
Dipole Moment = 0.0000 Debye
Point Group = ---
Job cpu time:  0 days  0 hours  1 minutes 3.0 seconds.
The point group of diborane is D2h meaning that is has the following symmetry elements: C2 (x), C2 (y), C2 (z), σ (xy), σ (xz) and σ (yz). Analysis of the molecule on GaussView afforded the following chemical data:
| Diatomic Bond | Bond Length (Å) | Triatomic Bond | Bond Angle (°) |
|---|---|---|---|
| B-H (Bridging) | 1.34 | H-B-H (Bridging) | 95 |
| B-H (Terminal) | 1.19 | H-B-H (Terminal) | 123 |
The molecule can be used as the 'idealised geometry' for this type of structure so the bond angles can therefore be compared loosely with that collected for all the other structures.
Next, the molecular orbitals of the molecule were predicted using the same method as for BH3. This produced the following LOG FILE[44]. Ten of the orbitals were visualised (six occupied and four unoccupied) and compared with the corresponding orbitals which were predicted through a qualitative analysis. The energy summary for these orbitals (in Hartrees) is shown below:
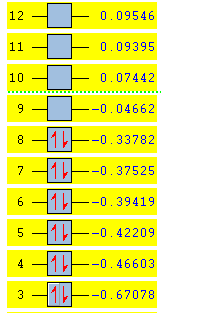
It can be seen that the HOMO is the orbital labelled 8 and the LUMO is the orbital labelled 9. This summary supports the notion that structures of this type are Lewis acidic. A lone pair of electrons can readily be donated into the empty bonding orbital (the LUMO) at -0.04662 Ha. The antibonding nature of the LUMO is low and is technically non-bonding with respect to the H2 fragment (detailed below). Therefore, if two electrons were added, it would not destabilise the molecule[45].
A molecular orbital diagram was created from first principles using the LCAO approach. The diagram for diborane can be built up from three simple fragments. First, the BH2 unit was taken as a fragment and the four lowest orbitals were based on those associated with a molecule of H2O. The four orbitals lowest in energy were chosen by following the convention that only the orbitals up to the LUMO+1 are considered. Two of these BH2 fragments can now be combined to form a B2H4 unit. Each of the four combinations produces a pair fragment orbitals. In each pair, the orbital which is relatively lower in energy arises from the 'positive-positive' combination of the two BH2 units. The orbital which is relatively higher in energy arises from the 'positive-negative' combination of the two BH2 units. Finally, these eight B2H4 fragments can be combined with the two H2 orbitals of appropriate symmetry to produce the overall molecular diagram below. The electrons were added to the molecular orbitals (twelve in total) for facile determination of the HOMO and LUMO levels.
The MO diagram was produced on ChemDraw Pro 12.0 and the predicted molecular orbitals have been placed next to the corresponding orbitals which were found through the LCAO method:
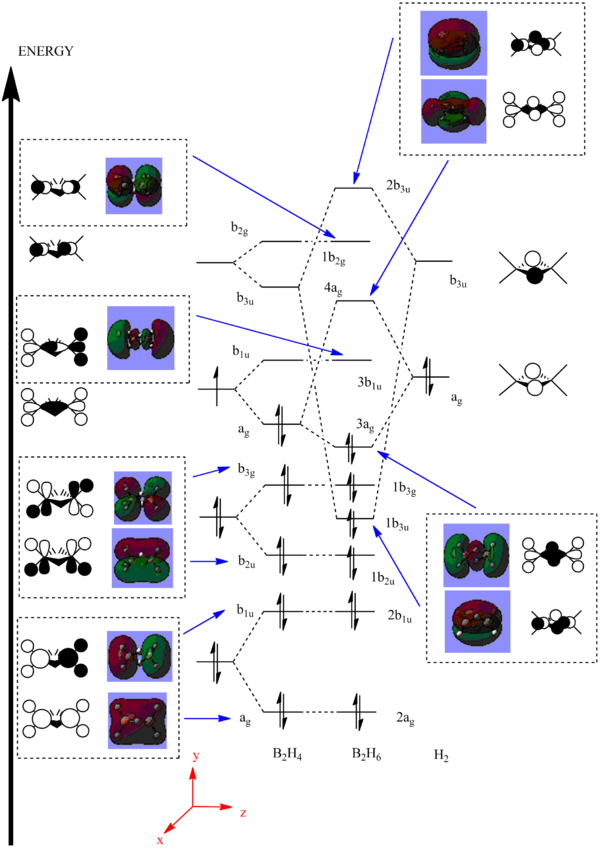
The computationally predicted molecular orbitals show a very reasonable likeness to the ones found qualitatively. There aren't many differences between the pairs of diagrams suggesting that computational analysis for this purpose is also accurate for slightly more complex molecules such as diborane. In total, there are six non-bonding orbitals present in the diagram (2ag, 2b1u, 1b2u, 1b3g, 3b1u and 1b2g). At the higher energies, the orbitals display greater antibonding character than those at lower energies. It is also evident that the 1b3u orbital is the main contributor to the the three centre - two electrons bonds found in the molecule.
Aluminium Compunds Of The Form Al2X4X'2
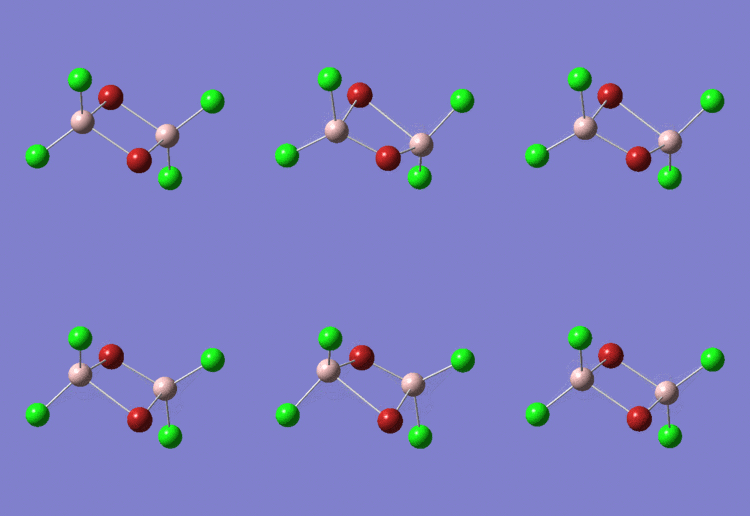
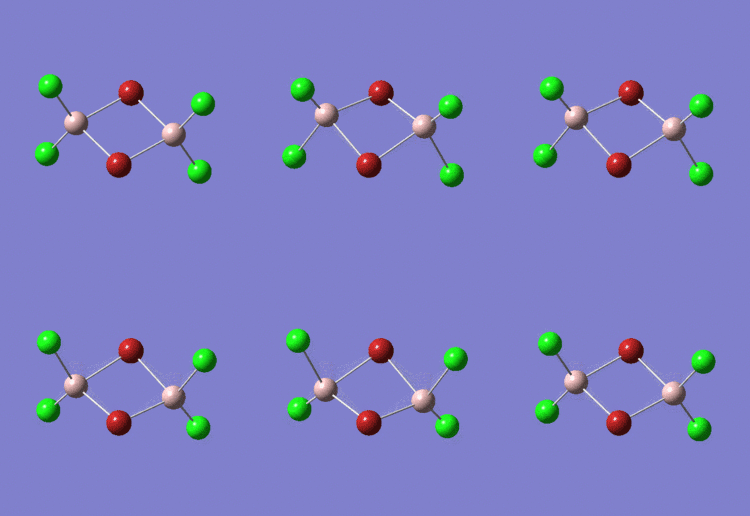
This section will detail the analysis of three Aluminium-halide structures of the form Al2X4X'2 where X = Cl and X' = Br. The three configuration are cis-, trans- and bridging and can be viewed in 3D by following the relevant links. The bright green atoms are Chlorines, the grey atoms are Borons and the brown atoms are Bromines. The structures are also shown below for facile differentiation:

Each structure can be analysed to determine and rationalise the preferred geometry. The implication of altering the position of the Bromine atoms can be observed by examining the predicted data. The core differences between the two halides can be found through the analysis of the molecular orbital diagrams and the charge distributions.
Each of the structures were drawn on GaussView and their geometries were optimised using B3LYP method with a LANL2DZ basis set. The three LOG FILES (cis-[46], trans-[47] and bridging-[48]) have been provided. Each of the summaries are shown below:
Proper Optimisation - Cis Bromines Al
File Name = CIS_BROMINES_AL_PROPER
File Type = .fch
Calculation Type = FOPT
Calculation Method = RB3LYP
Basis Set = LANL2DZ
Charge = 0
Spin = Singlet
E(RB3LYP) = -90.47300155 a.u.
RMS Gradient Norm = 0.00004594 a.u.
Imaginary Freq = ---
Dipole Moment = 0.8814 Debye
Point Group = ---
Job cpu time:  0 days  0 hours  0 minutes 43.0 seconds.
Proper Optimisation - Trans Bromines Al
File Name = TRANS_BROMINES_AL_PROPER
File Type = .fch
Calculation Type = FOPT
Calculation Method = RB3LYP
Basis Set = LANL2DZ
Charge = 0
Spin = Singlet
E(RB3LYP) = -90.47287346 a.u.
RMS Gradient Norm = 0.00006171 a.u.
Imaginary Freq = ---
Dipole Moment = 0.0000 Debye
Point Group = ---
Job cpu time:  0 days  0 hours  0 minutes 49.0 seconds.
Proper Optimisation - Al Bridging Bromines
File Name = BRIDGING_BROMINES_AL_OPT_PROPER
File Type = .fch
Calculation Type = FOPT
Calculation Method = RB3LYP
Basis Set = LANL2DZ
Charge = 0
Spin = Singlet
E(RB3LYP) = -90.46236302 a.u.
RMS Gradient Norm = 0.00000448 a.u.
Imaginary Freq = ---
Dipole Moment = 0.0000 Debye
Point Group = ---
Job cpu time:  0 days  0 hours  0 minutes 54.0 seconds.
From this data, it is possible to see that the cis- isomer is the most stable and the bridging- isomer is the least thermodynamically stable. The bridging- configuration is the least thermodynamically stable because the two Bromine atoms are forced into a particular geometry. The Bromine atoms are larger than the Chlorine atoms meaning that when the Bromines are in the bridging position, there is a greater steric clash. These unfavourable interactions create a geometry with a higher total energy. The cis- molecule is 0.336 kJ mol-1 lower in energy than the trans- molecule. The trans- molecule is 27.56 kJ mol-1 lower in energy than the bridging- molecule. The energy gaps support the theory above.
The high thermodynamic stability of the cis- molecule can be rationalised by further analysing the deeper bonding orbitals of the molecule. These molecular orbitals were visualised on GaussView. The LOG FILES have been provided below in the charge distribution paragraph. The molecular orbitals below all display strong bonding character between the two cis- atoms. The bonding character is particularly great because identical atoms are perfectly matched in terms of orbital size.
| Molecular Orbital Number | Image Of Molecular Orbital |
|---|---|
| 3 | 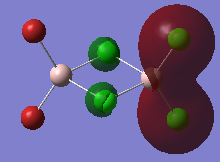 |
| 5 | 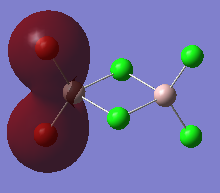 |
| 17 |  |
| 18 |  |
| 21 | 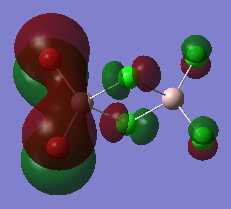 |
| 22 | 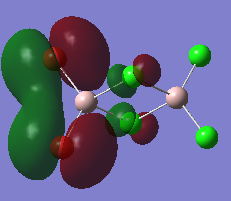 |
This reflects the high stability of this molecule because these favourable interactions are lost in the trans- and bridging- forms. The Bromine valence orbitals are more diffuse than the Chlorine valence orbitals. Being further away from the nucleus means that the electrons are higher in energy. This explains why the Chlorine-Chlorine bonding interactions are at a lower energy than the corresponding Bromine-Bromine ones.
The dipole moment of the trans- and bridging- is zero because of the higher symmetry of these molecules. The cis- molecule has a permanent dipole moment because of the difference in electronegativity between the Bromine and the Chlorine atoms. Chlorine has an electronegativity of 3.16 and Bromine has an electronegativity of 2.96[49]. This difference means that the electronic distribution isn't uniform. The RMG gradient norm is very close to zero and suggests that a minimum energy has been found. This notion can be supported by the frequency analysis. If there aren't any negative vibrational modes then a global minimum has indeed been found.
The optimised molecules were also subjected to bond length and bond angle analysis. The following values were collected:
| Diatomic Bond | Bond Length (Å) | Triatomic Bond | Bond Angle (°) |
|---|---|---|---|
| Al-Cl (Bridging) | 2.44 | Cl-Al-Cl (Bridging) | 85 |
| Al-Cl (Terminal) | 2.18 | Cl-Al-Cl (Terminal) | 123 |
| Al-Br (Terminal) | 2.34 | Br-Al-Br (Terminal) | 125 |
| Diatomic Bond | Bond Length (Å) | Triatomic Bond | Bond Angle (°) |
|---|---|---|---|
| Al-Br (Terminal) | 2.33 | Cl-Al-Br (Terminal) | 124 |
| Al-Cl (Bridging) | 2.42 | Cl-Al-Cl (Bridging) | 85 |
| Al-Cl (Terminal) | 2.18 | --- | --- |
| Diatomic Bond | Bond Length (Å) | Triatomic Bond | Bond Angle (°) |
|---|---|---|---|
| Al-Br (Bridging) | 2.59 | Br-Al-Br (Bridging) | 89 |
| Al-Cl (Terminal) | 2.18 | Cl-Al-Cl (Terminal) | 123 |
Literature data was found for a molecules of the form Al2X6[50]. The bond distance for an Al-Cl bond is 2.06Å (TERMINAL) and 2.21Å (BRIDGING). The bond distance for an Al-Br bond is 2.21Å (TERMINAL) and 2.33Å (BRIDGING). These values are fairly close to the predicted values found from the geometry optimisation. However, there are a few slight differences because the molecules considered contain two different types of halogen.
The data above reveals some interesting information about the molecules. The bridging bond lengths are larger than the bond lengths associated with the terminal bond lengths. This reflects the relatively unstable nature of the three centre - two electron bonds. It is also possible to see that the angles are increased for both the terminal and bridging Br-Al-Br bonds compared to the same bonds containing Chlorine. This can be attributed to the greater atomic radii associated with Bromine. Aluminium-Chlorine bonds are generally shorter than Aluminium-Bromine bonds because there is far greater orbital overlap. Aluminium and Chlorine are both found in the same period of the periodic table and thus have a better orbital match in terms of size. Better overlap means a shorter, and hence stronger, bond.
Each molecule was then submitted for a full frequency analysis. The three LOG FILES (cis-[51], trans-[52] and bridging-[53]) have been provided. Only three important vibrational modes have been fully tabulated because these are the modes which relate directly to the Aluminium centres. The three types of modes are the displacements of the Aluminium atoms in each of the three axial directions. Animations have been provided below to better display the three modes:
The relative energies of the three vibrational modes can be rationalised by considering the strength of the bonds involved in each of the displacements. From the previous data, we know that Al-Br bonds are weaker than Al-Cl bonds. Vibrational mode 1 involves the stretching of all the Al-Br bonds with the Al-Cl bonds remaining static. Vibrational mode 2 involves the stretching of all the Al-Cl and Al-Br bonds. Vibrational mode 3 involves the stretching of all the Al-Cl bonds with the Al-Br bonds remaining static. The relative energy of the modes is 1 < 2 < 3 because the higher energy vibrations incorporate a higher majority of the stronger Al-Cl bonds into their displacements.
The following tables display the peak frequency and the intensity of the peak for each of the three configurations associated with vibrational modes 1, 2 and 3:
| Vibrational Mode | Frequency Of The Vibrational Mode (cm-1) | Intensity Of The Vibrational Mode |
|---|---|---|
| 1 | 348 | 136 |
| 2 (Aluminium Attached To The Bromines) | 382 | 307 |
| 2 (Aluminium Attached To The Chlorines) | 465 | 95 |
| 3 (Aluminium Attached To The Bromines) | 474 | 110 |
| 3 (Aluminium Attached To The Chlorines) | 575 | 132 |
| Vibrational Mode | Frequency Of The Vibrational Mode (cm-1) | Intensity Of The Vibrational Mode |
|---|---|---|
| 1 | 347 | 135 |
| 2 | 389 | 439 |
| 3 | 543 | 236 |
| Vibrational Mode | Frequency Of The Vibrational Mode (cm-1) | Intensity Of The Vibrational Mode |
|---|---|---|
| 1 | 304 | 163 |
| 2 | 424 | 305 |
| 3 | 572 | 212 |
The relative energy ordering of the vibrational modes is consistent with the theory described above (1 < 2 < 3). The cis- form displays the most interesting data which is relevant to our investigation. This configuration displays the non degenerate versions of vibrational modes 2 and 3. The modes are no longer degenerate because this molecule exhibits one Aluminium solely attached to Chlorine atoms and the other Aluminium attached to two Bromine atoms and two Chlorine atoms. In each case, the stretching frequencies are found at a lower wavenumber when there are more Al-Br bonds involved in the vibrational mode. As before, if weaker bonds are involved, the vibrational mode will appear as a peak at a lower wavenumber. Each of the three vibrational modes have a definite intensity (much greater than zero) because each of them involve a change in dipole moment within the molecule. The absence of negative frequencies means than a global minimum has been found.
The molecular orbitals of the three configurations were then modelled. The three LOG FILES (cis-[54], trans-[55] and bridging-[56]) have been provided. The LUMO for each was captured as an image and is shown below. The LUMO has been chosen to be analysed because this orbital displays the most relevant information and allows for an easy comparison of the three molecules:
| Molecular Configuration | The LUMO | Energy Of The LUMO (Hartrees) |
|---|---|---|
| cis- |  |
-0.12147 |
| trans- | 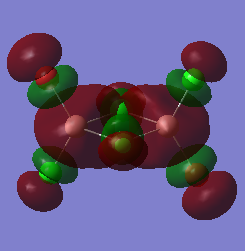 |
-0.12031 |
| bridging- | 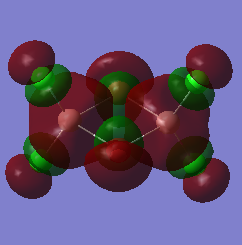 |
-0.12496 |
The high symmetry of the molecular orbitals also support that a global minimum was found through optimising the geometries of the molecules. There are a few main differences to note. It can be seen that the electronic orbitals associated with the Bromine atoms are much more diffuse than those associated with the Chlorine atoms. Chlorine is more electronegative, meaning that the electrons are held closer to the nucleus. The interactions between the Aluminium and the Chlorine atoms can be seen in the cis- and trans- LUMO's. This supports the suggestion that there is excellent orbital overlap between the two elements because they are found in the same period of the periodic table. The same orbital overlap is NOT seen in the same position within the bridging- molecule because of the mismatched size of the orbitals. The relative energies of the molecular orbitals are based on the amount of favourable and unfavourable interactions between the orbitals. The LUMO has a relatively higher amount of antibonding character than the orbitals which are relatively lower in energy.
Each of the LUMO's display a negative energy which means that electrons can be added to this orbital without destabilising the molecule. It is therefore assumed that the cis-, trans- and bridging- forms of [Al2Cl4Br2]2- will exist.
The same LOG FILE produced by the molecular orbital analysis also provides details of the charge distribution within the molecules. GaussView was employed to display the charge distribution numerically:
| Molecular Configuration | Charge Distribution |
|---|---|
| cis- | 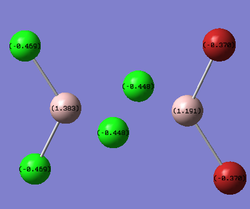 |
| trans- | 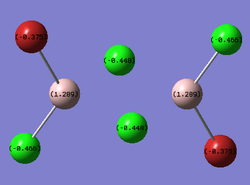 |
| bridging- | 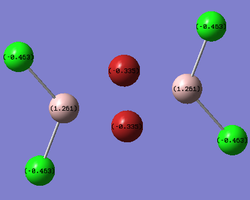 |
In all three cases, the Chlorine atoms have a more negative charge density than the Bromine atoms. This reflects the relative electronegativities of the two atoms. The trans- and bridging- molecules all display a very symmetric charge density distribution. The cis- molecule displays an asymmetrical charge distribution with respect to the Aluminium atoms in particular. The Aluminium attached to all the Chlorine atoms has a more positive charge density than the Aluminium attached to the Bromine atoms. The Aluminium attached to all four Chlorines is deshielded to a greater degree than the other Aluminium. Finally, the bridging halides exhibit a less negative charge distribution than their terminal counterparts. This reveals the electronically deficient nature of three entre - two electron bonds.
Gallium Analogue
The same analysis was then carried out on the Gallium analogue of the bridging- molecule. This analysis will show the effects of heavier atom substitution on the energy of a system as well as on the vibrational modes and charge distribution. The fully optimised molecule can be viewed in 3D by following the link.
The molecule was drawn on GaussView and optimised in the same fashion as the Aluminium analogue. The LOG FILE[57] is available in the references section and the summary of the optimisation is shown below:
Proper Optimisation - Ga Bridging Bromines
File Name = GALLIUM_BRIDGING_PROPER_OPT
File Type = .fch
Calculation Type = FOPT
Calculation Method = RB3LYP
Basis Set = LANL2DZ
Charge = 0
Spin = Singlet
E(RB3LYP) = -90.56030298 a.u.
RMS Gradient Norm = 0.00001882 a.u.
Imaginary Freq = ---
Dipole Moment = 0.0000 Debye
Point Group = ---
Job cpu time:  0 days  0 hours  1 minutes 3.0 seconds.
A low RMS gradient norm has been acquired which proposes that a minimum energy configuration has been found. This will be supported by the frequency analysis carried out later. The dipole moment is zero because of the highly symmetric character of the molecule.
Analysis of the molecule on GaussView afforded the following chemical data regarding the bond angles and bond lengths:
| Diatomic Bond | Bond Length (Å) | Triatomic Bond | Bond Angle (°) |
|---|---|---|---|
| Ga-Br (Bridging) | 2.59 | Br-Ga-Br (Bridging) | 90 |
| Ga-Cl (Terminal) | 2.18 | Cl-Ga-Cl (Terminal) | 123 |
The data collected is almost completely identical to that collected from the Aluminium analogue. The only difference can be seen in the bridging Br-Ga-Br bond angle. A larger bond angle is present because of the greater steric demand of the molecule. With Gallium being found in a period 4 and Aluminium in period 3, the larger atomic radii for Gallium forces the angle to be more obtuse to reduce unfavourable steric repulsions.
If more time was available, the input file could have been modified (as with the isomers section) to account for d-orbital interactions when the geometry was optimised. These d-orbitals interactions become important when considering heavier elements such as Gallium and Bromine. It is predicted that the Ga-Br bond length would in fact be shorter than the Al-Br bond length because there is better orbital overlap between the two atoms.
The following table displays the peak frequency and the intensity of the peak for the Gallium analogue associated with vibrational modes 1, 2 and 3. The IR spectrum is also available below. The relevant LOG FILE[58] has been given:
| Vibrational Mode | Frequency Of The Vibrational Mode (cm-1) | Intensity Of The Vibrational Mode |
|---|---|---|
| 1 | 217 | 72 |
| 2 | 356 | 105 |
| 3 | 430 | 109 |
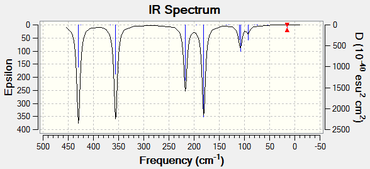
The frequency analysis shows that each of the vibrational modes are weaker for the Gallium analogue. The vibrational modes are weaker because the reduced mass of the two atoms is greater than that for the Aluminium analogue.
The LUMO for was also captured as an image and is shown below. This analysis produced the LOG FILE[59]:
| Molecular Configuration | The LUMO | Energy Of The LUMO (Hartrees) |
|---|---|---|
| bridging- | 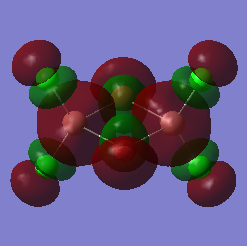 |
- 0.13729 |
The LUMO actually looks very similar to LUMO of the Aluminium analogue. As before, the Bromine orbitals are much more diffuse that the Chlorine orbitals because of the differences in electronegativity. The same effect can be seen with Gallium. Aluminium has an electronegativity of 1.61 and Gallium has an electronegativity of 1.81[60]. Gallium is found to have a higher electronegativity than Aluminium because of the d block contraction resulting from a completely filled d-orbital. Because of this, the electrons will be held tighter to the Gallium nucleus. This can be seen by the fact that the orbitals around the Gallium atoms are slightly less diffuse than the corresponding orbitals around the Aluminium atoms. Additionally, the increased orbital overlap between the Gallium atoms and the Bromine atoms can be seen in the LUMO. Gallium and Bromine are both situated in the same period of the periodic table. This results is an excellent orbital overlap because of the similar orbital sizes. In the bridging- Gallium LUMO, a closer interaction is found between the Gallium and Bromine orbitals than there is between the mismatched Aluminium and Bromine orbitals.
The same LOG FILE produced by the molecular orbital analysis also provides details of the charge distribution within the molecule. GaussView was employed to display the charge distribution numerically:
| Molecular Configuration | Charge Distribution |
|---|---|
| bridging- | 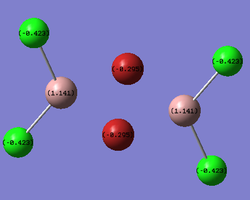 |
The charge distribution value associated with each of the atoms in the molecule are slightly lower than the values found in the Aluminium analogue. This suggests than the dipole moment relating to each of the individual bonds is less extreme in the Gallium molecule. The charge distribution is still highly symmetric and the Chlorine atoms have a more negative charge distribution than the Bromine atoms. This can be attributed to the fact that Chlorine is more electronegative as well as the fact that the Bromines are found in the electron deficient bridging positions.
Conclusion Of The Mini Project
This mini project has been successful in the sense that it has been able to rationalise some key differences between the core attributes associated with Chlorine, Bromine, Aluminium and Gallium.
The energy optimisations have shown that the unusual structure exhibited by diborane is also available to molecules containing heavier group 13 elements and halogens.
Examination of the bond angles and bond lengths have provided information about the main differences between the two halogens used in the investigation. The difference in size was highlighted by the fact that a larger bond angle is needed to reduce the steric clashes between the two atoms. Additionally, the difference in size was also shown by the fact that there was less orbital overlap between atoms found in a different period of the periodic table. This is manifested in the bond lengths with Al-Cl always forming a shorter bond than Al-Br regardless of position.
The molecular orbital analysis has provided some information which can be used alongside the steric arguments. This analysis showed that the cis- form of the molecule allowed some very favourable bonding interactions to take place between the halogens of the same type.
The charge distribution analysis has highlighted the difference between the electronegativities of the two halogens. The Chlorine atoms were found to have a much more negative charge distribution than the Bromines regardless of the positions they were found in. This analysis also confirmed that three centre - two electron bonds are highly electron deficient molecular structures.
Substitution of the Aluminum atom with Gallium has shown that the heavier elements of group 13 can also form structures of this type.
If more time was available, it would have been interesting to carry out more analysis regarding structures with heavier halogens and heavier group 13 elements to see whether they are also able to accommodate this structure. With these heavier elements, it would have been important to think about using different basis sets which account for pseudo potential as well as the effects of d-orbitals.
Conclusion
Overall, computational chemistry has been shown to be a very useful tool in the analysis of Inorganic molecules. Physical data associated with a wide variety of molecules was collected and was found to be consistent with the literature. This module has shown that computational techniques can be used to accurately determine the stability of isomers, the important vibrational modes within a molecule and also the effects of heavy element substitution. Computational chemistry is a powerful tool to employ alongside synthetic techniques to allow the chemist to thoroughly analyse a given molecule or reaction.
Geometry optimisations have allowed for the stability of various configurations to be assessed. This information is important when considering a theoretical reaction pathway because not all products will be stable.
Molecular orbital analysis allowed a detailed description about the different bonds within a molecule to be obtained. This information can be used to rationalise why certain molecules react in certain ways by analysing whether there are available electrons for donation or acceptance.
Charge distribution analysis has allowed a more quantitative description of electronegativity to be observed. Additionally, the supplementary NBO analysis has provided a quantitative description of hybridised bonds by detailing which orbitals and atoms are responsible for a particular diatomic bond.
As time goes by, more and more information is being collected and applied to making computational techniques more effective. This module alone has shown that by modifying the interactions taken into account (E.g. d-orbital interactions), it is possible to obtain a much more thorough analysis and a greater accuracy of the predicted results.
References
- ↑ J. Nørskov et al., Chemistry World, 05 June 2008
- ↑ http://hdl.handle.net/10042/to-10557
- ↑ M. S. Schuurman et al., J. Comp. Chem., 26(11), 2005, pp 1106
- ↑ W.H.Brown et al., Organic Chemistry, Sixth Edition, 2010, pp 237
- ↑ http://hdl.handle.net/10042/to-10558
- ↑ B. Khater et al., J. Chem. Phys., 129(22), 2008
- ↑ https://wiki.ch.ic.ac.uk/wiki/index.php?title=Mod:SAMROWE001
- ↑ B. Khater et al., J. Chem. Phys., 129(22), 2008
- ↑ 3rd Year Computational Chemistry Online Lab Manual, Module 1, 2011
- ↑ http://hdl.handle.net/10042/to-10558
- ↑ J. Mullay, J. Am. Chem. Soc., 106, 1984, pp 5842 - 5847
- ↑ P. Hunt, 2nd Year Inorganic Chemistry Course - Molecular Orbitals In Inorganic Chemistry, 2010, Lecture 4
- ↑ http://hdl.handle.net/10042/to-10558
- ↑ 3rd Year Computational Chemistry Online Lab Manual, Module 2, 2011
- ↑ http://hdl.handle.net/10042/to-10560
- ↑ J. Blixt et al., J. Am. Chem. Soc., 117, 1995, pp 5089 - 5104
- ↑ M. Anatosov et al., J. Phys. Chem., 105, 2001, pp 5450 - 5467
- ↑ http://hdl.handle.net/10042/to-10560
- ↑ J. E. D. Davies et al., J. Chem. Soc. (A), 1968, pp 2050 - 2054
- ↑ J. E. D. Davies et al., J. Chem. Soc. (A), 1968, pp 2050 - 2054
- ↑ http://hdl.handle.net/10042/to-10560
- ↑ http://hdl.handle.net/10042/to-10565
- ↑ http://hdl.handle.net/10042/to-10563
- ↑ http://hdl.handle.net/10042/to-10569
- ↑ http://hdl.handle.net/10042/to-10567
- ↑ F. A. Cotton, Inorg. Chem., 21, 1982, pp 294 - 299
- ↑ D. W. Bennett, J. Chem. Cryst., 34(6), 2004, pp 353 - 359
- ↑ http://hdl.handle.net/10042/to-10575
- ↑ http://hdl.handle.net/10042/to-10573
- ↑ F. A. Cotton, Inorg. Chem., 21, 1982, pp 294 - 299
- ↑ D. W. Bennett, J. Chem. Cryst., 34(6), 2004, pp 353 - 359
- ↑ http://hdl.handle.net/10042/to-10572
- ↑ http://hdl.handle.net/10042/to-10570
- ↑ M. Ardon et al., J. Chem. Educ., 79(10), 2002, pp 1249 - 1251
- ↑ M. Ardon et al., J. Chem. Educ., 79(10), 2002, pp 1249 - 1251
- ↑ http://hdl.handle.net/10042/to-10578
- ↑ http://hdl.handle.net/10042/to-10576
- ↑ 3rd Year Computational Chemistry Online Lab Manual, Module 2, 2011
- ↑ A. D. Allen et al., Can. J. Chem., 46, 1968 pp 1649 – 1653
- ↑ N. M. Xiang, et. al, Universiti Teknologi Malaysia, Identification of Stereochemical Isomers by Infrared Spectroscopy, 2010, pp 15
- ↑ P.Lickiss, 2nd Year Inorganic Chemistry Course, I2 - Main Group Chemistry, 2011, Lectures 5 and 6
- ↑ P.Lickiss, 2nd Year Inorganic Chemistry Course, I2 - Main Group Chemistry, 2011, Lectures 5 and 6
- ↑ http://hdl.handle.net/10042/to-10674
- ↑ http://hdl.handle.net/10042/to-10676
- ↑ P. Hunt, 2nd Year Inorganic Chemistry Course - Molecular Orbitals In Inorganic Chemistry, 2010, Lecture 5
- ↑ http://hdl.handle.net/10042/to-10665
- ↑ http://hdl.handle.net/10042/to-10668
- ↑ http://hdl.handle.net/10042/to-10662
- ↑ P. Atkins, Inorganic Chemistry 4th Ed., 2006, p. 31
- ↑ K. Wade, J. Chem. Educ., 49(7), 1972, pp 502
- ↑ http://hdl.handle.net/10042/to-10666
- ↑ http://hdl.handle.net/10042/to-10669
- ↑ http://hdl.handle.net/10042/to-10663
- ↑ http://hdl.handle.net/10042/to-10667
- ↑ http://hdl.handle.net/10042/to-10670
- ↑ http://hdl.handle.net/10042/to-10664
- ↑ http://hdl.handle.net/10042/to-10671
- ↑ http://hdl.handle.net/10042/to-10672
- ↑ http://hdl.handle.net/10042/to-10673
- ↑ P. Atkins, Inorganic Chemistry 4th Ed., 2006, p. 31

