Rep:Mod:SAMROWE001
3rd Year Computational Chemistry - Sam Rowe
Module 1 - Structure and Spectroscopy
Part 1.1: The Hydrogenation of the Cyclopentadiene Dimer
At room temperature, two cyclopentadiene rings forms a dimer via a Diels-Alder reaction. This reaction can proceed in one of two ways; one producing the exo- Form of the product and one producing the endo- Form of the product. Both of the structures can be viewed in detail by following the relevant links provided. The predominant form of the dimer is dictated by the relative energies of the two systems and also whether the dimerisation reaction is subjected to kinetic or thermodynamic control. Figure 1 shows the mechanisms which give rise to both of the different isomers:

Each dimer has been drawn on ChemBio3D and the energy of the system has been minimised by optimising their geometries with the MM2 force field option. This process takes into account the various interactions which occur on a given molecule. These interactions include diatomic bond stretches, triatomic bond bends, tetra-atomic bond torsions, van der Waals (VDW) repulsions and electrostatic attractions of individual bond dipoles. Summation of these separate variables gives a value for the 'Total Energy'. Negative numbers relate to a favourable interaction. The difference has also been taken between the two products to emphasise the interactions which are least similar. Since we are analysing the two isomers on the same program, we are able to directly compare them. The following table details the data produced from the energy minimisation:
| Type of Energy Interaction (kcal mol-1) | exo- Form of the Dimer (1) | endo- Form of the Dimer (2) | Difference |
|---|---|---|---|
| Stretch | 1.29 | 1.25 | 0.04 |
| Bend | 20.58 | 20.85 | - 0.27 |
| Stretch-Bend | - 0.84 | - 0.84 | 0.00 |
| Torsion | 7.66 | 9.51 | - 1.85 |
| Non-1,4 VDW | - 1.42 | - 1.54 | 0.12 |
| 1,4 VDW | 4.23 | 4.32 | - 0.09 |
| Dipole/Dipole | 0.38 | 0.45 | - 0.07 |
| Total Energy | 31.88 | 34.00 | - 2.12 |
It is possible to see that the exo- Form of the product has a lower total energy and is thus the more thermodynamically stable product. However, the literature[1] states that it is in fact the endo- Form of the product which predominates. This suggests that the Diels-Alder dimerisation falls under a kinetically controlled regime and therefore the kinetic product (the endo- Form) will be solely created. Favourable interactions in the transition state allow this product to be formed rapidly. The largest difference in energy is found between the two torsional interactions. This can be seen by the fact that on the endo- Form, the two Hydrogens found along the newly formed Carbon-Carbon bond are forced much closer together than on the exo- Form. This leads to unfavourable steric clashes which give the interaction, and indeed the entire molecule, a higher energy. In addition to this, the endo- form of the molecule forces the bridgehead Hydrogens much closer to the Hydrogens situated on the second cyclopentadiene ring (shown in bold below). The exo- form avoids this higher energy interaction because the Hydrogens on the second ring are on the opposite plane to the bridgehead.
Hydrogenation of the endo- product affords two different structures: Molecule 3 and Molecule 4. The static structures are shown below to clearly demonstrate where the hydrogenation has taken place:
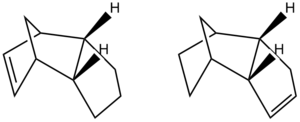
As before, the structures have been drawn on ChemBio3D and the geometries of the structures have been optimised to produce the most stable configuration in terms of energy. The following table displays the results:
| Type of Energy Interaction (kcal mol-1) | Molecule 3 | Molecule 4 | Difference |
|---|---|---|---|
| Stretch | 1.28 | 1.10 | 0.18 |
| Bend | 19.85 | 14.52 | 5.33 |
| Stretch-Bend | - 0.83 | - 0.55 | - 0.28 |
| Torsion | 10.81 | 12.50 | - 1.69 |
| Non-1,4 VDW | - 1.22 | - 1.07 | - 0.15 |
| 1,4 VDW | 5.63 | 4.51 | 1.12 |
| Dipole/Dipole | 0.16 | 0.14 | 0.02 |
| Total Energy | 35.69 | 31.15 | 4.54 |
From these results, it is evident that Molecule 4 is lower in overall energy and is thus the thermodynamic product. Molecule 3 is the hydrogenated product which is less thermodynamically stable. Molecule 4 exhibits a lower energy bending interaction and 1,4 VDW interaction than Molecule 3. These relatively more favourable interactions negate the fact that Molecule 4 has a higher energy torsion interaction. One of the high energy 1,4 VDW interactions on Molecule 3 are shown below:

On this molecule, the double bond forces a fixed geometry, meaning that the Hydrogen (on the left) is held tightly in position and interacts unfavourably with the adjacent Hydrogen (on the right). A similar unfavourable interaction will also be shown by the Hydrogens on the opposite side of the bridge head. Molecule 4 doesn't have a double bond in this position, meaning that the Hydrogens are free to rotate and relieve some steric strain. This gives the molecule a lower energy for the 1,4 VDW interaction. Overall, the close proximity of two very sterically demanding structures (the bridgehead Carbon arrangement and the alkene double bond) results in adverse interactions between all the adjacent atoms which have been forced together. The ideal geometric angle for an sp2 bond to adopt is 120°. In the Molecule 3, the calculated angle is in fact 107°. The ideal geometric angle for an sp3 bond to adopt is 109.5°. In Molecule 4, the calculated angle is in fact 102°. It is obvious that the angle for Molecule 4 is much closer to the ideal angle. Molecule 3 will therefore display a higher energy interaction. This accounts for the large difference in the bend interaction energy between Molecule 3 and Molecule 4. The bond angles are shown below:


This fixed geometry doesn't relate to a high energy interaction on Molecule 4 because the alkene Hydrogens are actually forced into a favourable site, well away from any adjacent atoms. The adjacent atoms in question are the Hydrogens with bold chemical bonds on Figure 2. They occur at this position because we are considering the hydrogenation of the Endo- product. A less sterically demanding molecule will exhibit a lower overall energy.
Part 1.2: Stereochemistry and Reactivity of an Intermediate in the Synthesis of Taxol
Taxol is an important drug in the treatment of ovarian cancers. It has a unique mechanism of action which was first bought to light in the 1970's. Taxol was developed and eventually approved by the FDA in 1993 for use in the U.S as an anti-cancer drug[2]. Two geometries of a key intermediate in the synthesis of this drug are shown below. The only difference between the two is the position of the carbonyl group with respect to the rest of the molecule. Molecule 9 has the carbonyl group pointing upwards, on the same plane as the adjacent cyclohexane Hydrogen. Molecule 10 has the carbonyl group pointing downwards, on the opposite plane to the adjacent cyclohexane Hydrogen. The molecules can be viewed in better detail by following the links provided. On standing, the compound appears to isomerise to the preferred form of the intermediate. This is an example of atropisomerism[3].

The two possible intermediates have been drawn on ChemBio3D and the geometries of the structures have been optimised to produce the most stable conformation in terms of energy. The following table displays the results:
| Type of Energy Interaction (kcal mol-1) | Molecule 9 | Molecule 10 | Difference |
|---|---|---|---|
| Stretch | 2.78 | 2.62 | 0.16 |
| Bend | 16.54 | 11.34 | 5.20 |
| Stretch-Bend | 0.43 | 0.34 | 0.09 |
| Torsion | 18.26 | 19.68 | - 1.42 |
| Non-1,4 VDW | - 1.56 | - 2.19 | 0.63 |
| 1,4 VDW | 13.11 | 12.87 | 1.12 |
| Dipole/Dipole | - 1.73 | - 2.00 | 0.27 |
| Total Energy | 47.84 | 42.68 | 5.16 |
In addition to the MM2 calculations, the MMFF94 total energy values were also calculated. These are tabulated below:
| Type of Energy Interaction (kcal mol-1) | Molecule 9 | Molecule 10 | Difference |
|---|---|---|---|
| Total Energy | 70.53 | 60.54 | 9.99 |
The MMFF94 (Merck Molecular Force Field) method is a more recent version of computational chemistry software. It is a method which has been derived from both computational data and by also parameterising the force field against a large number of crystallographically determined structures[4]. MMFF94 is specifically useful for analysing biological systems such as DNA, proteins and carbohydrates[5]. In terms of the structure of the molecule, there was very little variation between the structure produced from the MM2 method and the structure produced from the MMFF94 method. The only visible change was a slightly different orientation of the two methyl groups on the bridgehead Carbon. The two methods produce an almost identical structure because they both measure very similar parameters into consideration. It will be seen later that energy minimisation using the MOPAC/PM6 method will actually drastically change the structure of the molecule. This arises because MOPAC/PM6 (a semi-empirical method) takes into account orbital contributions to the final structure.
The minimum energy was determined by drawing the structure in ChemBio3D and allowing the program to perform an initial MM2 energy minimisation. From the produced structure, it was then possible to tweak the structure manually to ensure that the geometrical criteria of the intermediates were fulfilled (i.e the carbonyl group is correctly orientated with respect to the cyclohexane Hydrogens). After the original energy minimisation, the cyclohexane ring was found to be in the twist boat conformation. From the literature[6], it is know that this form of the molecule is 5 - 6 kcal mol-1 higher in energy than the chair form. By manually arranging the molecules into a 'perfect' chair conformation, this form will be adopted when the MM2 calculation is next carried out.
In both cases, the total energy is lower for Molecule 10 meaning that this will be the form of the intermediate in the synthesis of Taxol. The parameter with the greatest difference in energy is the Bend interaction. This relates to the fact that Molecule 9 (with the carbonyl group pointing upwards) exhibits greater steric crowding between the carbonyl group and the adjacent atoms.
It has been reported that the alkene group present in the intermediate reacts unusually slowly to further functionalisation. The fully saturated version of Molecule 10 (from hydrogenation at the alkene moiety) was found to have a total energy of 51.84 kcal mol-1 (MM2) or 69.53 kcal mol-1 (MMFF94). As with the previous calculations, there were very little structural differences between the MM2 and the MMFF94 optimisation. Note: the prior calculations were performed on the fully saturated version of Molecule 10, shown below:
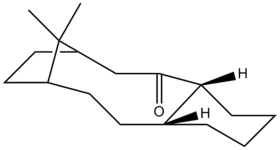
The table below displays the breakdown of the total energy found using the MM2 method on hydrogenated Molecule 10:
| Type of Energy Interaction (kcal mol-1) | Hydrogenated Molecule 10 |
|---|---|
| Stretch | 2.69 |
| Bend | 12.13 |
| Stretch-Bend | 0.59 |
| Torsion | 22.70 |
| Non-1,4 VDW | - 1.87 |
| 1,4 VDW | 15.60 |
| Dipole/Dipole | 0.00 |
| Total Energy | 51.84 |
The total energy is higher for the hydrogenated molecule compared to Molecule 10. This can be rationalised by the fact that an extra two Hydrogens have been added to the structure in place of the double bond. The extra Hydrogens will lead to additional interactions between neighbouring atoms. This is manifested in Table 5 by the fact that the 1,4 VDW energy, the bend energy and the torsion energy interactions are higher for the hydrogenated product. There is no longer a dipole/dipole interaction for the hydrogenated since the carbonyl group no longer has an alkene moiety to interact with.
Additionally, the hyperstability of bridgehead alkenes has been detailed in the literature[7]. If the number of Carbons in the bicyclic ring is low, the situation is especially unstable because the alkene is forced out of its preferable planar conformation. Alkenes found in these positions become especially stable as the size of the bicyclic rings are increased. This can be rationalised by considering that as the number of Carbons in the ring is increased to infinity, the alkene becomes more and more planar and hence stable. This stability accounts for the slow reactivity at the alkene located on the intermediate. This empirical observation is known as Bredt's Rule and is illustrated well in the literature[8] by the fact that elimination cannot occur at the hydroxyl position:

The cation is unable to form because of the steric strain invoked by the low number of Carbons present in the bicyclic ring.
Part 1.3: Regioselective Addition of Dichlorocarbene
The next two sections will explore modelling using semi-empirical methods. These differ from molecular mechanical methods by virtue of the fact that they take orbital contributions into consideration. The MOPAC/PM6 method is employed to calculate and display the molecular orbitals of the molecules. These calculations are also carried out on ChemBio3D and are performed in a matter of seconds.
Molecule 12 is shown below and can also be viewed in 3D. (Please note that the green-coloured atom is Chlorine):
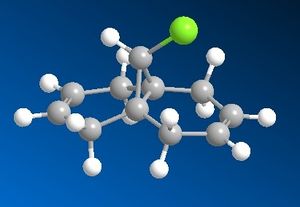
The aim of this part is to determine the position where the addition of dichlorocarbene will occur. The addition will happen in one of two places: either the alkene below (endo-) the Chlorine atom or the alkene away (exo-) from the Chlorine atom. By modelling the molecular orbitals of the molecule, it will be possible to predict where the addition will take place. First, the molecule was drawn using ChemBio3D and the geometry was optimised using MM2 calculations. From this, the following results were obtained:
| Type of Energy Interaction (kcal mol-1) | Molecule 12 |
|---|---|
| Stretch | 0.62 |
| Bend | 4.73 |
| Stretch-Bend | 0.04 |
| Torsion | 7.66 |
| Non-1,4 VDW | - 1.06 |
| 1,4 VDW | 5.79 |
| Dipole/Dipole | 0.11 |
| Total Energy | 17.89 |
After this, the MOPAC/PM6 method was run on Molecule 12 to provide an approximate representation of the molecular orbitals of the molecule. The following figures show some of the molecular orbitals which were produced using this method. The positive regions are shown in green and the negative regions are shown in yellow:

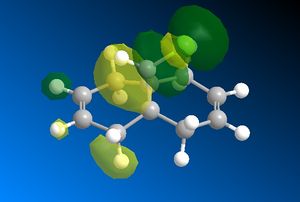


The molecular orbitals which have been modelled are consistent with the symmetry of the molecule. From the calculations performed, it is known that the point group of the molecule is Cs. Having this point group tells us that its only unique symmetry element is σh [9]. This plane of symmetry is shown below:

The molecular orbitals are consistent with this point group because they also display symmetry along this plane.
Both of the HOMO orbitals exhibit relatively more bonding characteristics than the LUMO's. The side on view clearly shows the large, favourable interactions between the complimentary orbitals. It is these interactions which give the orbitals their HOMO status as they will be found at a lower overall energy than the LUMO's. When looking at the LUMO orbitals, it is clear that there are more antibonding interactions between the adjacent orbitals. This gives the orbitals a higher overall energy.
In the sense of the addition, we will need to consider the HOMO diagram because this is presumed to be the most reactive towards electrophilic attack[10]. It can be seen in Figure 7, the HOMO, that the electron density is greatest around the alkene bond situated endo- to the Chlorine and it is therefore more prone to an addition reaction with dichlorocarbene than the other alkene. This notion is supported by the relevant literature[11], which states that a stabilising antiperiplanar interaction between the C-Cl σ* orbital and the occupied exo- π orbital makes the endo- double bond more nucleophilic.
The C-Cl σ* bond is readily available for interactions because of the high electronegativity of the Chlorine atom. A favourable alignment between the σ* and the π orbital allows for a donation of electron density into the antibonding orbital. This donation removes some electron density from the exo- alkene bond, thus making this bond less reactive towards dichlorocarbene.
Using the Gaussian interface, the IR spectrum has been predicted for both the Di-Alkene as well as the Mono-Alkene which has been hydrogenated at the exo- alkene bond. The SCAN system was used in predicting the spectra because this allows very complex calculations to be computed rapidly. The MM2 optimised geometry of the Mono-Alkene is shown below:
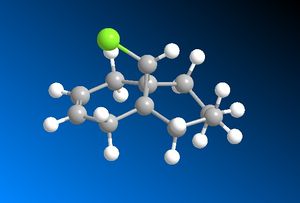
Prior to the IR spectrum being predicted by the Gaussian interface, both molecules were optimised using the MM2 method followed by the MOPAC/PM6 method. The relevant data for the Di-Alkene is shown above in Table 6. Table 7 displays the MM2 energy results of the Mono-Alkene:
| Type of Energy Interaction (kcal mol-1) | Mono-Alkene |
|---|---|
| Stretch | 0.90 |
| Bend | 4.69 |
| Stretch-Bend | 0.01 |
| Torsion | 10.76 |
| Non-1,4 VDW | - 1.07 |
| 1,4 VDW | 6.98 |
| Dipole/Dipole | 0.07 |
| Total Energy | 22.34 |
The torsional energy interaction has increased since there are an extra two Hydrogens in the system which can interact unfavourably with all the adjacent atoms. The MOPAC/PM6 method gave the following heats of formation: 19.74 kcal mol-1 (Di-Alkene) and -2.43 kcal mol-1 (Mono-Alkene). The following figure shows the predicted IR spectrum[12] of the Di-Alkene:

The C-Cl bond produces a peak at 770.9 cm-1 with a medium intensity. The very intense peak at 689.5 cm-1 is the out of plane C-H bend seen on the exo- and the endo- rings. The exo- double bond forms a stretch at 1737.1 cm-1 and the endo- double bond forms a stretch at 1757.4 cm-1. The exo- double bond produces a stretch at a lower wavenumber indicating that it is a weaker bond than the endo- double bond. This can be attributed to the orbital theory described earlier. Donation of electron density from the exo- π orbital into the correctly aligned C-Cl σ* orbital decreases a degree of stability from the bond. This delivers an overall weaker bond and a peak at a lower wavenumber on the IR spectrum.
The following figure shows the predicted IR spectrum[13] of the Mono-Alkene:
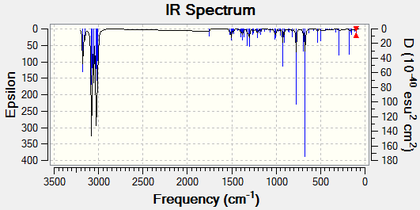
The C-Cl bond in this molecule produces a peak at 774.9 cm-1 with a medium intensity. Again, there is a very intense peak at 673.9 cm-1 for the out of plane C-H bend seen solely on the endo- ring. With there now being only one double bond in the molecule, there is only one peak in the alkene region. This is seen at 1758.1 cm-1 for the endo- double bond. The slight change in the C-Cl peak frequency can be rationalised as before. The Mono-Alkene displays a C-Cl peak at a higher wavenumber than the Di-Alkene does, meaning that the bond is stronger. The Mono-Alkene is unable to donate electron density into the C-Cl σ* orbital by virtue of the fact that there is no longer an alkene bond present. Donation into this antibonding orbital will destabilise the C-Cl bond (seen in the Di-Alkene).
The predicted peaks are consistent with the literature[14]: C-H out of plane bend (720 - 750 cm-1), C-Cl (700 - 800 cm-1) and C=C (1620 - 1680 cm-1).
Part 1.4: Monosaccharide Chemistry: Glycosidation
This part of the module explores the effect of neighbouring group participation on the glycosidation of a simple monosaccharide unit. The orientation of the neighbouring -OAc group dictates which of the two anomers are formed when the X group is substituted by the nucleophilic species. An intermediate step in the glycosidation reaction involves the acetyl group attaching to the six-membered ring. This means that the nucleophile is forced to attack from either the top face or the bottom face of the ring. The α-anomer and the β-anomer are shown in the reaction scheme below:
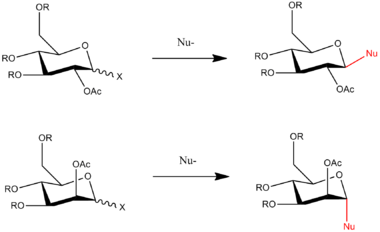
The reaction pathways are to be analysed by both MM2 and MOPAC/PM6 methods to rationalise the diasterospecificity of glycosidation. This part of the module will help to highlight the key differences between the two methods.
The MM2 method is important when initially optimising the geometry and only when the molecule is fully optimised can the MOPAC/PM6 method be employed. The MOPAC/PM6 method will be especially helpful in this part of the module because it takes into account the more complex orbital interactions which can greatly alter the appearance of a molecule compared with a MM2 optimisation. The MOPAC/PM6 method is able to calculate very accurate geometries and heats of formation of a great range of molecules including main group elements and transition metals. It also takes into account the effect of Hydrogen bonding on the structure. Most importantly though, MOPAC/PM6 will view a chemical bond as two electrons in an orbital rather than as a rigid motif. These complex interactions are important to consider because we are analysing a fairly complex molecule in the sense that there are a number of heteroatoms attached to the ring.
For the following computational analysis, a methyl group has been selected to represent the R group. Selecting such a simple alkane group will greatly reduce the time taken for the calculations to be completed by ChemBio3D. Additionally, this choice of group means that the energy minimisations are less likely to produce a structure which is only a local minimum, rather than a global minimum. First, the two oxonium cation rings were drawn on ChemBio3D. The oxonium cations are produced by a lone pair of electrons pushing into the ring and forcing the X group to leave. One form (A) has the acetyl group in the equatorial position and the other form (B) has the acetyl group in the axial. These are both shown below:

The next stage of the reaction involves a lone pair on the carbonyl Oxygen attacking the δ+ Carbon adjacent to the Oxygen on the ring. This mode of attack can occur from either the top or the bottom face of the ring. The following figure displays how the carbonyl lone pair can attack:

Therefore, oxonium cation ring A displays two different conformations with the acetyl group found in the equatorial position. These have been labelled ring A (where the carbonyl Oxygen is located above the ring) and ring A' (where the carbonyl Oxygen is located below the ring). Following from this, oxonium cation ring B also displays two different conformations: ring B (where the carbonyl Oxygen is located above the ring) and ring B' (where the carbonyl Oxygen is located below the ring). The previous links display the structure of each of the four rings after the MM2 energy minimisation was carried out.
The MM2 energy minimisation calculations on each of the four conformations yielded the following results:
| Type of Energy Interaction (kcal mol-1) | Ring A | Ring A' | Difference | Ring B | Ring B' | Difference |
|---|---|---|---|---|---|---|
| Total Energy | 33.83 | 32.95 | 0.88 | 32.05 | 35.35 | 3.30 |
The conformation with the lowest energy relates directly to the most preferable mode of attack. The MM2 data suggests that ring A' and ring B are the lowest energy conformations. MOPAC/PM6 calculations were then carried out on the optimised geometries of the four rings. This gave the following data:
| Type of Energy Interaction (kcal mol-1) | Ring A | Ring A' | Difference | Ring B | Ring B' | Difference |
|---|---|---|---|---|---|---|
| Energy of Formation | - 77.42 | - 86.77 | 9.35 | - 90.51 | - 89.83 | 0.68 |
In the case of the MOPAC/PM6 method, the energy of formation of the molecule has been calculated. A more negative energy corresponds to a more favourable conformation. Since the MOPAC/PM6 method measures different parameters when optimising the structure, an alternate geometry will actually be produced from this method. The following links provide the MOPAC/PM6 optimised structures for each of the four rings: ring A, ring A', ring B and ring B'. There is one major difference between the structures produced by the two different methods. From the MOPAC/PM6 method, the carbonyl Oxygen is situated much closer to the δ+ Carbon atom. The values in table 9 support the previous notion that ring A' and ring B are the more stable forms.
The four diagrams which follow display the distance between the carbonyl Oxygen and the δ+ Carbon atom after the MOPAC/PM6 optimisation has been performed. These will be discussed later on by comparing them to to the same bond distances within the four intermediate rings:
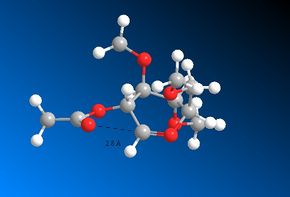

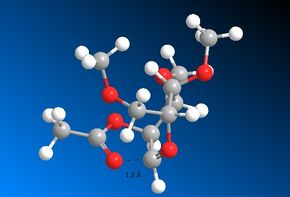

It is interesting to note that the diagrams with the very small distances (Figures 22, 23 and 24) also exhibit a correct angle of attack of the carbonyl Oxygen towards the δ+ Carbon atom. This is known as the Bürgi-Dunitz trajectory and states that an angle of 109° maximises the orbital overlap [15].
The observations so far can be supported further by modelling the two molecules after the Oxygen lone pair has attacked the δ+ Carbon atom. The acetyl bridge is found in the equatorial position for intermediate C and in the axial position for intermediate D. These are shown below:

These two molecules also have their C' and D' analogues (as with A and B) which are formed from the two different modes of attack: above the ring or below the ring. Each of the MM2 optimised molecules can be viewed as 3D images using the following links: ring C, ring C', ring D and ring D'. The following table displays the total energy for each system:
| Type of Energy Interaction (kcal mol-1) | Ring C | Ring C' | Difference | Ring D | Ring D' | Difference |
|---|---|---|---|---|---|---|
| Total Energy | 44.74 | 42.47 | 2.27 | 36.90 | 51.68 | 14.78 |
Each of the four intermediates also had their geometries optimised using the MOPAC/PM6 method. The following 3D structures were obtained: ring C, ring C', ring D and ring D' and the energy of formation values are tabulated below:
| Type of Energy Interaction (kcal mol-1) | Ring C | Ring C' | Difference | Ring D | Ring D' | Difference |
|---|---|---|---|---|---|---|
| Energy of Formation | - 65.48 | - 91.18 | 25.70 | - 82.49 | - 62.97 | 19.52 |
The MOPAC/PM6 structures are very similar to those produced using the MM2 method. There is little change in this instance because there is a well defined bond between the carbonyl Oxygen and the adjacent Carbon. Therefore, when optimising the structure, it isn't possible for the optimisations to alter the distance between the two atoms very much. In both cases, intermediate rings C' and D are the more favourable conformations. These are the intermediates which are created from rings A' and B respectively. The proceeding four images show the C-O bond distances within the intermediate rings. These distances are comparable to those shown earlier in rings A, A', B and B'. Please note that only in the case of the intermediates is there an actual bond between the two atoms.
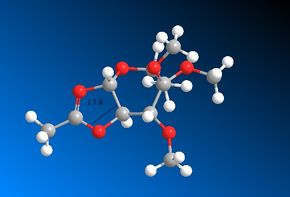
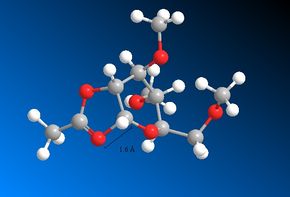


A comparison of all the C-O bond distances follows. The similarities to note are the bond distances shown between A' and C', B and D and B' and D'. This can be rationalised by the fact that the MOPAC/PM6 method takes into account the electronic orbital contributions when optimising the geometry. The similarities suggest that even though a single bond has not been strictly defined between the Oxygen and the Carbon (using ChemDraw), the MOPAC/PM6 has optimised the geometry is such a way that there is in fact a bond present. This is supported by the fact that a distance of 1.5 Å / 1.6 Å is in fact smaller than the combined van der Waals radii of Carbon and Oxygen. It can therefore be surmised that the MOPAC/PM6 method has in fact converted rings A', B and B' to C', D and D' respectively. Once again, this aids the rationalisation of the diastereospecificity. Rings A' and B have again been shown to be the more favourable conformations and according to the MOPAC/PM6 method, they are easily convertible to their C' and D analogues which are the intermediates of the glycosidation reaction. Ring A' forms the intermediate ring C' and then the β-anomer. Ring B forms the intermediate ring D and then the α-anomer.
One final way to compare the two different routes to the α-anomer and the β-anomer is to consider the Boltzmann distribution[16]: Ni = exp(-εi / kb T) where i is an arbitrary label given to each energy state, Ni is the relative population of a particular state, εi is the energy of a particular state, kb is the Boltzmann constant (3.298 x 10⁻²⁷ kcal K-1) and T is the temperature (298.15 K). To compare the most preferable route, the difference in the MOPAC/PM6 energy between rings C and C' and D and D' will be analysed. For each pair of rings, the ring with the lowest calculated MOPAC/PM6 energy is given an automatic value of 0 in terms of εi as well as an arbitrary label of i = 0. For the higher energy ring (i = 1), the εi value will in fact be the difference in energy between the two conformations. Table 12 and 13 display the results of these calculations:
| Arbitrary label of the energy state (i) | Energy - εi (kcal mol-1) | Population of the energy state | |
|---|---|---|---|
| Ring C | 1 | 25.7 | ~ 0 |
| Ring C' | 0 | 0 | 1 |
| Arbitrary label of the energy state (i) | Energy - εi (kcal mol-1) | Population of the energy state (Ni) | |
|---|---|---|---|
| Ring D | 0 | 0 | 1 |
| Ring D' | 1 | 19.5 | ~ 0 |
The ring with the lowest energy has a population of 1 by virtue of the fact that exp(0) = 1. The higher energy ring has such a low population that it can be approximated to 0. Again, this supports the fact that the two most favourable intermediates are ring C' and D because they have been shown to be almost 100% abundant.
Overall, this section has shown the versatility of computational chemistry when it comes to rationalising diastereospecificity. MM2 calculations as well as MOPAC/PM6 calculations have been used to give optimised structures of all the species involved in the glycosidation. All of the different methods have arrived at the same conclusion: ring A' is the preferred conformation in the formation of the intermediate ring C' and the β-anomer and ring B is the preferred conformation in the formation of the intermediate ring D and the α-anomer.
This conclusion is supported by the relevant literature[17] which has supplied minimised energies for all the ring systems analysed thus far. It was reported that a ring A' configuration has an optimised energy of -154.2 kJ mol-1 and forms an intermediate (ring C') with an energy of -116.0 kJ mol-1. It was also reported that a ring B configuration has an optimised energy of -79.8 kJ mol-1 and forms an intermediate (ring D) with an energy of -88.0 kJ mol-1.
MINI PROJECT - The Total Synthesis of (-)Cubebol
The aim of the Mini-Project is to analyse a synthetic pathway from the literature using all of the computational chemistry techniques which have been developed so far. This section will be used to show that computational chemistry is a useful tool in a chemists repertoire for analysing a reaction pathway before spending time on a reaction which, in essence, is designed to fail. The synthetic pathway from the literature to be analysed is part of the total synthesis of (-)Cubebol using (-)Menthone as a starting material. This is an interesting synthesis to examine because the stereochemical outcomes for each stage in the synthesis need to be carefully controlled. In a chemical sense, (-)Cubebol has found many medicinal and culinary uses and more recently has been developed into a cooling and refreshing agent[18]. The computationally predicted IR spectra, 13C NMR spectra and optical rotations can all be compared to the very comprehensive paper produced by D. M. Hodgson et al.. The following synthetic pathway details the four molecules which are to be analysed:

Molecule 11 is (-)Menthone and Molecule 1 is (-)Cubebol. Molecule 17 and Molecule 18 are important intermediates in the synthesis and can be seen to contain very specific stereochemical centres. Each molecule can be viewed in 3D by following the appropriate links.
All four molecules were drawn on ChemBio3D and their geometries were optimised using the MM2 method followed by the MOPAC/PM6 method. Table 14 displays the results from both of these methods:
| Type of Energy Interaction (kcal mol-1) | Molecule 11 | Molecule 17 | Molecule 18 | Molecule 1 |
|---|---|---|---|---|
| MM2 Total Energy | 11.83 | 100.32 | 37.24 | 33.93 |
| MOPAC/PM6 Total Energy | - 80.76 | - 45.91 | - 75.43 | - 84.46 |
The most notable energy value is that for Molecule 17. The MM2 value is particularly high because of the epoxide ring. This moiety is particularly reactive due to the strained configuration[19]. This property is exploited in the total synthesis of (-)Cubebol in the formation of Molecule 18 using Molecule 17 and a solution of LTMP.
The IR spectra have been predicted using the SCAN server by initially creating a Gaussian input file on ChemBio3D, selecting the appropriate options and then uploading the file to be run by the super computer. This analysis will confirm the presence of the Oxygen-based functional groups within the molecule. It is predicted that the spectra will also display the characteristic peaks for all the C-H groups. The functional group responsible for each predicted stretch has been confirmed using the animation system on GaussView 5.0. The 13C NMR spectra have been predicted using the GIAO approach. The geometry of the molecule was first optimised using the Gaussian Interface and then the NMR was predicted by running the job on the SCAN server. The chemical standard used for all the NMR spectra was TMS. The 13C NMR was analysed because this is the NMR type which will reveal the most information about the molecule as well as being far less complicated than the 1H NMR. The peaks in both types of spectra have been tabulated for facile comparison with the literature[20]. The Optical Rotation was predicted by modifying the output file for a previous geometry optimisation. The file was then re-submitted to the SCAN system to attain the required data.
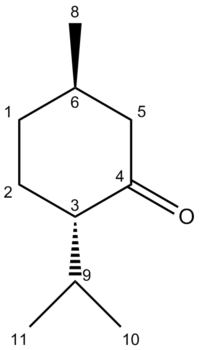
The following IR[21] and NMR[22] spectra are those predicted for Molecule 11. An image of the molecule has also been provided where the Carbon atoms have been numbered, allowing for facile recognition of which atom is responsible for each shift:


| Moiety Responsible | Predicted Stretch (cm-1) | Literature Stretch (cm-1) | % Difference |
|---|---|---|---|
| C-H out of plane bend | 775.9 | 750 | 3.45% |
| C-H wag | 1314.7 | 1315 | 0.02% |
| C-H rock | 1368.6 | 1369 | 0.03% |
| C-H bend | 1441.5 | 1455 | 0.93% |
| C=O | 1848.6 | 1712 | 7.98% |
| C-H stretch | 2860.3 | 2872 | 0.41% |
| C-H2 stretch (assymetric) | 2946.4 | 2931 | 0.51% |
| C-H2 stretch (symmetric) | 2978.5 | 2961 | 0.59% |
| Carbon Label | Predicted Resonance (ppm) | Literature Resonance (ppm) | Difference (ppm) |
|---|---|---|---|
| 4 | 208.9 | 212.3 | 3.4 |
| 3 | 56.0 | 55.8 | 0.2 |
| 5 | 50.3 | 50.8 | 0.5 |
| 6 | 37.1 | 35.4 | 1.7 |
| 1 | 34.0 | 33.9 | 0.1 |
| 2 | 32.8 | 27.8 | 5.0 |
| 9 | 28.4 | 25.8 | 2.6 |
| 8 | 23.4 | 22.2 | 1.2 |
| 10 | 22.8 | 21.2 | 1.6 |
| 11 | 20.1 | 18.7 | 1.4 |
The Optical Rotation was also predicted. This gave a value of -3.11[23]. The literature value is -28.5. The predicted value wasn't very close to the literature value but more importantly gave the correct direction for the polarisation of light.
As predicted, the IR spectrum displays all of the peaks which are associated with hydrocarbon chains and rings. The carbonyl stretch can also be seen as a very intense peak at 1848.6 cm-1. The predicted peaks were all found to be within 8% of the literature which is known to be the maximum error to take into consideration when dealing with this strategy of predicting IR peaks[24]. The predicted NMR shifts are also fairly close to those found in the literature. This proves that the optimised geometry is the same structure as that which was synthesised in the paper. If the predicted NMR shifts are further than ~5.0 ppm away from the literature values, it can indicate that the structure drawn on ChemBio3D is incorrect[25]. The majority of the shifts are found at low resonances because most of the Carbons are shielded in terms of electron density. The only Carbon in Molecule 11 which is deshielded is the one directly attached to the electronegative Oxygen. The magnitude of deshielding on the Carbons decreases the further they are away from the Oxygen atom.
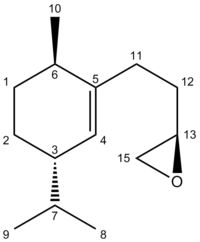
The following IR[26] and NMR[27] spectra are those predicted for Molecule 17. An image of the molecule has also been provided where the Carbon atoms have been numbered, allowing for facile recognition of which atom is responsible for each shift:


| Moiety Responsible | Predicted Stretch (cm-1) | Literature Stretch (cm-1) | % Difference |
|---|---|---|---|
| C-H out of plane bend | 838.4 | 836 | 0.29% |
| C-H wag | 908.7 | 918 | 1.01% |
| C-H rock | 1365.4 | 1367 | 0.12% |
| C-H bend | 1444.6 | 1463 | 1.26% |
| C-H stretch | 2858.4 | 2851 | 0.26% |
| C-H2 stretch (assymetric) | 2933.4 | 2929 | 0.15% |
| C-H2 stretch (symmetric) | 2953.8 | 2955 | 0.04% |
| Carbon Label | Predicted Resonance (ppm) | Literature Resonance (ppm) | Difference (ppm) |
|---|---|---|---|
| 5 | 139.1 | 141.0 | 1.9 |
| 4 | 125.4 | 125.8 | 0.4 |
| 13 | 51.4 | 52.3 | 0.9 |
| 15 | 46.6 | 47.1 | 0.5 |
| 3 | 43.7 | 42.1 | 1.6 |
| 11 | 36.7 | 32.4 | 4.3 |
| 7 | 34.6 | 32.3 | 2.3 |
| 12 | 33.8 | 32.2 | 1.6 |
| 1 | 33.3 | 31.2 | 2.1 |
| 6 | 32.7 | 31.1 | 1.6 |
| 2 | 29.4 | 24.6 | 4.8 |
| 8 | 21.6 | 19.7 | 1.9 |
| 9 | 21.4 | 19.6 | 1.8 |
| 10 | 19.8 | 19.3 | 0.5 |
The Optical Rotation was also predicted. This gave a value of +21.45[28]. The literature value is +26.8. The predicted value was very close to the literature value and more importantly gave the correct direction for the polarisation of light.
For Molecule 17, the IR shows an excellent match to the peaks reported in the literature and the percentage differences are all very low. The IR also displays a peak at ~1730 cm-1 which was not reported in the literature. This peak is due to the alkene C=C double bond. The NMR is fairly accurate but there are a few cases where the difference in shift values is fairly high. This method of predicting NMR shifts has some inherent errors. As long as the predicted shifts aren't too dissimilar to those reported in the literature, it suggests that the ChemBio3D optimised geometry is the same as the real structure of the molecule. There are two highly deshielded Carbons, seen by the presence of two shifts at high resonances. These are the two Carbons which form the 3-membered epoxide ring and hence are in close proximity to the Oxygen.
The following IR[29] and NMR[30] spectra are those predicted for Molecule 18. An image of the molecule has also been provided where the Carbon atoms have been numbered, allowing for facile recognition of which atom is responsible for each shift:


| Moiety Responsible | Predicted Stretch (cm-1) | Literature Stretch (cm-1) | % Difference |
|---|---|---|---|
| C-H wag | 1224.7 | 1216 | 0.72% |
| C-H rock | 1370.4 | 1371 | 0.04% |
| C-H bend | 1385.7 | 1385 | 0.05% |
| --- | --- | 2870 | --- |
| --- | --- | 2928 | --- |
| C-H stretch | 2988.0 | 2958 | 1.01% |
| C-H2 stretch (symmetric) | 2953.8 | 2955 | 0.04% |
| --- | --- | 2851 | --- |
| O-H stretch | 3795.3 | 3608 | 5.19% |
| Carbon Label | Predicted Resonance (ppm) | Literature Resonance (ppm) | Difference (ppm) |
|---|---|---|---|
| 9 | 74.6 | 75.1 | 0.5 |
| 3 | 39.2 | 44.1 | 4.9 |
| 5 | 35.2 | 35.4 | 0.2 |
| 10 | 32.8 | 34.5 | 1.7 |
| 7 | 32.7 | 33.5 | 0.8 |
| 8 | 32.4 | 31.6 | 0.8 |
| 13 | 31.2 | 31.4 | 0.2 |
| 6 | 28.9 | 29.9 | 1.0 |
| 4 | 27.0 | 28.6 | 1.6 |
| 1 | 24.7 | 26.5 | 1.8 |
| 14 | 22.9 | 24.6 | 1.7 |
| 15 | 21.2 | 19.9 | 1.3 |
| 2 | 20.5 | 19.6 | 0.9 |
| 12 | 20.4 | 19.1 | 1.3 |
The Optical Rotation was also predicted. This gave a value of +28.45[31]. The literature value is -10.7. As seen previously, the numerical value is relatively close to the one reported in the literature. However, it predicts that the molecule will polarise light in the opposite direction to what it does it reality. This could be because the optimised structure was in fact slightly different to the actual structure (i.e. a local energy minimum was found rather than a global minimum).
Again, the majority of the IR stretches are predicted with a very high accuracy. However, there are a few peaks which were unaccounted for. The region around 2900 - 3300 cm-1 displays a high number of peaks with a variety of intensities. It is possible that the peaks reported in the literature are present in this area but are showing up in a slightly different position. There is an especially high percentage difference associated with the peak for the O-H stretch. For the real molecule, the O-H stretch would actually produce a broad peak because of the fluxionality affiliated with the hydroxyl proton. The NMR shifts are fairly accurate. The low field resonance is predicted for the Carbon adjacent to the hydroxyl functional group.
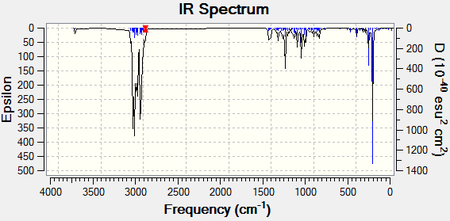
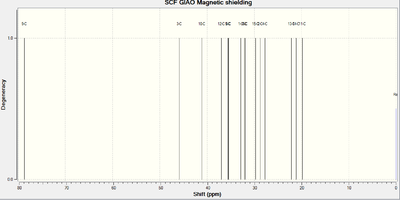
The following IR[32] and NMR[33] spectra are those predicted for Molecule 1. An image of the molecule has also been provided where the Carbon atoms have been numbered, allowing for facile recognition of which atom is responsible for each shift:

| Moiety Responsible | Predicted Stretch (cm-1) | Literature Stretch (cm-1) | % Difference |
|---|---|---|---|
| C-H wag | 909.2 | 910 | 0.09% |
| C-H2 wag | 1144.3 | 1142 | 0.11% |
| C-H bend | 1500.3 | 1490 | 0.69% |
| --- | --- | 2860 | --- |
| C-H stretch | 2957.0 | 2951 | 0.20% |
| O-H stretch | 3801.0 | 3350 | 12.26% |
| Carbon Label | Predicted Resonance (ppm) | Literature Resonance (ppm) | Difference (ppm) |
|---|---|---|---|
| 9 | 78.7 | 80.3 | 1.6 |
| 3 | 45.9 | 44.1 | 1.8 |
| 10 | 41.0 | 39.0 | 2.0 |
| 12 | 37.0 | 36.3 | 0.7 |
| 5 | 35.6 | 33.6 | 2.0 |
| 8 | 35.5 | 33.4 | 1.1 |
| 1 | 32.9 | 31.7 | 1.2 |
| 7 | 32.1 | 30.8 | 1.3 |
| 6 | 31.9 | 29.5 | 2.4 |
| 15 | 29.7 | 27.9 | 1.8 |
| 2 | 28.7 | 26.4 | 2.3 |
| 4 | 27.7 | 22.9 | 4.8 |
| 13 | 22.2 | 20.1 | 2.1 |
| 14 | 21.2 | 19.6 | 1.6 |
| 11 | 19.8 | 18.7 | 1.1 |
The Optical Rotation was also predicted. This gave a value of -47.06[34]. The literature value is -48.3. The predicted value was very close to the literature value and more importantly gave the correct direction for the polarisation of light.
Almost all of the IR peaks are very similar to those in the literature. The only exception is the peak for the O-H stretch which would appear as a broad peak rather than a small, sharp peak. The NMR resonances are also fairly consistent with the literature and the degree of deshielding decreases the further the Carbon atoms are from the Oxygen.
In the same paper, an isomer of (-)Cubebol named (-)10-epi-cubebol (Molecule 39) was created using (+)Menthone as a starting material. The structure can be viewed in 3D by using the relevant link. The only structural difference for Molecule 39 is the direction in which the methyl group is facing. The molecule was also drawn on ChemBio3D and the geometry was optimised using both the MM2 and MOPAC/PM6 technique. Table 23 displays the results:
| Type of Energy Interaction (kcal mol-1) | Molecule 39 |
|---|---|
| MM2 Total Energy | 35.02 |
| MOPAC/PM6 Total Energy | - 83.29 |
These values show that the structure of Molecule 39 is slightly higher in energy than the structure of Molecule 1. Since the only difference is the direction of the methyl group, these additional unfavourable interactions can be attributed to the fact that the methyl protons are interacting with adjacent atoms which they are closer to than they are for Molecule 1.
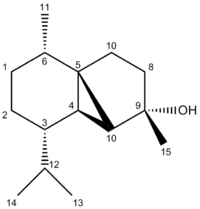
The following IR[35] and NMR[36] spectra are those predicted for Molecule 39. An image of the molecule has also been provided where the Carbon atoms have been numbered, allowing for facile recognition of which atom is responsible for each shift:


| Moiety Responsible | Predicted Stretch (cm-1) | Literature Stretch (cm-1) | % Difference |
|---|---|---|---|
| C-H wag | 935.7 | 931 | 0.50% |
| C-H2 wag | 950.3 | 946 | 0.45% |
| C-H3 wag | 1168.8 | 1151 | 1.55% |
| C-C stretch | 1198.0 | 1193 | 0.42% |
| C-H rock (asymmetric) | 1321.5 | 1320 | 0.11% |
| C-H rock (symmetric) | 1361.8 | 1368 | 0.45% |
| C-H bend | 1452.5 | 1447 | 0.38% |
| --- | --- | 2862 | --- |
| --- | --- | 2935 | --- |
| C-H stretch | 2976.5 | 2956 | 0.69% |
| O-H stretch | 3802.0 | 3390 | 12.15% |
| Carbon Label | Predicted Resonance (ppm) | Literature Resonance (ppm) | Difference (ppm) |
|---|---|---|---|
| 9 | 76.9 | 80.1 | 3.4 |
| 3 | 43.5 | 42.4 | 1.1 |
| 10 | 41.7 | 41.1 | 0.6 |
| 12 | 35.4 | 36.5 | 1.1 |
| 8 | 34.2 | 33.7 | 0.5 |
| 5 | 33.9 | 32.8 | 1.1 |
| 7 | 31.7 | 30.8 | 0.9 |
| 1 | 29.6 | 29.3 | 0.3 |
| 6 | 29.4 | 29.3 | 0.1 |
| 15 | 28.3 | 28.6 | 0.3 |
| 4 | 24.6 | 20.7 | 3.9 |
| 2 | 22.4 | 19.9 | 2.5 |
| 13 | 20.7 | 19.7 | 1.0 |
| 14 | 19.7 | 19.2 | 0.5 |
| 11 | 17.7 | 17.4 | 0.3 |
The Optical Rotation was also predicted. This gave a value of -43.68[37]. The literature value is -72.3. The predicted value wasn't close to the literature value but more importantly gave the correct direction for the polarisation of light.
Both the IR peaks and the NMR resonances are very similar to those found in the literature. Again, the O-H stretch has been estimated to occur at a much higher wavenumber than it would for the real molecule. Molecule 39 shows very similar shifts to the ones seen by Molecule 1. This is expected because both structures are identical apart from the direction of the methyl group. The main difference between the two molecules is seen in the form of their optical rotations. Both molecules polarise light in the same direction but the magnitude of this polarisation is different. Molecule 39 polarises light by a greater degree compared to Molecule 1 (-72.30 vs. - 48.30). This is not supported by the computational analysis, however. Fortunately, the direction of polarisation is correct (and has been correct for 4 out of the 5 molecules analysed).
So far in this section, comparisons have been drawn to see whether computational chemistry is able to accurately predict NMR shifts and IR peaks as well as Optical Rotations. In the literature[38], some conformational analysis has also been carried out to determine the mode of attack in the formylation of menthone and isomenthone enolates. Each of the four types of attack were modelled in FIGURE 3 of the paper.
So as an aside, the cis- and trans- geometries of methyl formate have been modelled on ChemBio3D to confirm the difference in energy between the two. Images of the two conformations are given below as well as a table showing the MM2 energy minimisation results:
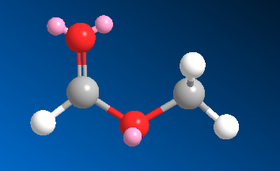
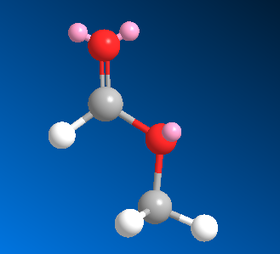
| Type of Energy Interaction (kcal mol-1) | Cis- | Trans- |
|---|---|---|
| MM2 Total Energy | 6.84 | 10.45 |
In the literature, the energies of the two geometries were reported to be 0 kJ mol-1 (cis-) and 20kJ mol-1 (trans-) and supports the data collected from ChemBio3D.
Although there is free rotation around the C-O bond to alternate between the two forms, the cis- version of the molecule is a more favourable conformation meaning that the equilibrium lies towards this conformer. A full diagram of the important interactions is summarised well in the lecture notes[39]:
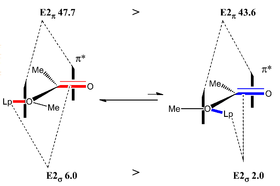
This is supported by the synthetic findings throughout the paper. This step in the synthesis is important because it dictates the stereochemistry of all the proceeding molecules. Therefore, it was important to model the transition states to accurately determine the mode of attack and the eventual stereochemistry of the product.
Overall, this section has proven that computational chemistry is a powerful technique for predicting IR peaks and NMR resonances. All of the molecules which have been modelled have shown an excellent correlation with the data given in the literature. The predicted IR peaks were usually within 1% of the actual values with the exception of the predicted peak for the O-H stretch. The predicted NMR shifts were usually within 2 ppm of the actual values, although, each spectrum was found to have one or two resonances which were reasonably far away from the literature values. The majority of the optical rotations were predicted with the correct numerical sign but some were found to be slightly different to those in the literature.
References
- ↑ M. E. Jamroz et al., Journal of Molecular Structure (Theochem), 2003, 634, pp 225 - 233
- ↑ K. C. Nicolaou et al., J. Am. Chem. Soc., 1995, 117, pp 624 - 633
- ↑ 3rd Year Computational Chemistry Online Lab Manual, Module 1, 2011
- ↑ T. A. Halgren, Journal of Computational Chemistry, 1996, 17 (5-6), pp 490 - 519
- ↑ 3rd Year Computational Chemistry Online Lab Manual, Module 1, 2011
- ↑ M. Squillacote et al., J. Am. Chem. Soc, 1975, 97 (11), pp 3244 - 3246
- ↑ W. F. Maier et al., J. Am. Chem. Soc., 1981, 103, pp 1891
- ↑ J. Clayden et al., Organic Chemistry, Oxford University Press, United States, 2001, pp 484
- ↑ T. Hunt, 2nd Year Inorganic Chemistry Lecture Course - Molecular Orbitals, Character Table, 2010
- ↑ 3rd Year Computational Chemistry Online Lab Manual, Module 1, 2011
- ↑ B. Halton et al., J. Chem. Soc., Perkin Trans 2, 1992, pp 447
- ↑ http://hdl.handle.net/10042/to-10403
- ↑ http://hdl.handle.net/10042/to-10404
- ↑ J. Coates, Encyclopaedia of Analytical Chemistry, R. A. Meyers (Ed.), 2000, pp 10815 - 10831
- ↑ A. Spivey, 3rd Year Organic Lecture Course - An Introduction To Stereoelectronics, Lecture 3, 2011
- ↑ P. Atkins et al., Physical Chemistry, Oxford University Press, United States and Canada, Eighth Edition, 2006, pp 81
- ↑ D. M. Whitfield et al., Carbohydr. Res., 2007, 342, pp 1291
- ↑ D. M. Hodgson et al., J. Org. Chem., 2010, 75, pp 2157 - 2168
- ↑ J. Clayden et al., Organic Chemistry, Oxford University Press, United States, 2001, pp 435
- ↑ D. M. Hodgson et al., J. Org. Chem., 2010, 75, pp 2157 - 2168
- ↑ http://hdl.handle.net/10042/to-10405
- ↑ http://hdl.handle.net/10042/to-10406
- ↑ http://hdl.handle.net/10042/to-10435
- ↑ 3rd Year Computational Chemistry Online Lab Manual, Module 1, 2011
- ↑ 3rd Year Computational Chemistry Online Lab Manual, Module 1, 2011
- ↑ http://hdl.handle.net/10042/to-10407
- ↑ http://hdl.handle.net/10042/to-10408
- ↑ http://hdl.handle.net/10042/to-10409
- ↑ http://hdl.handle.net/10042/to-10410
- ↑ http://hdl.handle.net/10042/to-10411
- ↑ http://hdl.handle.net/10042/to-10438
- ↑ http://hdl.handle.net/10042/to-10412
- ↑ http://hdl.handle.net/10042/to-10413
- ↑ http://hdl.handle.net/10042/to-10414
- ↑ http://hdl.handle.net/10042/to-10415
- ↑ http://hdl.handle.net/10042/to-10416
- ↑ http://hdl.handle.net/10042/to-10417
- ↑ D. M. Hodgson et al., J. Org. Chem., 2010, 75, pp 2157 - 2168
- ↑ H. Rzepa, 2nd Year Organic Chemistry Lecture - Conformational Analysis, 2011
