Rep:Mod:SA4213MgO
Introduction
In the experiment the thermal expansion of magnesium oxide (MgO), its phonon dispersion and energy were studied using a quasi-harmonic approximation and a molecular dynamics approach. The energies and vibrations in the lattice were calculated to find the free energy of the crystal and thermal expansion.
The quasi-harmonic approximation (QHA) was used to compute volume-dependent thermal effects - such as the thermal expansion coefficient. This model is based on a harmonic oscillator, where each possible bond length is approximated by a quadratic function; but the QHA contains an additional anharmonic factor. This factor more allows the approximation to more closely mirror reality and as such we can account for thermal expansion, as the equilibrium bond length is no longer independent of temperature.
The molecular dynamics approach governs the motion of the atoms with Newtonian mechanics from interatomic forces. Therefore it is necessary to provide initial velocities and positions of the atoms, and then the computation propagates by iteratively repeating the algorithm with a set time step. New positions and velocities are set by calculation from the applied force and therefore acceleration (F = ma) that occurs between the atoms.
The software used in this experiment is RedHat Linux, DLVisualize (DLV) and General Utility Lattice Program (GULP). GULP is primarily used to perform simulations on materials using various boundary conditions, for example 0D (molecules), 1D (polymers), 2D (surfaces) or 3D (periodic solids), in our experiments we have an emphasis on 3D lattice dynamics. DLV is a general purpose graphical user interface for visualising the output of calculations.
Internal Energy of an MgO Crystal
 |
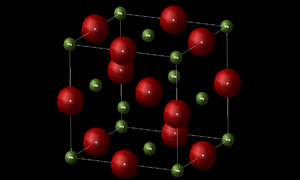 |
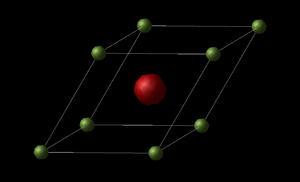
It is necessary to define our unit cell for our MgO calculations, as such we have the primitive unit cell (Figure 1) and the conventional unit cell (figure 2). The primitive cell has a total of 2 atoms – Mg and O; thus is the simplest cell to describe the crystal. It's cell vector dimensions are shown in table 1. The cell takes the shape of a rhombohedron with a lattice constant of a = 2.978 Å and internal angle α = 60°. The GULP calculation correlates with LCAO HF calculations found in literature (2.573 Å [1]).
| 0.00000 | 2.10597 | 2.10597 |
| 2.10597 | 0.00000 | 2.10597 |
| 2.10597 | 2.10597 | 0.00000 |
A simple calculation to find the total lattice energy was undertaken. In this, the Mg ion is given a charge of +2e, the O ion -2e and electrostatic potentials are considered, then the energy required to separate the ions of the lattice to infinite separation is calculated at absolute zero. This gave a value of -41.07 eV per primitive unit cell.
The conventional cell, Figure 2, is face centred cubic with a lattice constant of 4.212 Å and internal angle of 90°. As before this also allies with literature (4.211 Å [2]. The conventional cell is larger than the primitive, and contains 8 atoms – 4 of both Mg and O; as such it has quadruple the volume of the primitive cell.
Computing the Phonon Dispersion Curves
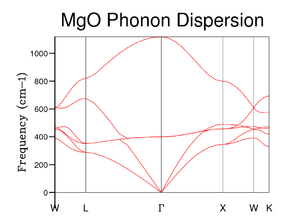 |
Next the phonon dispersion curve of MgO was computed using GULP – figure 3. Here we measured the frequency of a photon needed to excite the vibration at 50 values of k along the path W, L, Γ, X, W, K. We can see 6 different phonon modes, or branches in the dispersion curve. This is due to each axis having acoustic (in-phase vibration) and optical (out-of-phase vibration) phonons arising from having 2 atoms in our primitive cell.[3] For the three optical modes (3N-3) as k approaches 0 their frequencies are non zero as they cause the atoms to move in opposite directions upon excitation. For the three acoustic modes, due to their in phase vibrations their wavelength approaches infinity. The equation relating phonon wavelength and wavenumber: tells us that as lambda approaches infinity, k approaches 0 at Γ. Tracing the branches from Γ to L, and then W, the acoustic branches split into the three acoustic vibrational modes. These are seen as two transverse modes which are degenerate at L and a longitudinal mode.
Phonon Density of States (DOS)
From the phonon dispersion curves, we can find the number of available states at each K value we consider. The number of states can then be plotted as a function of frequency to obtain a density of states (DOS) relation. As such we receive DOS curves plotting the distribution of phonons in terms of vibration and by extension energy as:
The more k values we consider, the more detailed and accurate our Phonon DOS will be. To achieve the most accurate answer we would need to having an infinitely large nxnxn grid such that we sample over all k points in our cell, essentially meaning the spacing between k points is dk. This would lead to an infinitely long computation and be very expensive with very large values of n. Instead we must find a grid size large enough to provide enough k points to resemble the true value, and when increased doesn't provide as large an increase in the utility of the information we're getting out as the increase in computation time we're using to perform the calculation.
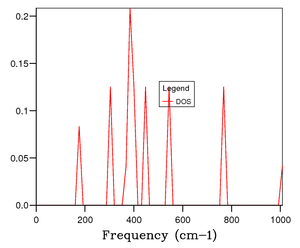
Figure 4 shows the Phonon DOS using a 1x1x1 grid, which samples one k value. By comparing the peak intensities and frequencies (288 cm-1 and 352 cm-1; 676 cm-1 and 819 cm-1) We see the pair of peaks at 300 cm-1 is roughly double the intensity of those around 700 cm-1. Implying branches have come together to be degenerate at that K value. Those frequencies match with the K point L, and it can be seen from W to L that 4 branches combine to 2. It was found that 16x16x16 (Figure 6) was both computationally cheap and able to accurately replicate the Phonon DOS of larger n value grids (figure 7 - 32x32x32). The larger the n value beyond 16 the smoother the graph of the DOS as more k points are being sampled it is more representative of the true Phonon DOS.
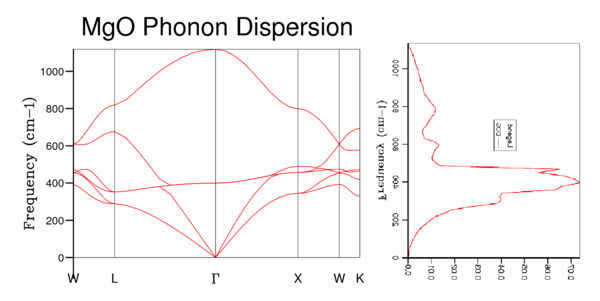 |
The Phonon DOS(frequency) is proportional to the inverse of the slope of Frequency(k) vs. k, which corresponds to flatter branches equal larger DOS values at that frequency.[4] Figure 8 shows this visually. We can see that if we sample enough k points we will produce a DOS that samples from enough of the k values to accurately translate the dispersion graph. A 1x1x1 grid size only samples one k value and so doesn't accurately represent the DOS of MgO. Whereas the 32x32x32 grid accurately translated the inverse of the slope into its DOS plot.
The size of the grid is dependent on the size of the cell in real space. As large values of a (large cells in real space) will give small values of a* (small cells in k space). If instead we were looking at the DOS of a metal such as lithium, which has a small cell in real space (a = 3.51 Å[5]) - therefore large cell in k space, we will need large values of n so that the k values we sample will accurately represent the k values across all of the cell. Conversely a large repeat unit for example in a zeolite (a = 24.5 Å.[6], will have a small cell in k space, thus we can produce accurate results with small values of n as the k points we sample will be close together so the points we're missing won't add enough information to our DOS to outweigh the negative of doing a more computationally intensive calculation. We could perform this grid size DOS calculation on a crystal cell of similar size such as CaO as its cell will have many similarities with MgO. Most importantly the value of a = 4.800 Å[2] and the similarity of MgO to CaO will produce similar cells in k space, so we can expect a 16x16x16 grid size to produce a reasonable approximation of DOS.
Computing the Free Energy using the Quasi-Harmonic Approximation
Table 2 shows the variation of free energy as a function of grid size. As n increases the free energy value converges to -40.926483 eV. Beyond n=4 the variation in free energy quickly approaches 0. This replicates when we tried to find the optimum grid size that best compromised accuracy and computation time, that beyond a certain limit the increase in accuracy reduces to an acceptable level such that it is unnecessary to study larger grid sizes. The variation in free energy between k=1 and k=48 is not large and accounts for 0.009% of the total free energy. The main contributions to the free energy, monopole interactions and inter-atomic potentials, are covered by the Buckingham potential and so the deviation from the converged value isn't large.
Thermal Expansion of MgO
The structure of MgO was then optimised with respect to the free energy, whilst varying temperature between 0 to 1000 K. The free energy was then computed within the quasi-harmonic approximation. Additionally, the thermal expansion of MgO was computed using molecular dynamics and the results compared with that from the quasi-harmonic approximation. Temperature is a measure of the kinetic energy of the molecules in the cell, therefore as temperature increases kinetic energy and velocity will increase. An increase in velocity will cause a larger maximum amplitude in the quantum harmonic approximation. This effect across all the atoms leads to an expansion. The coefficient of thermal expansion measures the dependence of size on temperature, standardised by dividing by the dimensionality under study, for example by volume if αV. The general equation is:
- where αx is the thermal expansion coefficient, x is the (initial) dimension under study, ∂x is the partial derivative of that dimension, ∂T is the partial derivative of temperature (at constant pressure)
From this we can see that the greater the expansion per unit increase in temperature the larger the thermal expansion coefficient. We expect MgO to have a low volumetric thermal expansion coefficient, due to the strong ionic bonding present.
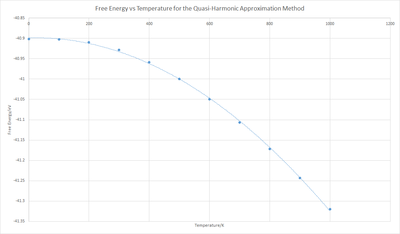
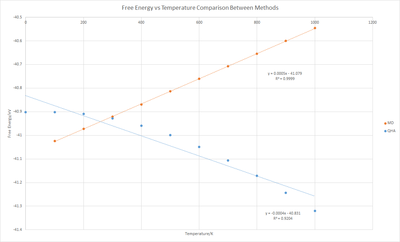
When Free energy against Temperature was plotted (Figure 10) it showed that the free energy becomes more negative with increasing temperature. In the Quasi-Harmonic approximation free energy is calculated via:
Therefore we have a linear decrease in free energy as temperature increases. This general shape of the graph is a curve, which suggests more variables are affecting the free energy. If we're to look at Gibb's Free energy:
inserting into the above:
As , and
We can explain the decrease in the Gibbs free energy, as despite having an increase in volume, the entropic contribution wins due to the large temperature change. The initial slow decrease in free energy suggests that the change in pressure isn't constant, as we expect: which would give a linear negative gradient. These disparities from the above equations could be due to limitations of the approximation.
Calculating the Thermal Expansion Coefficients
Linear Thermal expansion coefficient:
K-1
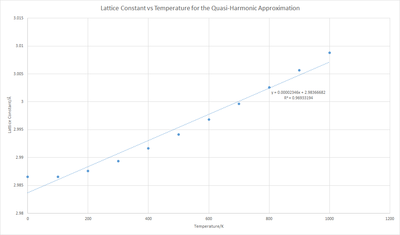
Using L0 as the lattice constant at 0K and the gradient of figure 11 as dL/dT
Volumetric Thermal expansion coefficient:
K-1
It is interesting to note that αV is 3.020 times αL. This implies MgO is an isotropic material[7], as the value is essentially 3 - within in the error caused by limitations in the theory - which would manifest itself as equal expansion along each lattice constant a, b and c. Therefore we can express αV as: =
Choosing L0 as 200 K we get 7.852 x10⁻⁶ K-1, which is similar to the literature value at 200 K of 7.39 x10⁻⁶ K-1.[1] When comparing the value for αV at 300 K, the measured literature is 3.12 x10⁻⁵ [8], compared to our value of 2.37 x10⁻⁵. Whilst of the same magnitude, the literature value is 31.6% larger, which could be a manifestation of the phonon interaction or anharmonicity that is neglected by QHA becoming prominent.
In this calculation, the main approximation is to do with the anharmonic contributions to the harmonic approximation. To simplify computing anharmonicity, the phonon frequencies are volume dependent. This means that at higher temperatures the anharmonic factor increases. Other approximations include the Born-Oppenheimer Approximation which assumes that the motion of atomic nuclei and electron in a molecule can be separated. These approximations thus limit the precision and validity of the model used at higher temperatures.
In a diatomic molecule, assuming a perfect harmonic potential, increasing temperature wouldn't change the equilibrium bond length - as the harmonic oscillations are symmetrical. The amplitude of vibration would increase with temperature though it would still be vibrating about its mean bond length.
Molecular Dynamics
Next the crystal was studied via Molecular Dynamics (MD), this required a different cell to that in the QHA. In QHA we were able to use a primitive unit cell with 1 MgO unit, this wouldn't produce meaningful data as every cell of the crystal would be moving in phase. Therefore we are using a 2x2x2 supercell of conventional unit cells, therefore containing 32 MgO units. We could have used a larger cell for more accurate results, but as before we face a trade off between information gained and computational time spent.
 |
 |
Figures 12 and 13 show that as the temperature increases in MD calculations the energy and cell volume (per formula unit) increased linearly. This is because the MD calculations treat the system classically under and as such: - therefore there is a positive linear increase in E with T. This is different to the QHA approach which as discussed above, computes energy via: Therefore we should have a linear decrease in free energy as temperature increases.
When comparing the cell volume per formula unit, we see that in the range 400-1000 K both methods produce a very similar change in volume per unit increase in temperature - therefore similar coefficient of thermal expansion:
αV:QHA = 2.89 x10⁻⁵ K-1
αV:MD = 3.00 x10⁻⁵ K-1
With the difference coming from the difference in volume of the cell at 400 K rather than the step increase in volume per Kelvin. These two methods correlate in the 400-1000 K temperature range. From 0-400 K molecular dynamics doesn't follow the curved section of the QHA approach, in this region the anharmonicity isn't as prevalent as the higher temperature regime so QHA is more accurate. MD on the other hand doesn't accurately reproduce how MgO reacts in reality at lower temperatures. The shape of the QHA approach (figure 13) is more similar to literature graphs than MD, as such the equations for the thermal expansion coefficient are a more complex polynomial than the simplified linear graphs we've created between 300 to 3100 K - αV = 2.6025 10-5 + 1.3535 10-8 T + 6.5687 10-3 T-1 - 1.8281 T-2. [9]
There are limitations for both models. Both describe atoms as hard, charged spheres that interact in a classical manner; therefore there is no consideration of atom overlap that would be considered in a quantum mechanical approach. This sets a ceiling to which the accuracy of both models can achieve. Additionally the models approximate long range interactions to be equal to zero, which wouldn't be the case for atoms just outside the closest neighbours of the atom under study.
Conclusion
In this experiment we completed our objective of studying the thermal expansion of MgO and phonon dispersion, and comparing the quasi-harmonic approximation and a molecular dynamics approach. Both approaches were able to find thermal expansion coefficients similar to literature within the range 400-1000 K. At lower temperatures QHA was more accurate as anharmonic effects were less relevant to the vibrations.
References
- ↑ 1.0 1.1 O. Madelung, U. Rössler, M. Schulz. Calcium oxide (CaO) crystal structure, lattice parameters, thermal expansion. In: II-VI and I-VII Compounds; Semimagnetic Compounds. Landolt-Börnstein - Group III Condensed Matter(41B). Springer Berlin Heidelberg;1999: p1-3. DOI: 10.1007/10681719_224
- ↑ 2.0 2.1 U. Rössler and R. Blachnik, Magnesium Oxide Crystal Structure, Lattice Parameters, Thermal Expansion, In: II-VI and I-VII compounds; semimagnetic compounds, Springer, Berlin, 1999, 1-6
- ↑ G. E. Peckham. Phonon Dispersion Relations in Crystals. 1964: 1-5.
- ↑ R. Hoffmann, Angew. Chem. Int. Ed. Engl., 1987, 56, pp 846-878; DOI: 10.1002/anie.198708461
- ↑ M. Nadler and C. Kempfer, Anal. Chem., 1959, 31, 2109
- ↑ J. Weitkamp and L. Puppe, Catalysis and Zeolites, Springer Berlin Heidelberg, Berlin, 1999, 311
- ↑ J.R. Vinson, Plate and Panel structures of Isotropic, Composite and Piezoelectric Materials, including Sandwich Construction. Delaware; Springer; 2005
- ↑ B. B. Karki, R. M. Wentzcovitch, S. de Gironcoli, S. Baroni, Phys. Rev. B, 2000, 61, p8793; DOI: 10.1103/PhysRevB.61.8793
- ↑ L.S. Dubrovinsky, S.K. Saxena, Phys Chem Minerals, 1997, 24, pp 547–550


