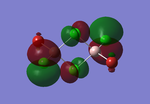
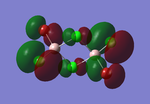
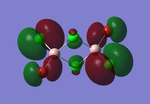
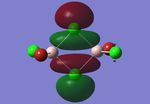
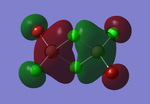
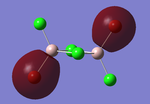
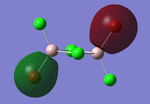
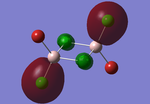
Rep:Mod:S24R05J93S
Introduction to Inorganic Computational Chemistry
BH3 Computation
Using the 3-21G basis set, the optimised structure of a BH3 molecule has been computed and the .log output file is presented here. This optimisation yielded the following information:
- Bond Angles (°): 119.986 (H4, B1, H3), 119.998 (H3, B1, H2), 120.016 (H2, B1, H4)
- Bond Lengths (Å): 1.19467 (B1, H2), 1.19445 (B1, H3), 1.19480 (B1, H4)
- File Type: .log
- Calculation Type: FOPT
- Calculation Method: RB3LYP
- Basis set: 3-21G
- Final Energy (au): -26.46226429
- Gradient (au): 0.00008851
- Dipole Moment (Debye): 0.0003
- Point Group: Cs
- Time of Calculation: 35.0 seconds
This optimisation has not produced the expected point group of D3h for borane, however this results through the manual lengthening of the B-H bonds, which broke the symmetry of the molecule. It can be seen however that the optimised structure does have D3h symmetry when the above bond angles and bond lengths are rounded to 1 decimal place and 2 decimal places respectively, (the bond angles are all 120.0° and the bond lengths are 1.20 Å when this approximation is made). The below section of the output file indicates that the forces and the displacements are converged, indicating that the energy minimum has been calculated.
         Item               Value     Threshold  Converged?
 Maximum Force            0.000220     0.000450     YES
 RMS     Force            0.000106     0.000300     YES
 Maximum Displacement     0.000709     0.001800     YES
 RMS     Displacement     0.000447     0.001200     YES
 Predicted change in Energy=-1.672478D-07
 Optimization completed.
    -- Stationary point found.
                           ----------------------------
                           !   Optimized Parameters   !
                           ! (Angstroms and Degrees)  !
 --------------------------                            --------------------------
 ! Name  Definition              Value          Derivative Info.                !
 --------------------------------------------------------------------------------
 ! R1    R(1,2)                  1.1947         -DE/DX =   -0.0002              !
 ! R2    R(1,3)                  1.1944         -DE/DX =   -0.0001              !
 ! R3    R(1,4)                  1.1948         -DE/DX =   -0.0002              !
 ! A1    A(2,1,3)              119.9983         -DE/DX =    0.0                 !
 ! A2    A(2,1,4)              120.0157         -DE/DX =    0.0                 !
 ! A3    A(3,1,4)              119.986          -DE/DX =    0.0                 !
 ! D1    D(2,1,4,3)            180.0            -DE/DX =    0.0                 !
 --------------------------------------------------------------------------------
 GradGradGradGradGradGradGradGradGradGradGradGradGradGradGradGradGradGrad
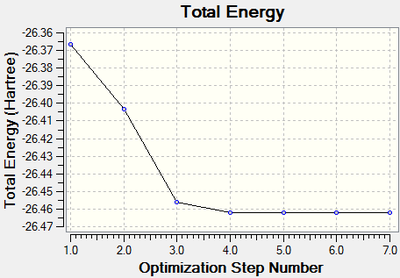

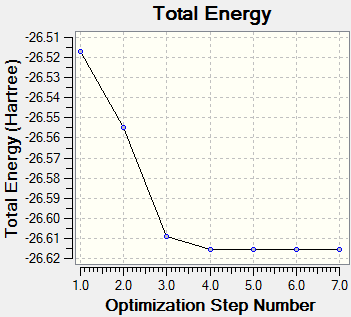
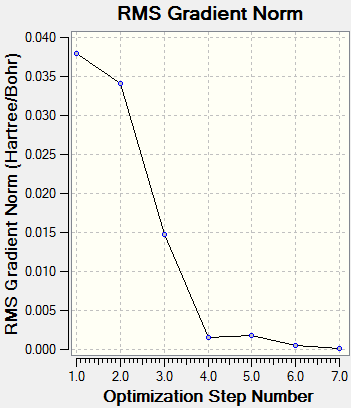
While watching the generated animation, which illustrates the progression of the optimisation, it clearly shows that at the fist optimisation, no bonds have been drawn between the central boron atom and the hydrogen atoms. The programme used, Gaussview, draws all bonds between atoms based on pre-defined distance criteria, yet, it is known that there is electron density between the boron and hydrogen atoms, so for a structural convenience, bonds are drawn between these atoms. Perhaps a better definition for the existence of a bond is the detected presence of electron density between the atoms, formed by positive atomic orbital overlap to from molecular orbitals, which are to be bonded together. The final proposed structure and corresponding bond lengths and angles are representative of the molecular structure in the gas phase. Furthermore, this structure could potentially be found in the solid phase, when no crystal packing forces exist, which otherwise act to distort the molecule.
The data obtained can however be improved by running the calculation using a different basis set, namely the 6-31G(d,p) set, which further optimised the structure of BH3, and the .log output file is presented here.
The following data has been obtained from the calculation:
- Bond Angles (°): 119.987 (H4, B1, H3), 119.999 (H3, B1, H2), 120.015 (H2, B1, H4)
- Bond Lengths (Å): 1.19264 (B1, H2), 1.19243 (B1, H3), 1.19276 (B1, H4)
- File Type: .log
- Calculation Type: FOPT
- Calculation Method: RB3LYP
- Basis set: 6-31G(d,p)
- Final Energy (au): -26.61532358
- Gradient (au): 0.00008206
- Dipole Moment (Debye): 0.0003
- Point Group: Cs
- Time of Calculation: 1 minute 34.0 seconds
Again, although the optimised structure does have D3h symmetry, when the above bond angles and bond lengths are rounded to 1 decimal place and 2 decimal places respectively, (the bond angles are all 120.0° and the bond lengths are 1.19 Å when this approximation is made), D3h symmetry is obtained. Below is a section from the output file which confirms that the forces and displacements have converged, and hence the optimisation has worked and a minimum has been located.
         Item               Value     Threshold  Converged?
 Maximum Force            0.000204     0.000450     YES
 RMS     Force            0.000099     0.000300     YES
 Maximum Displacement     0.000875     0.001800     YES
 RMS     Displacement     0.000418     0.001200     YES
 Predicted change in Energy=-1.452109D-07
 Optimization completed.
    -- Stationary point found.
                           ----------------------------
                           !   Optimized Parameters   !
                           ! (Angstroms and Degrees)  !
 --------------------------                            --------------------------
 ! Name  Definition              Value          Derivative Info.                !
 --------------------------------------------------------------------------------
 ! R1    R(1,2)                  1.1926         -DE/DX =   -0.0002              !
 ! R2    R(1,3)                  1.1924         -DE/DX =    0.0                 !
 ! R3    R(1,4)                  1.1928         -DE/DX =   -0.0002              !
 ! A1    A(2,1,3)              119.9988         -DE/DX =    0.0                 !
 ! A2    A(2,1,4)              120.0146         -DE/DX =    0.0                 !
 ! A3    A(3,1,4)              119.9866         -DE/DX =    0.0                 !
 ! D1    D(2,1,4,3)            180.0            -DE/DX =    0.0                 !
 --------------------------------------------------------------------------------
 GradGradGradGradGradGradGradGradGradGradGradGradGradGradGradGradGradGrad
GaBr3 Optimisation
In order to calculate a fairly accurate optimisation for GaBr3, the point group D3h has been constrained using a very tight tolerance and the basis set used was the LanL2DZ set, (a better basis set could be used to calculate a more accurate optimisation, however this would increase the computation time). The .log output file from the optimisation can be found here, and below is the conformation that optimisation has found the energy minimum, showing also that the forces and displacements have converged. Furthermore, a summary of the calculation results and details are presented below in a list.
         Item               Value     Threshold  Converged?
 Maximum Force            0.000000     0.000450     YES
 RMS     Force            0.000000     0.000300     YES
 Maximum Displacement     0.000003     0.001800     YES
 RMS     Displacement     0.000002     0.001200     YES
 Predicted change in Energy=-1.282681D-12
 Optimization completed.
    -- Stationary point found.
                           ----------------------------
                           !   Optimized Parameters   !
                           ! (Angstroms and Degrees)  !
 --------------------------                            --------------------------
 ! Name  Definition              Value          Derivative Info.                !
 --------------------------------------------------------------------------------
 ! R1    R(1,2)                  2.3502         -DE/DX =    0.0                 !
 ! R2    R(1,3)                  2.3502         -DE/DX =    0.0                 !
 ! R3    R(1,4)                  2.3502         -DE/DX =    0.0                 !
 ! A1    A(2,1,3)              120.0            -DE/DX =    0.0                 !
 ! A2    A(2,1,4)              120.0            -DE/DX =    0.0                 !
 ! A3    A(3,1,4)              120.0            -DE/DX =    0.0                 !
 ! D1    D(2,1,4,3)            180.0            -DE/DX =    0.0                 !
 --------------------------------------------------------------------------------
 GradGradGradGradGradGradGradGradGradGradGradGradGradGradGradGradGradGrad
- Bond Angles (°): 120.000 (Br4, Ga1, Br3), 120.000 (Br3, Ga1, Br2), 120.000 (Br2, Ga1, Br4)
- Bond Lengths (Å): 2.35018 (Ga1, Br2), 2.35018 (Ga1, Br3), 2.35018 (Ga1, Br4)
- File Type: .log
- Calculation Type: FOPT
- Calculation Method: RB3LYP
- Basis set: LANL2DZ
- Final Energy (au): -41.70082783
- Gradient (au): 0.00000016
- Dipole Moment (Debye): 0.0000
- Point Group: D3h
- Time of Calculation: 27.6 seconds
- D-Space link: DOI:10042/27223
The average computed bond length of GaBr3 2.35 Å is in fairly good agreement with the literature value of 2.304 Å,[1] which utilised a B3LYP/LANL2DZP method, indicating that using a more complex basis set for computational calculations yields results which have better agreement with the experimental determined bond length of 2.246 ± 0.003 Å.
BBr3 Computation
As boron tribromide contains both a light boron atom and heavy bromine atoms, the basis sets for all the atoms present in the molecule needs to be specified and a pseudo-potential needs to be applied to the bromine atoms in order to accurately optimise the structure. For this calculation, a 6-31G(d,p) basis set was applied to the boron atom whereas the LanL2DZ pseudo-potential was used in the optimisation for the bromine atoms. The .log output file for the optimisation of a BBr3 molecule is presented here and below is the conformation that the forces and displacements have converged and the optimisation was sucessful.
Item               Value     Threshold  Converged?
 Maximum Force            0.000016     0.000450     YES
 RMS     Force            0.000010     0.000300     YES
 Maximum Displacement     0.000067     0.001800     YES
 RMS     Displacement     0.000040     0.001200     YES
 Predicted change in Energy=-1.574159D-09
 Optimization completed.
    -- Stationary point found.
                           ----------------------------
                           !   Optimized Parameters   !
                           ! (Angstroms and Degrees)  !
 --------------------------                            --------------------------
 ! Name  Definition              Value          Derivative Info.                !
 --------------------------------------------------------------------------------
 ! R1    R(1,2)                  1.934          -DE/DX =    0.0                 !
 ! R2    R(1,3)                  1.9339         -DE/DX =    0.0                 !
 ! R3    R(1,4)                  1.934          -DE/DX =    0.0                 !
 ! A1    A(2,1,3)              120.0018         -DE/DX =    0.0                 !
 ! A2    A(2,1,4)              119.9971         -DE/DX =    0.0                 !
 ! A3    A(3,1,4)              120.0011         -DE/DX =    0.0                 !
 ! D1    D(2,1,4,3)            180.0            -DE/DX =    0.0                 !
 --------------------------------------------------------------------------------
 GradGradGradGradGradGradGradGradGradGradGradGradGradGradGradGradGradGrad
A summary of the calculation and data obtained is presented below. Again, the expected D3h point group has not been specified by the calculation, however it is visible from the bond length and angle data that up to a certain accuracy (2 decimal places for bond lengths and 2 decimal place for the bond angle) that the calculation does correspond to the ideal D3h point group.
- Bond Angles (°): 120.001 (Br4, B1, Br3), 120.002 (Br3, B1, Br2), 119.997 (Br2, B1, Br4)
- Bond Lengths (Å): 1.93398 (B1, Br2), 1.93391 (B1, Br3), 1.93400 (B1, Br4)
- File Type: .log
- Calculation Type: FOPT
- Calculation Method: RB3LYP
- Basis set: Gen
- Final Energy (au): -64.43645388
- Gradient (au):0.00000943
- Dipole Moment (Debye): 0.0005
- Point Group: Cs
- Time of Calculation: 38.7 seconds
- D-Space Link: DOI:10042/27222
Structural Comparison
| Bond Lengths (Å) | |||
|---|---|---|---|
| BH3 | BBr3 | GaBr3 | |
| Atom 1 - 2 | 1.19 | 1.93 | 2.35 |
| Atom 1 - 3 | 1.19 | 1.93 | 2.35 |
| Atom 1 - 4 | 1.19 | 1.93 | 2.35 |
Many trends are apparent from the computed data of group 3 hydrides and bromides. Firstly, when the ligand is changed from Hydrogen to Bromine, the Boron-ligand bond length increases. Likewise, as you descend the group from Boron to Gallium, it can be observed that the bond length between the central group 3 element and the Bromine atom increases.Initially, it can be thought that when changing the ligand from Hydrogen to Bromine, the orbitals of the ligand become larger and more diffuse, which result in a poorer overlap between orbitals on the central boron atom. This less efficient overlap results in longer and hence weaker bonds between the Boron and Bromine atoms relative to the bonds between Bromine and Hydrogen. Likewise, as you descend group 3, the orbitals of the central atom become larger and more diffuse, again leading to a poorer overlap with the Bromine's orbitals, once more resulting in longer and weaker bonds.
The electronic structure of both Hydrogen and Bromine are similar as they both are one valence electron short of obtaining a full shell of electrons surrounding the nucleus, in other words, both atoms contain one unpaired electron. Conversely, there is a notable mass difference between Hydrogen and Bromine, which leads to the heavier bromine atom possessing a larger atomic radius and more electrons, therefore, the bromine atom contains far more filled electronic orbitals. Additionally, the atoms in question use different orbitals when bonding; the 1s orbital in hydrogen and the 4p orbital in bromine are used for forming bonds. Furthermore, Bromine is a more electronegative atom than Hydrogen, possessing a Pauling electronegativity of 2.96 and 2.20 respectively[2]. This means that when bonded to Boron, Bromine atoms withdraw electron density from the central Boron atom to a greater extent than Hydrogen atoms do (Pauling electronegativity of Boron is 2.04). This results in the Boron atom in BBr3 possessing far less electron density than the Boron atom in BH3, resulting in unoccupied p orbital becoming more lewis acidic, making BBr3 a better lewis acid than BH3.
Boron and Gallium both contain 3 valence electrons which bond via 3 sp2 hybridized orbitals, leaving an unoccupied (non-hybridized) p orbital which can accept a pair of electrons. These compounds are electron deficient, with the central atom only containing 6 valence electrons, hence BX3 and GaX3 compounds act as lewis acids, and can accept a pair of electrons in order to complete the octet. Again, an obvious difference between these two atoms is the mass difference, which leads to Gallium possessing more electrons and thus, uses hybridization of the 4s and 4p electrons for bonding, whereas Boron utilises the 2s and 2p electrons for hybridization and bonding. Furthermore, Gallium is more electropositive compared to Boron, which have a Pauling electronegativity of 1.81 and 2.04 respectively. This results in Gallium trihalides possessing less electron density around the central atom in the compound compared to the equivalent Boron analogues, resulting in Gallium trihalides being more lewis acidic than boron compounds towards soft lewis bases (this trend is reversed however when using a hard lewis base).
Frequency Analysis of BH3
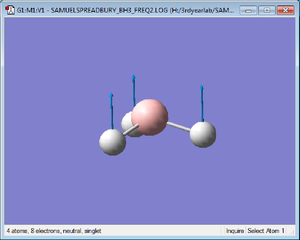
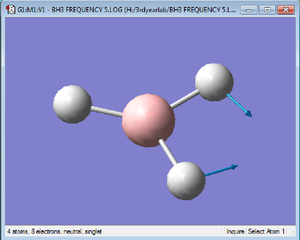
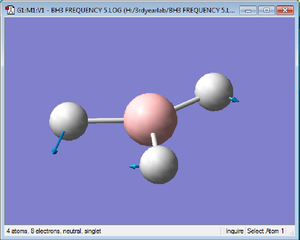
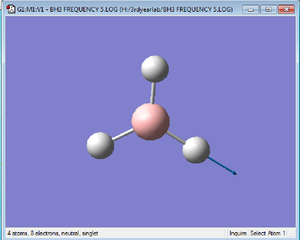
By carrying out a frequency (or vibrational) analysis, it can be confirmed that the minimum energy structure has been calculated, in addition to computationally realising the optimum structure. The previously calculated optimisation for BH3 has been used in this frequency analysis to determine if the previously reported data was accurate. The Gaussian .log output file for the analysis can be found here and below is a summary of the calculation parameters and results.
- File Type: .log
- Calculation Type: FREQ
- Calculation Method: RB3LYP
- Basis set: 6-31G(d,p)
- Final Energy (au): -26.61532358
- Gradient (au):0.00008202
- Dipole Moment (Debye): 0.0003
- Point Group: Cs
- Time of Calculation: 13.0 seconds
Additionally, a copy of the low frequencies section of the output is included below, for which the first 6 recorded vibrations detail motions about the center of mass of the molecule, which should naturally be around zero (also known as zero frequencies). The more accurate the method which is employed in the optimisation and frequency analysis, the closer these zero frequencies will be to zero.
Low frequencies ---   -0.0009    0.0003    0.0008   33.8606   41.5989   43.7038
Low frequencies --- 1163.5023 1213.4686 1213.5878
Three of the obtained zero frequencies are out of the ±15 cm-1 range, hence the optimisation of BH3 needs to be recalculated. This subsequent calculation will be carried out specifying the point group of D3h of the BH3 unit when defining the molecule and applying a very tight tolerance, then carry out an optimisation, which can then have a frequency analysis undertaken. A copy of the optimisation .log output file can be found here. Presented below is a summary of the calculation undertaken, in addition to proof that the optimisation has been successful and the forces and displacements have converged.
- File Type: .log
- Calculation Type: FOTP
- Calculation Method: RB3LYP
- Basis set: 6-31G(d,p)
- Final Energy (au): -26.61511227
- Gradient (au):0.00305321
- Dipole Moment (Debye): 0.0000
- Point Group: D3h
- Time of Calculation: 18.0 seconds
         Item               Value     Threshold  Converged?
 Maximum Force            0.000006     0.000450     YES
 RMS     Force            0.000004     0.000300     YES
 Maximum Displacement     0.000023     0.001800     YES
 RMS     Displacement     0.000015     0.001200     YES
 Predicted change in Energy=-2.008834D-10
 Optimization completed.
    -- Stationary point found.
                           ----------------------------
                           !   Optimized Parameters   !
                           ! (Angstroms and Degrees)  !
 --------------------------                            --------------------------
 ! Name  Definition              Value          Derivative Info.                !
 --------------------------------------------------------------------------------
 ! R1    R(1,2)                  1.1923         -DE/DX =    0.0                 !
 ! R2    R(1,3)                  1.1923         -DE/DX =    0.0                 !
 ! R3    R(1,4)                  1.1923         -DE/DX =    0.0                 !
 ! A1    A(2,1,3)              120.0            -DE/DX =    0.0                 !
 ! A2    A(2,1,4)              120.0            -DE/DX =    0.0                 !
 ! A3    A(3,1,4)              120.0            -DE/DX =    0.0                 !
 ! D1    D(2,1,4,3)            180.0            -DE/DX =    0.0                 !
 --------------------------------------------------------------------------------
 GradGradGradGradGradGradGradGradGradGradGradGradGradGradGradGradGradGrad
Subsequently, the frequency analysis was undertaken on the newly optimised BH3 and a copy of the frequency analysis output can be found here. Below is a summary of the frequency analysis and a copy of the low frequencies section of the output.
- File Type: .log
- Calculation Type: FREQ
- Calculation Method: RB3LYP
- Basis set: 6-31G(d,p)
- Final Energy (au): -26.61532363
- Gradient (au):0.00000291
- Dipole Moment (Debye): 0.0000
- Point Group: D3h
- Time of Calculation: 13.0 seconds
Low frequencies ---   -0.9432   -0.8611   -0.0055    5.7455   11.7246   11.7625
Low frequencies --- 1162.9963 1213.1826 1213.1853
The recalculated low frequencies indicate that the zero frequencies are now within the expected limit of ±15 cm-1, hence the calculation can be taken as being accurate.
Vibrations come to life
Although by completing a frequency analysis it is possible to visualise the molecular vibrations, a perhaps more useful result this calculation yields is the ability to predict the infrared spectrum of a molecule. Presented below is the computed IR spectrum of BBr3.

Comparing the above table and IR spectrum, it is apparent that not all of the 6 molecular vibrations contribute towards appearing in the molecule's IR spectrum. Vibration 4 is a totally symmetric stretch, hence there is no change in dipole moment of the molecule. It is a selection rule for IR transitions that there must be a change in dipole moment during the vibration in order to be IR active[3], therefore as there is no change in overall dipole from this vibration, it does not appear in the IR spectrum. Furthermore, vibrations 2 and 3 are degenerate vibrations and appear at the same frequency, hence only contribute to a single peak in the IR spectrum. The same applies to vibrations vibrations 5 and 6, which appear at the same frequency and are also degenerate vibrations. Therefore, only three peaks are visible in the IR spectrum of BH3.
GaBr3 Frequency Analysis
Using the previously computed structural optimisation of GaBr3, a vibrational frequency analysis has been undertaken. The output file for the completed frequency analysis can be found here. A summary of the frequency analysis calculation and a copy of the low frequencies section of the results are illustrated below:
- File Type: .log
- Calculation Type: FREQ
- Calculation Method: RB3LYP
- Basis set: LANL2DZ
- Final Energy (au): -41.70082783
- Gradient (au):0.00000011
- Dipole Moment (Debye): 0.0000
- Point Group: D3h
- Time of Calculation: 18.3 seconds
- D-Space Link: DOI:10042/27224
Low frequencies ---   -0.5252   -0.5247   -0.0024   -0.0010    0.0235    1.2010
Low frequencies ---   76.3744   76.3753   99.6982
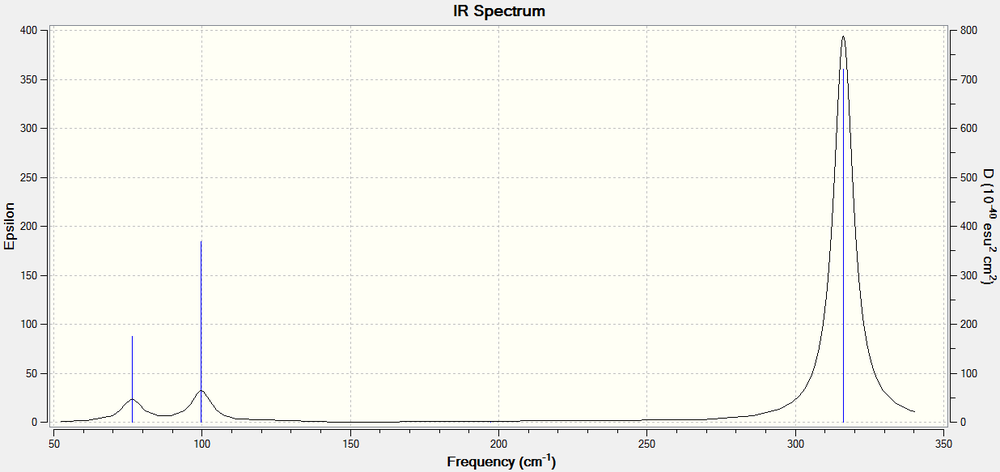
It is apparant from the six zero frequencies that the calculation has found the energy minimum as all the presented frequencies are well within the ideal range of ±15 cm-1. The lowest "real" frequency calculated has E' symmetry and occurs at 76.3744 cm-1. Furthermore, the computed IR Spectrum of GaBr3 and a table comparing the vibrational frequencies of BH3 and GaBr3 is presented below:
| Vibrational Symmetry (D3h point group) | BH3 | GaBr3 | ||
| Frequency (cm-1) | Intensity | Frequency (cm-1) | Intensity | |
| A2" | 1163 | 93 | 100 | 9 |
| E' | 1213 | 14 | 76 | 3 |
| E' | 1213 | 14 | 76 | 3 |
| A1' | 2582 | 0 | 197 | 0 |
| E' | 2715 | 126 | 316 | 57 |
| E' | 2715 | 126 | 316 | 57 |
When comparing the results from the vibrational analysis of BH3 and GaBr3, it is clear that there are both distinct similarities and differences between the calculated data. Perhaps the most obvious difference is the substantial difference in frequencies for BH3 and GaBr3 when comparing identical vibrational symmetries. This 10-fold difference in vibrational frequencies therefore indicates that BH3, whose vibrational frequencies are greater, contains stronger bonds than GaBr3; this results from the force constant of a bond being directly proportional to wavenumbers (or vibrational frequencies) and inversely proportional to the reduced mass (BH3 has a lower reduced mass than GaBr3. This can be further understood when comparing the orbital overlap between bonding atoms in the respective molecules. Boron uses 3 small and contracted sp2 hybridized orbitals (formed from the electrons in the 2s and 2p electronic orbitals), which have a strong positive overlap with the small, core-like 1s orbitals of the hydrogen ligands, resulting in strong B-H bonds. Similarly, Gallium uses 3 sp2 hybridized orbitals for bonding, however these orbitals are formed by the hybridization of the 4s and 4p orbitals, which are much larger and diffuse than electrons with smaller principle quantum numbers. Further to this, Bromine atoms facilitate bonding via the 4p electrons, which as previously stated, are large and diffuse. When Gallium bonds to Bromine, the resulting orbital overlap is poor compared to the orbital overlap found in BH3 due to the diffusivity of the constituent orbitals, hence weaker bonds form between Gallium and Bromine, resulting in a lower vibrational frequency.
The frequency analysis of GaBr3 illustrated that there has been a rearrangement of the vibrational modes compared to BH3, namely that in GaBr3, the lower energy degenerate E' vibrations are now lower in energy than the A2". When visualising the A2" vibration, it is clearly different from the A2" vibration of BH3, as the Gallium atom displays a much greater vibrational displacement along the z axis, while the Bromine atoms only have a small displacement when vibrating. This is exactly the opposite to what is observed in the A2" vibration, which displays a larger displacement for the Hydrogen atoms compared to the Boron atom. This could indicate that more energy is required to cause a large vibration of the central, more bonded atom than the outer ligand atoms, therefore, this causes a reshuffling of the ordering of the E' and A2" vibrational modes observed in GaBr3.
The infrared spectra of these compounds are similar in multiple ways. Firstly, both spectra possess three peaks, which is expected upon analysis of the frequency analysis, as one vibration results in no change in overall dipole moment and there are two different sets of degenerate vibrations. Furthermore, the pattern of intensities for the peaks when comparing similar vibrational modes is identical upon comparison of the spectra, although the ratios of the intensities are not always identical when comparing the two spectra. Furthermore, it is apparent from the spectra that the A2" and E' modes lie close in energy, as do the A1' and E' modes, however these 2 modes lie significantly higher in energy than the other modes. This can be correlated to the type of vibrations that these frequencies represent. The lower energy A2" and E' modes represent bending frequencies, which typically are lower in energy than stretching vibrations. These stretching vibrations are represented by the higher frequency A1' and E' modes.
It is important to use the same method and basis set when undertaking an optimisation and subsequent frequency analysis of a molecule so to ensure that the in order to ensure that computed data, such as energies are calculated to the same degree of accuracy and is consistant, otherwise this could lead to incorrect data being calculated. Furthermore, when calculations are carried out using the same method and basis sets for different molecules, the computed data can be effectively used to compare structures and energies present in these molecules.
By carrying out a frequency analysis on a molecule, it can be confirmed that the global energy minimum of a molecule has been located by the computer programme, which is known when the "zero" low frequencies are all low (generally it can be considered accurate if the these frequencies fall into the range 0 ±15 cm-1). Moreover, a frequency analysis allows the molecular vibrations of a molecule to be visualised and assigned to a particular vibrational mode, in addition to allowing an IR spectrum, with key vibrational frequencies visualised, representing the pure molecule in the gas phase, to be generated. The low frequencies presented by the frequency analysis indicate the "-6" vibrations which can be calculated from the equation: 3N - 6.
Molecular orbitals of BH3
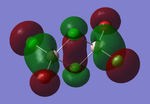
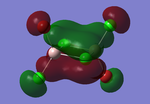
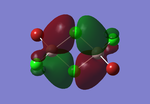
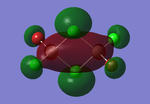
Using the newly optimised structure for BH3 described above in the Frequency Analysis of BH3 section, the molecular orbitals of BH3 can be computed and visualised. This was performed by opening the .chk file from the optimisation of BH3 and performing an energy calculation on the molecule. Likewise, a 6-31G(d,p) basis set was used and the key word "pop=full" was included, in order to allow molecular orbital determination. A link to the .log output file can be viewed here and the following list details information regarding the undertaken calculation.
- File Type: .chk
- Calculation Type: SP
- Calculation Method: RB3LYP
- Basis set: 6-31G(d,p)
- Final Energy (au): -26.61532363
- Gradient (au): 0.00000000
- Dipole Moment (Debye): 0.0000
- Time of Calculation: 2 minutes 14.0 seconds
The computed molecular orbitals can be compared to a LCAO (linear combination of atomic orbitals) approach, which can elude to the accuracy and usefulness of qualitative molecular orbital theory. The below diagram illustrates a Molecular Orbital diagram with both LCAO generated and computed MO's present.
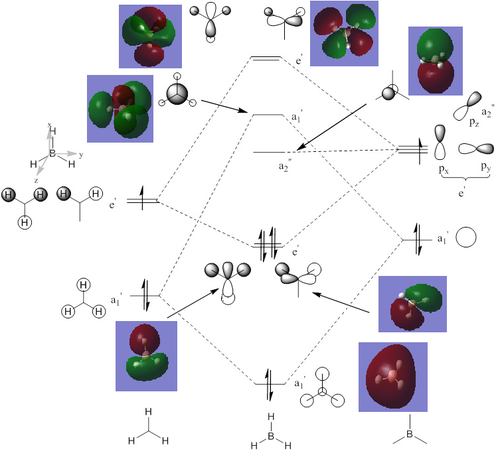
When comparing the computed and LCAO molecular orbitals, it is apparent that there are both astounding similarities and differences. An important observation is that for the occupied molecular orbitals, there is a remarkable similarity between the LCAO generated orbitals and the computed orbitals. On closer inspection, it can be seen that the computed MO's have the electron density spread out over the molecule, as opposed to remaining in the constituent atomic orbitals, which have been used to build the MO's in LCAO methods. On inspection of the unoccupied molecular orbitals, it is perhaps more obvious that the electron density from the computational analysis is more diffuse comapred to the LCAO approach. Additionally, an important difference is that there are more nodes present in molecular orbitals constructed in an LCAO manner than what is displayed in the simulated molecular orbitals; this perhaps owes to the fact that in the LCAO approach, there is no mixing of the orbitals, resulting in molecular orbitals which resemble the constituent atomic orbitals used to construct them.
The two highest energy orbitals displayed on the molecular orbital diagram are perhaps the most different when comparing the computed orbitals to the LCAO orbitals. The MO displayed in the top left of the MO diagram shows that the computed orbitals are more mixed, with a greater spread of electron density across the whole molecule compared to the LCAO molecular orbital. Also, where the LCAO MO illustrates overlap or close proximity atomic orbitals with different phases, the computed MO's illustrate that there appears to be a small node at this interface, with the orbitals which are in different phases repelling each other, forcing the MO's to point away from each other. Further to this, the MO presented in the top right corner of the diagram shows that the computed MO's show a much more pronounced node where there exists no electron density, in addition to orbitals of opposite phases being repelled more than what is predicted in the LCAO diagram. On the whole, the LCAO approach has illustrated that it can be highly accurate for the prediction of a molecular orbital, owing to the fact that the LCAO orbitals closely resemble computed occupied molecular orbitals and even has good resemblance to unoccupied molecular orbitals, therefore is a very useful method for qualitative molecular orbital theory.
NBO Analysis of NH3
In ordert to attempt a NBO analysis on ammonia, the structure of a molecule of ammonia was optimised specifying the "nosymm" keyword, and the .log output file for the optimisation can be viewed here. The list below details information regarding the calculation and further below is a copy of the section of the output file which confirms that the forces and displacements have converged and that the optimisation has been successful in finding a minimum.
- File Type: .log
- Calculation Type: FOTP
- Calculation Method: RB3LYP
- Basis set: 6-31G(d,p)
- Final Energy (au): -56.55776856
- Gradient (au):0.00000885
- Dipole Moment (Debye): 1.8464
- Time of Calculation: 13.0 seconds
- Point Group: C1
         Item               Value     Threshold  Converged?
 Maximum Force            0.000024     0.000450     YES
 RMS     Force            0.000012     0.000300     YES
 Maximum Displacement     0.000079     0.001800     YES
 RMS     Displacement     0.000053     0.001200     YES
 Predicted change in Energy=-1.629712D-09
 Optimization completed.
    -- Stationary point found.
                           ----------------------------
                           !   Optimized Parameters   !
                           ! (Angstroms and Degrees)  !
 --------------------------                            --------------------------
 ! Name  Definition              Value          Derivative Info.                !
 --------------------------------------------------------------------------------
 ! R1    R(1,2)                  1.018          -DE/DX =    0.0                 !
 ! R2    R(1,3)                  1.018          -DE/DX =    0.0                 !
 ! R3    R(1,4)                  1.018          -DE/DX =    0.0                 !
 ! A1    A(2,1,3)              105.7413         -DE/DX =    0.0                 !
 ! A2    A(2,1,4)              105.7486         -DE/DX =    0.0                 !
 ! A3    A(3,1,4)              105.7479         -DE/DX =    0.0                 !
 ! D1    D(2,1,4,3)           -111.8631         -DE/DX =    0.0                 !
 --------------------------------------------------------------------------------
 GradGradGradGradGradGradGradGradGradGradGradGradGradGradGradGradGradGrad
A subsequent frequency analysis was undertaken on the optimsed structure, (the output file of which can be viewed here, the list of the calculation summary is presented below) however the low frequency analysis (also presented below) was indicative of an incorrect calculation, as 3/6 of the low frequencies were clearly out of the optimum ±15 cm-1 about 0 range.
- File Type: .log
- Calculation Type: FREQ
- Calculation Method: RB3LYP
- Basis set: 6-31G(d,p)
- Final Energy (au): -56.55776856
- Gradient (au):0.00000885
- Dipole Moment (Debye): 1.8464
- Time of Calculation: 6.0 seconds
- Point Group: C1
Low frequencies ---  -30.8045   -0.0018    0.0009    0.0012   20.2188   28.2150
Low frequencies --- 1089.5530 1694.1235 1694.1861
Hence, the optimisation for a NH3 molecule needed to be repeated, however on this calculation, the keyword "opt=vtight int=ultrafine" was specified, which allows for a more accurate optimisation, which yielded the correct point group of C3v. The output file for the new optimisation can be found here and presented below is evidence of convergence of the optimisation, as well as a summary list of data the optimisation yielded.
- File Type: .log
- Calculation Type: FOTP
- Calculation Method: RB3LYP
- Basis set: 6-31G(d,p)
- Final Energy (au): -56.55776873
- Gradient (au):0.00000045
- Dipole Moment (Debye): 1.8465
- Time of Calculation: 16.0 seconds
- Point Group: C3v
         Item               Value     Threshold  Converged?
 Maximum Force            0.000001     0.000002     YES
 RMS     Force            0.000001     0.000001     YES
 Maximum Displacement     0.000002     0.000006     YES
 RMS     Displacement     0.000001     0.000004     YES
 Predicted change in Energy=-2.358780D-12
 Optimization completed.
    -- Stationary point found.
                           ----------------------------
                           !   Optimized Parameters   !
                           ! (Angstroms and Degrees)  !
 --------------------------                            --------------------------
 ! Name  Definition              Value          Derivative Info.                !
 --------------------------------------------------------------------------------
 ! R1    R(1,2)                  1.018          -DE/DX =    0.0                 !
 ! R2    R(1,3)                  1.018          -DE/DX =    0.0                 !
 ! R3    R(1,4)                  1.018          -DE/DX =    0.0                 !
 ! A1    A(2,1,3)              105.7445         -DE/DX =    0.0                 !
 ! A2    A(2,1,4)              105.7445         -DE/DX =    0.0                 !
 ! A3    A(3,1,4)              105.7445         -DE/DX =    0.0                 !
 ! D1    D(2,1,4,3)           -111.8635         -DE/DX =    0.0                 !
 --------------------------------------------------------------------------------
 GradGradGradGradGradGradGradGradGradGradGradGradGradGradGradGradGradGrad
Subsequently, a frequency analysis of this optimised C3v structure was performed (an output file can be found here, the calculation summary is presented in a list below) and the low frequencies (also shown below) now are all low and within the preferred range of ± 15 cm-1 about 0.
- File Type: .log
- Calculation Type: FREQ
- Calculation Method: RB3LYP
- Basis set: 6-31G(d,p)
- Final Energy (au): -56.55776872
- Gradient (au):0.00000054
- Dipole Moment (Debye): 1.8465
- Time of Calculation: 6.0 seconds
- Point Group: C3v
Low frequencies ---   -4.3274   -0.8327   -0.8296   -0.0013    0.0197    0.0249
Low frequencies --- 1089.3663 1693.9295 1693.9296
Now that a minimum has been confirmed, the optimised structure can be used in a population analysis for NH3; the output file for the calculation can be viewed here.
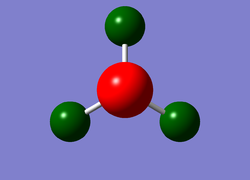
A colourful depiction of the charge distribution on the ammonia molecule can be viewed below, which ranges between -1.125 for a bright red colour, (indicating a highly negatively charged area), and +1.125 for a bright green, (indicating low electron density). The specific NBO charge associated with the central nitrogen atom is -1.125 and all 3 hydrogen atoms present in the molecule have a specific NBO charge of 0.375. This information can also be found upon inspection of the output file; a copy of this section is included below the charge distribution diagram.
Summary of Natural Population Analysis:

                                       Natural Population
                Natural  -----------------------------------------------
    Atom  No    Charge         Core      Valence    Rydberg      Total
 -----------------------------------------------------------------------
      N    1   -1.12514      1.99982     6.11103    0.01429     8.12514
      H    2    0.37505      0.00000     0.62250    0.00246     0.62495
      H    3    0.37505      0.00000     0.62250    0.00246     0.62495
      H    4    0.37505      0.00000     0.62250    0.00246     0.62495
 =======================================================================
   * Total *    0.00000      1.99982     7.97852    0.02166    10.00000
In addition to detailing information regarding the atomic charges present, an NBO analysis can yield information including: details of interactions and mixing between molecular orbitals, occupancy and relative energies of molecular orbitals. A copy of the Natural Bond Orbitals section of the output is shown below, which illustrates how the output file presents the occupancy and relative energies of electrons within molecular orbitals. From this, is can be seen that the core 1s electrons of the Nitrogen atom are far too low in energy to be involved in bonding. Moreover, this shows that the Nitrogen lone pair is higher in energy that the electrons constituting the Nitrogen - Hydrogen bonds, therefore an idea of reactivity can be derived from these analyses.
Natural Bond Orbitals (Summary):

                                                            Principal Delocalizations
           NBO                        Occupancy    Energy   (geminal,vicinal,remote)
 ====================================================================================
 Molecular unit  1  (H3N)
     1. BD (   1) N   1 - H   2          1.99909    -0.60417
     2. BD (   1) N   1 - H   3          1.99909    -0.60417
     3. BD (   1) N   1 - H   4          1.99909    -0.60417
     4. CR (   1) N   1                  1.99982   -14.16768
     5. LP (   1) N   1                  1.99721    -0.31757
Association Energy of Ammonia Borane
Ammonia Borane is a compound which has the potential to revolutionise the Hydrogen economy as a safe storage method for Hydrogen, owing to its stability at room temperature, in addition to its naturally high Hydrogen content. Furthermore, as the ammonia molecule formally donates two electrons to the unoccupied p orbital of borane, forming a dative bond, it can be assigned as a lewis acid/base complex. In order to determine the association energy of this formation, the energies of the constituent and final molecules need to be calculated and compared. Fortunately, the energies for the reactants, (or constituent molecules), have already been calculated and are presented above in various sections. Therefore, for a molecule of ammonia borane, an optimisatin was undertaken, (a copy of the output file can be found here), and a summary of the calculated results, as well as proof of convergence, are presented below.
- File Type: .log
- Calculation Type: FOTP
- Calculation Method: RB3LYP
- Basis set: 6-31G(d,p)
- Final Energy (au): -83.22468909
- Gradient (au):0.00000033
- Dipole Moment (Debye): 5.5646
- Time of Calculation: 1 minute 10.0 seconds
- Point Group: C1
         Item               Value     Threshold  Converged?
 Maximum Force            0.000001     0.000002     YES
 RMS     Force            0.000000     0.000001     YES
 Maximum Displacement     0.000005     0.000006     YES
 RMS     Displacement     0.000002     0.000004     YES
 Predicted change in Energy=-3.784929D-12
 Optimization completed.
    -- Stationary point found.
                           ----------------------------
                           !   Optimized Parameters   !
                           ! (Angstroms and Degrees)  !
 --------------------------                            --------------------------
 ! Name  Definition              Value          Derivative Info.                !
 --------------------------------------------------------------------------------
 ! R1    R(1,8)                  1.0185         -DE/DX =    0.0                 !
 ! R2    R(2,8)                  1.0185         -DE/DX =    0.0                 !
 ! R3    R(3,8)                  1.0185         -DE/DX =    0.0                 !
 ! R4    R(4,7)                  1.2098         -DE/DX =    0.0                 !
 ! R5    R(5,7)                  1.2098         -DE/DX =    0.0                 !
 ! R6    R(6,7)                  1.2098         -DE/DX =    0.0                 !
 ! R7    R(7,8)                  1.6677         -DE/DX =    0.0                 !
 ! A1    A(4,7,5)              113.8738         -DE/DX =    0.0                 !
 ! A2    A(4,7,6)              113.8737         -DE/DX =    0.0                 !
 ! A3    A(4,7,8)              104.5974         -DE/DX =    0.0                 !
 ! A4    A(5,7,6)              113.8738         -DE/DX =    0.0                 !
 ! A5    A(5,7,8)              104.5975         -DE/DX =    0.0                 !
 ! A6    A(6,7,8)              104.5976         -DE/DX =    0.0                 !
 ! A7    A(1,8,2)              107.8759         -DE/DX =    0.0                 !
 ! A8    A(1,8,3)              107.8759         -DE/DX =    0.0                 !
 ! A9    A(1,8,7)              111.0231         -DE/DX =    0.0                 !
 ! A10   A(2,8,3)              107.8759         -DE/DX =    0.0                 !
 ! A11   A(2,8,7)              111.023          -DE/DX =    0.0                 !
 ! A12   A(3,8,7)              111.0229         -DE/DX =    0.0                 !
 ! D1    D(4,7,8,1)            179.9998         -DE/DX =    0.0                 !
 ! D2    D(4,7,8,2)            -60.0002         -DE/DX =    0.0                 !
 ! D3    D(4,7,8,3)             59.9998         -DE/DX =    0.0                 !
 ! D4    D(5,7,8,1)            -60.0002         -DE/DX =    0.0                 !
 ! D5    D(5,7,8,2)             59.9998         -DE/DX =    0.0                 !
 ! D6    D(5,7,8,3)            179.9998         -DE/DX =    0.0                 !
 ! D7    D(6,7,8,1)             59.9998         -DE/DX =    0.0                 !
 ! D8    D(6,7,8,2)            179.9999         -DE/DX =    0.0                 !
 ! D9    D(6,7,8,3)            -60.0001         -DE/DX =    0.0                 !
 --------------------------------------------------------------------------------
 GradGradGradGradGradGradGradGradGradGradGradGradGradGradGradGradGradGrad
Akin to previous calculations, a frequency analysis calculation has been undertaken on the optimised NH3BH3 to confirm that the optimisation found the structure of minimum energy; a copy of the output file can be found here. Below is a summary of the persormed calculation in addition to a copy of the low frequencies, which are within the ±15 cm-1 about 0 range and show no negative frequencies in the second row of frequencies.
- File Type: .log
- Calculation Type: FREQ
- Calculation Method: RB3LYP
- Basis set: 6-31G(d,p)
- Final Energy (au): -83.22468910
- Gradient (au):0.00000029
- Dipole Moment (Debye): 5.5646
- Time of Calculation: 29.0 seconds
- Point Group: C1
Low frequencies ---   -3.1637   -0.0006    0.0006    0.0006    2.3361    4.8865
Low frequencies ---  263.4567  632.9790  638.4413
The following calculation details how the association energy for ammonia borane was calculated and the result is presented below:
E(NH3) = -56.55776872 au
E(BH3) = -26.61532363 au
E(NH3BH3) = -83.22468910 au
ΔE = E(NH3BH3) - [E(NH3) + E(BH3)]
ΔE = -0.05159675 au
ΔE = -135.467267125 KJmol-1
ΔE = -135.48 KJmol-1
The above calculated ΔE presents the association energy for ammonia borane, hence the calculation needs to be reversed in order to attain the dissociation energy. In this case, it is possible to just take the negative of the association energy, which yields the dissociation energy to be 135.48 KJmol-1. As this computed dissociation energy is positive, it can be concluded that dissociation is energetically unfavourable. A key analysis in computational chemistry is to consider whether the calculated dissociation energy is a sensible value. In this case, the obtained energy can be considered a sensible value, as many single bonds between hetero-atoms have similar bond dissociation energies (in other words, have bond energies in the 100's KJmol-1). Another key concept in computational chemistry is knowing what a sensible result looks like. As said above, single bond energies are in the order of 100's KJmol-1, therefore if a computed dissociation energy give a result correlating to, for example, 1-10 Jmol-1, it is key to identify that this could be incorrect and check the inputted data that was submitted for the calculation. Perhaps another method to determine whether a computed bond energy is sensible is to compare with similar compounds found in literature, both experimentally calculated and computer calculated data, which can be an indicator to a "ballpark" figure and perhaps indicate an accuracy of the calculation.
Accuracy of Reported Data
An important detail to consider during computational chemistry is the error associated with calculated values. An energy will typically have an error of ±10 KJmol-1, which corresponds to an error of ±0.0038088 hartrees. Therefore, in calculations working out association/dissociation energies undertaken using the computed results, the answer has been round to 2 decimal places, however the in the summary of each calculation, energies have been reported in their entirety. Furthermore, bond lengths and angles have been reported to their entirety in the summary of each calculation, however have been suitable rounded to 2 decimal places and 1 decimal place respectively due to error associated with these results. Finally, when making comparisons between computed molecular systems, it is important that these systems must be calculated using exactly the same conditions, (for example; method, basis set and pseudo-potentials), and contain the same number and type of atoms, in order to make useful comparisons.
Lewis Acid and Base Mini Project
It is the aim of this project that the energies, molecular vibrations and the molecular orbitals of different conformers of Al2Cl4Br2 will be investigated in order to determine the most stable isomer from a multitude of conformers.
Energies of Isomers of 2AlCl2Br
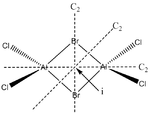
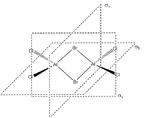
Firstly, in order to calculate the energies of the molecules under investigation, the particular symmetry point group of each possible isomer formed by the joining of two AlCl2Br monomers must be identified. The molecules 1 - 4 below indicate the structure, as well as the symmetry operations, which can be carried out on the isomer which can be used to determine the point group.
In order to optimise the structure of the above isomers, a mixture of basis sets and pseudo-potentials are required. An example for the general script for the optimisation can be found below, which illustrates that for the Aluminium and Chlorine atoms in the molecule, a 6-31G(d,p) basis set has been used, whereas the lanL2DZ pseudo-potential was used for bromine atoms present in the molecule.
# opt b3lyp/gen geom=connectivity pseudo=read gfinput

Al2Cl4Br2 D2h Optimisation

0 1
 Al                 0.69078950   -0.02192982    0.00000000
 Al                 2.01670550   -0.02192982    0.00000000
 Cl                -0.51987327    1.86271753    0.00000000
 Cl                -0.51994028   -1.90653413   -0.00004487
 Cl                 3.22743528    1.86267448    0.00005303
 Cl                 3.22736827   -1.90657718   -0.00003875
 Br                 1.29651207   -0.01885356    1.07913935
 Br                 1.38015936   -0.02491953   -1.05554246

 1 3 1.0 4 1.0 8 1.0 7 1.0
 2 5 1.0 6 1.0 7 1.0 8 1.0
 3
 4
 5
 6
 7
 8

Al Cl 0
6-31G(d,p)
****
Br 0
LanL2DZ
****

Br 0
LanL2DZ
An optimisation was carried out on all the conformers using the previously defined basis sets and pseudo-potentials and the results from these calculations are presented in the table below. The .log output file can be observed by clicking on the ".log" hyperlink under each molecule. For completeness, the section of the output file confirming that the forces and displacements have converged, indicating a successful optimisation, have been included below the table. For the C1 conformer, the copy from the output file however indicates that a first optimisation was terminated prior to finding a minimum energy structure for the isomer, thus has presented a partially optimsed structure. In order to realise the fully optimised structure, this partial optimisation shall be subject to an optimisation under the same conditions as the prior optimisation, therefore two calculations for this conformer appear in the table below.
| Molecule |  |
 |
 |
 | |
| File Type | .log | .log | .log | .log | .log |
| Calculation Type | FOTP | FOTP | FOTP | FOTP | FOTP |
| Calculation Method | RB3LYP | RB3LYP | RB3LYP | RB3LYP | RB3LYP |
| Basis set | Gen | Gen | Gen | Gen | Gen |
| Final Energy (au) | -2352.40630453 | -2352.41629723 | -2352.41626636 | -2352.41077138 | -2352.41109920 |
| Gradient (au) | 0.00018498 | 0.00009406 | 0.00007046 | 0.00174774 | 0.00006367 |
| Dipole Moment (Debye) | 0.0421 | 0.0286 | 0.1636 | 0.3905 | 0.1290 |
| Time of Calculation | 31 minutes 19.9 seconds | 25 minutes 31.4 seconds | 26 minutes 5.3 seconds | 27 minutes 42.5 seconds | 3 minutes 6.7 seconds |
| Point Group | C1 | C1 | C1 | C1 | C1 |
| D-Space link | DOI:10042/27216 | DOI:10042/27214 | DOI:10042/27215 | DOI:10042/27213 | DOI:10042/27174 |
D2h calculation convergence:
         Item               Value     Threshold  Converged?
 Maximum Force            0.000445     0.000450     YES
 RMS     Force            0.000108     0.000300     YES
 Maximum Displacement     0.001099     0.001800     YES
 RMS     Displacement     0.000343     0.001200     YES
 Predicted change in Energy=-6.993019D-08
 Optimization completed.
    -- Stationary point found.
                           ----------------------------
                           !   Optimized Parameters   !
                           ! (Angstroms and Degrees)  !
 --------------------------                            --------------------------
 ! Name  Definition              Value          Derivative Info.                !
 --------------------------------------------------------------------------------
 ! R1    R(1,3)                  2.0932         -DE/DX =    0.0                 !
 ! R2    R(1,4)                  2.0933         -DE/DX =    0.0                 !
 ! R3    R(1,7)                  2.4926         -DE/DX =   -0.0004              !
 ! R4    R(1,8)                  2.4908         -DE/DX =   -0.0001              !
 ! R5    R(2,5)                  2.0937         -DE/DX =    0.0                 !
 ! R6    R(2,6)                  2.0937         -DE/DX =    0.0                 !
 ! R7    R(2,7)                  2.489          -DE/DX =    0.0                 !
 ! R8    R(2,8)                  2.4851         -DE/DX =    0.0004              !
 ! A1    A(3,1,4)              121.798          -DE/DX =    0.0                 !
 ! A2    A(3,1,7)              109.823          -DE/DX =    0.0                 !
 ! A3    A(3,1,8)              109.8219         -DE/DX =    0.0                 !
 ! A4    A(4,1,7)              109.8157         -DE/DX =    0.0                 !
 ! A5    A(4,1,8)              109.808          -DE/DX =    0.0                 !
 ! A6    A(7,1,8)               91.6156         -DE/DX =    0.0001              !
 ! A7    A(5,2,6)              121.7032         -DE/DX =    0.0                 !
 ! A8    A(5,2,7)              109.8004         -DE/DX =    0.0                 !
 ! A9    A(5,2,8)              109.8025         -DE/DX =    0.0                 !
 ! A10   A(6,2,7)              109.8158         -DE/DX =    0.0                 !
 ! A11   A(6,2,8)              109.8085         -DE/DX =    0.0                 !
 ! A12   A(7,2,8)               91.8364         -DE/DX =   -0.0001              !
 ! A13   A(1,7,2)               88.2094         -DE/DX =    0.0001              !
 ! A14   A(1,8,2)               88.3386         -DE/DX =   -0.0001              !
 ! D1    D(3,1,7,2)           -111.7791         -DE/DX =    0.0                 !
 ! D2    D(4,1,7,2)            111.7305         -DE/DX =    0.0                 !
 ! D3    D(8,1,7,2)             -0.0162         -DE/DX =    0.0                 !
 ! D4    D(3,1,8,2)            111.7802         -DE/DX =    0.0                 !
 ! D5    D(4,1,8,2)           -111.7374         -DE/DX =    0.0                 !
 ! D6    D(7,1,8,2)              0.0162         -DE/DX =    0.0                 !
 ! D7    D(5,2,7,1)            111.8426         -DE/DX =    0.0                 !
 ! D8    D(6,2,7,1)           -111.8193         -DE/DX =    0.0                 !
 ! D9    D(8,2,7,1)              0.0162         -DE/DX =    0.0                 !
 ! D10   D(5,2,8,1)           -111.8407         -DE/DX =    0.0                 !
 ! D11   D(6,2,8,1)            111.8259         -DE/DX =    0.0                 !
 ! D12   D(7,2,8,1)             -0.0162         -DE/DX =    0.0                 !
 --------------------------------------------------------------------------------
 GradGradGradGradGradGradGradGradGradGradGradGradGradGradGradGradGradGrad
C2h calculation convergence:
         Item               Value     Threshold  Converged?
 Maximum Force            0.000205     0.000450     YES
 RMS     Force            0.000054     0.000300     YES
 Maximum Displacement     0.001391     0.001800     YES
 RMS     Displacement     0.000416     0.001200     YES
 Predicted change in Energy=-8.602119D-08
 Optimization completed.
    -- Stationary point found.
                           ----------------------------
                           !   Optimized Parameters   !
                           ! (Angstroms and Degrees)  !
 --------------------------                            --------------------------
 ! Name  Definition              Value          Derivative Info.                !
 --------------------------------------------------------------------------------
 ! R1    R(1,3)                  2.0939         -DE/DX =    0.0                 !
 ! R2    R(1,4)                  2.2749         -DE/DX =    0.0                 !
 ! R3    R(1,5)                  2.2974         -DE/DX =    0.0                 !
 ! R4    R(1,6)                  2.2969         -DE/DX =    0.0002              !
 ! R5    R(2,5)                  2.2999         -DE/DX =   -0.0002              !
 ! R6    R(2,6)                  2.2982         -DE/DX =    0.0                 !
 ! R7    R(2,7)                  2.0937         -DE/DX =    0.0                 !
 ! R8    R(2,8)                  2.2744         -DE/DX =    0.0                 !
 ! A1    A(3,1,4)              121.4302         -DE/DX =    0.0                 !
 ! A2    A(3,1,5)              109.856          -DE/DX =    0.0                 !
 ! A3    A(3,1,6)              109.8377         -DE/DX =    0.0                 !
 ! A4    A(4,1,5)              110.5772         -DE/DX =    0.0                 !
 ! A5    A(4,1,6)              110.5117         -DE/DX =    0.0                 !
 ! A6    A(5,1,6)               90.2143         -DE/DX =   -0.0001              !
 ! A7    A(5,2,6)               90.1197         -DE/DX =    0.0                 !
 ! A8    A(5,2,7)              109.8433         -DE/DX =    0.0                 !
 ! A9    A(5,2,8)              110.5017         -DE/DX =    0.0                 !
 ! A10   A(6,2,7)              109.8273         -DE/DX =    0.0                 !
 ! A11   A(6,2,8)              110.5182         -DE/DX =    0.0                 !
 ! A12   A(7,2,8)              121.5537         -DE/DX =    0.0                 !
 ! A13   A(1,5,2)               89.805          -DE/DX =    0.0                 !
 ! A14   A(1,6,2)               89.8585         -DE/DX =    0.0                 !
 ! D1    D(3,1,5,2)           -110.8546         -DE/DX =    0.0                 !
 ! D2    D(4,1,5,2)            112.445          -DE/DX =    0.0                 !
 ! D3    D(6,1,5,2)              0.3783         -DE/DX =    0.0                 !
 ! D4    D(3,1,6,2)            110.8713         -DE/DX =    0.0                 !
 ! D5    D(4,1,6,2)           -112.5057         -DE/DX =    0.0001              !
 ! D6    D(5,1,6,2)             -0.3786         -DE/DX =    0.0                 !
 ! D7    D(6,2,5,1)             -0.3781         -DE/DX =    0.0                 !
 ! D8    D(7,2,5,1)           -111.5613         -DE/DX =    0.0                 !
 ! D9    D(8,2,5,1)            111.6455         -DE/DX =    0.0                 !
 ! D10   D(5,2,6,1)              0.3782         -DE/DX =    0.0                 !
 ! D11   D(7,2,6,1)            111.5763         -DE/DX =    0.0                 !
 ! D12   D(8,2,6,1)           -111.6301         -DE/DX =    0.0                 !
 --------------------------------------------------------------------------------
 GradGradGradGradGradGradGradGradGradGradGradGradGradGradGradGradGradGrad
C2v calculation convergence:
         Item               Value     Threshold  Converged?
 Maximum Force            0.000157     0.000450     YES
 RMS     Force            0.000044     0.000300     YES
 Maximum Displacement     0.000708     0.001800     YES
 RMS     Displacement     0.000278     0.001200     YES
 Predicted change in Energy=-3.710831D-08
 Optimization completed.
    -- Stationary point found.
                           ----------------------------
                           !   Optimized Parameters   !
                           ! (Angstroms and Degrees)  !
 --------------------------                            --------------------------
 ! Name  Definition              Value          Derivative Info.                !
 --------------------------------------------------------------------------------
 ! R1    R(1,3)                  2.0939         -DE/DX =    0.0                 !
 ! R2    R(1,6)                  2.2746         -DE/DX =    0.0                 !
 ! R3    R(1,7)                  2.2977         -DE/DX =    0.0                 !
 ! R4    R(1,8)                  2.2971         -DE/DX =    0.0002              !
 ! R5    R(2,4)                  2.0938         -DE/DX =    0.0                 !
 ! R6    R(2,5)                  2.2746         -DE/DX =    0.0                 !
 ! R7    R(2,7)                  2.2994         -DE/DX =   -0.0002              !
 ! R8    R(2,8)                  2.2982         -DE/DX =    0.0                 !
 ! A1    A(3,1,6)              121.5025         -DE/DX =    0.0                 !
 ! A2    A(3,1,7)              109.8377         -DE/DX =    0.0                 !
 ! A3    A(3,1,8)              109.8278         -DE/DX =    0.0                 !
 ! A4    A(6,1,7)              110.5259         -DE/DX =    0.0                 !
 ! A5    A(6,1,8)              110.5211         -DE/DX =    0.0                 !
 ! A6    A(7,1,8)               90.1807         -DE/DX =    0.0                 !
 ! A7    A(4,2,5)              121.4845         -DE/DX =    0.0                 !
 ! A8    A(4,2,7)              109.8519         -DE/DX =    0.0                 !
 ! A9    A(4,2,8)              109.8454         -DE/DX =    0.0                 !
 ! A10   A(5,2,7)              110.5162         -DE/DX =    0.0                 !
 ! A11   A(5,2,8)              110.573          -DE/DX =   -0.0001              !
 ! A12   A(7,2,8)               90.1125         -DE/DX =    0.0                 !
 ! A13   A(1,7,2)               89.8288         -DE/DX =    0.0                 !
 ! A14   A(1,8,2)               89.8742         -DE/DX =    0.0                 !
 ! D1    D(3,1,7,2)           -110.7368         -DE/DX =    0.0                 !
 ! D2    D(6,1,7,2)            112.525          -DE/DX =    0.0                 !
 ! D3    D(8,1,7,2)              0.4698         -DE/DX =    0.0                 !
 ! D4    D(3,1,8,2)            110.7458         -DE/DX =    0.0                 !
 ! D5    D(6,1,8,2)           -112.5297         -DE/DX =    0.0                 !
 ! D6    D(7,1,8,2)             -0.4701         -DE/DX =    0.0                 !
 ! D7    D(4,2,7,1)            110.7315         -DE/DX =    0.0                 !
 ! D8    D(5,2,7,1)           -112.5516         -DE/DX =    0.0                 !
 ! D9    D(8,2,7,1)             -0.4696         -DE/DX =    0.0                 !
 ! D10   D(4,2,8,1)           -110.7374         -DE/DX =    0.0                 !
 ! D11   D(5,2,8,1)            112.4992         -DE/DX =    0.0                 !
 ! D12   D(7,2,8,1)              0.4697         -DE/DX =    0.0                 !
 --------------------------------------------------------------------------------
 GradGradGradGradGradGradGradGradGradGradGradGradGradGradGradGradGradGrad
C1 unoptimised calculation convergence:
         Item               Value     Threshold  Converged?
 Maximum Force            0.004961     0.000450     NO
 RMS     Force            0.001015     0.000300     NO
 Maximum Displacement     0.013852     0.001800     NO
 RMS     Displacement     0.004179     0.001200     NO
 Predicted change in Energy=-1.461195D-05
 Optimization stopped.
    -- Number of steps exceeded,  NStep=  44
    -- Flag reset to prevent archiving.
                           ----------------------------
                           ! Non-Optimized Parameters !
                           ! (Angstroms and Degrees)  !
 --------------------------                            --------------------------
 ! Name  Definition              Value          Derivative Info.                !
 --------------------------------------------------------------------------------
 ! R1    R(1,3)                  2.0901         -DE/DX =    0.0001              !
 ! R2    R(1,4)                  2.3364         -DE/DX =   -0.0027              !
 ! R3    R(1,5)                  2.475          -DE/DX =   -0.0005              !
 ! R4    R(1,6)                  2.09           -DE/DX =    0.0001              !
 ! R5    R(2,4)                  2.2588         -DE/DX =    0.005               !
 ! R6    R(2,5)                  2.5016         -DE/DX =   -0.0003              !
 ! R7    R(2,7)                  2.0938         -DE/DX =    0.0001              !
 ! R8    R(2,8)                  2.277          -DE/DX =    0.0                 !
 ! A1    A(3,1,4)              108.7762         -DE/DX =    0.0001              !
 ! A2    A(3,1,5)              111.1038         -DE/DX =   -0.0003              !
 ! A3    A(3,1,6)              121.9913         -DE/DX =    0.0                 !
 ! A4    A(4,1,5)               90.4121         -DE/DX =    0.0008              !
 ! A5    A(4,1,6)              108.9642         -DE/DX =    0.0                 !
 ! A6    A(5,1,6)              110.9631         -DE/DX =   -0.0003              !
 ! A7    A(4,2,5)               91.5588         -DE/DX =   -0.001               !
 ! A8    A(4,2,7)              109.5372         -DE/DX =    0.0005              !
 ! A9    A(4,2,8)              110.7403         -DE/DX =    0.0003              !
 ! A10   A(5,2,7)              109.6158         -DE/DX =    0.0                 !
 ! A11   A(5,2,8)              109.7383         -DE/DX =    0.0002              !
 ! A12   A(7,2,8)              121.5462         -DE/DX =   -0.0002              !
 ! A13   A(1,4,2)               93.4944         -DE/DX =   -0.0002              !
 ! A14   A(1,5,2)               84.5346         -DE/DX =    0.0004              !
 ! D1    D(3,1,4,2)           -112.417          -DE/DX =    0.0                 !
 ! D2    D(5,1,4,2)              0.0873         -DE/DX =    0.0                 !
 ! D3    D(6,1,4,2)            112.4694         -DE/DX =    0.0                 !
 ! D4    D(3,1,5,2)            110.2737         -DE/DX =    0.0003              !
 ! D5    D(4,1,5,2)             -0.079          -DE/DX =    0.0                 !
 ! D6    D(6,1,5,2)           -110.6139         -DE/DX =   -0.0003              !
 ! D7    D(5,2,4,1)             -0.0864         -DE/DX =    0.0                 !
 ! D8    D(7,2,4,1)            111.3833         -DE/DX =   -0.0003              !
 ! D9    D(8,2,4,1)           -111.8986         -DE/DX =    0.0001              !
 ! D10   D(4,2,5,1)              0.0817         -DE/DX =    0.0                 !
 ! D11   D(7,2,5,1)           -111.3167         -DE/DX =   -0.0001              !
 ! D12   D(8,2,5,1)            112.7964         -DE/DX =    0.0                 !
 --------------------------------------------------------------------------------
 GradGradGradGradGradGradGradGradGradGradGradGradGradGradGradGradGradGrad
C1 optimised calculation convergence:
         Item               Value     Threshold  Converged?
 Maximum Force            0.000092     0.000450     YES
 RMS     Force            0.000035     0.000300     YES
 Maximum Displacement     0.000829     0.001800     YES
 RMS     Displacement     0.000320     0.001200     YES
 Predicted change in Energy=-1.698544D-07
 Optimization completed.
    -- Stationary point found.
                           ----------------------------
                           !   Optimized Parameters   !
                           ! (Angstroms and Degrees)  !
 --------------------------                            --------------------------
 ! Name  Definition              Value          Derivative Info.                !
 --------------------------------------------------------------------------------
 ! R1    R(1,3)                  2.0932         -DE/DX =   -0.0001              !
 ! R2    R(1,4)                  2.3011         -DE/DX =    0.0                 !
 ! R3    R(1,5)                  2.4817         -DE/DX =    0.0                 !
 ! R4    R(1,6)                  2.0931         -DE/DX =   -0.0001              !
 ! R5    R(2,4)                  2.304          -DE/DX =   -0.0001              !
 ! R6    R(2,5)                  2.487          -DE/DX =   -0.0001              !
 ! R7    R(2,7)                  2.0939         -DE/DX =    0.0001              !
 ! R8    R(2,8)                  2.2754         -DE/DX =    0.0001              !
 ! A1    A(3,1,4)              109.6708         -DE/DX =    0.0                 !
 ! A2    A(3,1,5)              110.2465         -DE/DX =    0.0                 !
 ! A3    A(3,1,6)              121.6996         -DE/DX =    0.0                 !
 ! A4    A(4,1,5)               91.0762         -DE/DX =    0.0                 !
 ! A5    A(4,1,6)              109.642          -DE/DX =    0.0                 !
 ! A6    A(5,1,6)              110.2296         -DE/DX =    0.0                 !
 ! A7    A(4,2,5)               90.8735         -DE/DX =    0.0                 !
 ! A8    A(4,2,7)              109.4633         -DE/DX =    0.0                 !
 ! A9    A(4,2,8)              110.0698         -DE/DX =    0.0                 !
 ! A10   A(5,2,7)              109.9273         -DE/DX =    0.0                 !
 ! A11   A(5,2,8)              110.7546         -DE/DX =    0.0                 !
 ! A12   A(7,2,8)              121.4862         -DE/DX =    0.0                 !
 ! A13   A(1,4,2)               93.3021         -DE/DX =    0.0                 !
 ! A14   A(1,5,2)               84.7482         -DE/DX =    0.0                 !
 ! D1    D(3,1,4,2)           -111.9724         -DE/DX =    0.0                 !
 ! D2    D(5,1,4,2)              0.0078         -DE/DX =    0.0                 !
 ! D3    D(6,1,4,2)            111.9652         -DE/DX =    0.0                 !
 ! D4    D(3,1,5,2)            111.4481         -DE/DX =    0.0                 !
 ! D5    D(4,1,5,2)             -0.0073         -DE/DX =    0.0                 !
 ! D6    D(6,1,5,2)           -111.4288         -DE/DX =    0.0                 !
 ! D7    D(5,2,4,1)             -0.0078         -DE/DX =    0.0                 !
 ! D8    D(7,2,4,1)            111.5176         -DE/DX =    0.0                 !
 ! D9    D(8,2,4,1)           -112.5207         -DE/DX =    0.0                 !
 ! D10   D(4,2,5,1)              0.0073         -DE/DX =    0.0                 !
 ! D11   D(7,2,5,1)           -111.0924         -DE/DX =    0.0                 !
 ! D12   D(8,2,5,1)            111.8957         -DE/DX =    0.0                 !
 --------------------------------------------------------------------------------
 GradGradGradGradGradGradGradGradGradGradGradGradGradGradGradGradGradGrad
This analysis has shown that the C2h isomer is the lowest energy conformer and the table below indicates the relative energies of the other three conformers to this structure.
The above calculations and table indicates that the C2h conformer, where the Bromine atoms are in trans terminal positions in the molecule, is the most stable isomer of Al2Cl4Br2. Similarly, the next most stable conformer appears where the Bromine atoms are in cis terminal positions, which only is marginally higher in energy compared to the most stable conformer. It can be observed further that as the Bromine atom begins to appear as a bridging ligand, the relative energy compared to the lowest energy conformer increases significantly, (by around 13 KJmol-1 per bridging Bromine atom), resulting in the isomer with both Bromine atoms appearing as bridging ligands being the most energetically disfavoured, again indicated by a significant increase in relative energy of 13 KJmol-1. This obviously indicates that it is energetically unfavourable for the Bromine atoms to be positioned in a bridging position in a dimerised structure compared to Chlorine atoms. This could be a result of the better overlap of the donating 2p electrons of the Chlorine atoms into the unoccupied p orbital present at the Aluminium centre compared to the donation of the 3p electrons by a Bromine atom, as the more diffuse Bromine p orbitals will have a less effective overlap with the smaller p orbital of the Aluminium, resulting in weaker bonding.
Although there is little relative energy difference between the trans and cis terminal Bromine isomers, the ordering of energetic stability might be resulting from the molecule's overall desire to reduce its dipole moment[4]. Upon comparison of the dipoles of the two most stable conformers, the most stable isomer, (the C2h isomer), possesses the lower dipole moment, which perhaps leads to it being relatively more stable. Coincidentally, the data obtained from the calculations indicate that this isomer possesses the lowest dipole moment of all four of the computed conformers, although no general trend of increasing dipole moment correlating to increasing relative energetic instability, as the D2h conformer, (the highest energy isomer), possesses the second lowest dipole moment, yet is significantly higher in energy than other conformers. The relative energies can also be analysed by comparing the bond lengths of the bridging and terminal Bromine atoms. The terminal Bromine - Aluminium bond length of 2.27 Å in the C2h isomer is much shorter than the bridging Bromine - Aluminium bond length of 2.49 Å in the D2h isomer. This reflects weaker bonding present in bridging Bromine structures and contributes to the relative instability is this conformer.
Dissociation of Isomers into 2AlCl2Br
In order to calculate the dissociation energy for each isomer into two monomers of AlCl2Br, an optimisation calculation needs to be undertaken on the AlCl2 molecule, in order to first determine the energy minimum structure. The .log output file can be found here and below is a list of the calculation conditions and some select results. Additionally, a section of the output file has been provided below which shows that the optimisation was successful and that the forces and displacements have converged.
- File Type: .log
- Calculation Type: FOTP
- Calculation Method: RB3LYP
- Basis set: Gen
- Final Energy (au): -1176.19013679
- Gradient (au): 0.00004196
- Dipole Moment (Debye): 0.1075
- Time of Calculation: 1 minute 16.1 seconds
- Point Group: C2v
- DOI:10042/27217
         Item               Value     Threshold  Converged?
 Maximum Force            0.000136     0.000450     YES
 RMS     Force            0.000073     0.000300     YES
 Maximum Displacement     0.000760     0.001800     YES
 RMS     Displacement     0.000497     0.001200     YES
 Predicted change in Energy=-7.984455D-08
 Optimization completed.
    -- Stationary point found.
                           ----------------------------
                           !   Optimized Parameters   !
                           ! (Angstroms and Degrees)  !
 --------------------------                            --------------------------
 ! Name  Definition              Value          Derivative Info.                !
 --------------------------------------------------------------------------------
 ! R1    R(1,2)                  2.089          -DE/DX =   -0.0001              !
 ! R2    R(1,3)                  2.089          -DE/DX =   -0.0001              !
 ! R3    R(1,4)                  2.2695         -DE/DX =   -0.0001              !
 ! A1    A(2,1,3)              119.8353         -DE/DX =    0.0001              !
 ! A2    A(2,1,4)              120.0823         -DE/DX =   -0.0001              !
 ! A3    A(3,1,4)              120.0823         -DE/DX =   -0.0001              !
 ! D1    D(2,1,4,3)            180.0            -DE/DX =    0.0                 !
 --------------------------------------------------------------------------------
 GradGradGradGradGradGradGradGradGradGradGradGradGradGradGradGradGradGrad
The following calculation shows how the dissociation energy of the C2h isomer into two AlCl2Br monomers has been calculated.
E(C2h isomer Al2Cl4Br2) = -2352.41629723 au
E(AlCl2Br) = -1176.19013679 au
ΔE = 2E(AlCl2Br) - [E(C2h isomer Al2Cl4Br2)]
ΔE = 0.03602365 au
ΔE = 94.580093075 KJmol-1
ΔE = 94.58 KJmol-1
As this value is positive, this indicates that the dissociation of this isomer into two AlCl2Br monomers is disfavoured, which means that the dimerised molecule is more stable than two monomer units. It could be concluded that this stability, known as dimerisation energy, of the dimerised product can be derived from the Aluminium centres obtaining a full octet of electrons. The relative stability of the dimerised product compared to the monomer is approaching the region of single bond energies, indicating that this is a significant stabilising interaction, which can be observed in other group 3 halides and hydrides[5].
Frequency Analysis of Conformers of Al2Cl4Br2
Using the optimised structures presented above, a frequency analysis of the conforms was undertaken. This calculation confirmed that energy minima were found because the energies calculated were identical to the optimisation calculated energies, in addition to showing that there were no negative frequencies obtained. The table below shows the results from the frequency analysis on all of the conformers, (the output file can again be viewed by clicking on the ".log" hyperlink and the low frequency output for each conformer is presented below the table for completeness, which shows that all the "zero" frequencies are indeed low and that there are no negative frequencies.
| Molecule |  |
 |
 |
 |
| File Type | .log | .log | .log | .log |
| Calculation Type | FREQ | FREQ | FREQ | FREQ |
| Calculation Method | RB3LYP | RB3LYP | RB3LYP | RB3LYP |
| Basis set | Gen | Gen | Gen | Gen |
| Final Energy (au) | -2352.40630453 | -2352.41629723 | -2352.41626636 | -2352.41109920 |
| Gradient (au) | 0.00018497 | 0.00009406 | 0.00007046 | 0.00006361 |
| Dipole Moment (Debye) | 0.0421 | 0.0286 | 0.1636 | 0.1290 |
| Time of Calculation | 4 minutes 4.8 seconds | 4 minutes 24.3 seconds | 3 minutes 37.8 seconds | 3 minutes 30.2 seconds |
| Point Group | C1 | C1 | C1 | C1 |
| IR Spectrum |  |
 |
 |
 |
| D-Space Link | DOI:10042/27218 | DOI:10042/27220 | DOI:10042/27219 | DOI:10042/27221 |
D2h Low Frequency output:
Low frequencies ---   -5.4164   -4.8044   -3.0715   -0.0028    0.0012    0.0018
Low frequencies ---   14.9038   63.2645   86.0665
C2h Low Frequency output:
Low frequencies ---   -5.1312    0.0035    0.0040    0.0042    1.3827    2.0662
Low frequencies ---   18.1529   49.1101   73.0079
C2v Low Frequency output:
Low frequencies ---   -4.2277   -2.4315   -0.0034   -0.0020   -0.0011    1.3300
Low frequencies ---   17.1789   50.9119   78.5445
C1 Low Frequency output:
Low frequencies ---   -2.1021   -0.0031   -0.0031   -0.0030    1.2931    3.2252
Low frequencies ---   17.1966   55.9270   80.0503
All the frequency analysis calculations indicate that that each molecule possesses 18 different vibrational modes; this is the expected result from the key equation, 3N - 6, which gives the number of vibrational frequencies, (illustrating that computational chemistry allows for the prediction of frequency and form of vibrations), and is reasonable, as all the conformers have the same overlying geometry, therefore it could be expected that all the conformers would have similar stretches. Conversely, none of the spectra show all 18 peaks, which is a result of some of the vibrational bands being experimentally inactive. As previously stated, in order for a vibrational band to be IR active, there must be a change in electric dipole moment, which is associated with that particular vibrational frequency[6].
An important factor to consider when determining whether a particular vibrational band will be IR active is the symmetry of the molecule. It is clear from the above IR spectra that molecules with higher levels of symmetry will show a fewer number of peaks in the computed IR spectrum. The C1 conformer has the least symmetry of all the conformers of Al2Cl4Br2, however the IR spectrum for this molecule displays the highest number of vibrationally active peaks. Moreover, as the general molecular symmetry is increased and the D2h isomer is considered, there are fewer IR active modes. Furthermore, as the symmetry of the molecule is further increased and the C2v and C2h conformers are analysed, it becomes apparent that there are even fewer infrared active vibrational modes.
The spectra of these 2 conformers, which notably have very similar point groups, are almost identical, however a peak present in the IR spectrum for the C2v conformer is absent in the IR spectrum of the C2h isomer, indicating that the C2h conformer is the most symmetric of all the conformers. This absence/presence of the IR peak when comparing the spectra of these two conformers can be an effective way to show the effect of symmetry on electric dipole moment and subsequently vibrational (in)activity. The below table shows the computer calculated symmetric stretch of the molecule and eludes to it IR activity. These equivalent symmetric stretches occur at similar frequencies, however the trans (C2h) conformer's symmetric stretch is vibrationally inactive. This is because any change in dipole for the two Al - Br bonds stretches are cancelled out due to molecular symmetry, as the dipoles point in opposite directions (the same applies to the Al - Cl bond stretches). Hence, as there is no overall change in electric dipole moment, the peak is IR inactive and doesn't appear in the spectrum for the trans isomer, yet does appear for the cis conformer.
| Conformer | Vibrational Frequency (cm-1) | Animated Stretching | Vibrationally Active? |
| C2h | 459 | 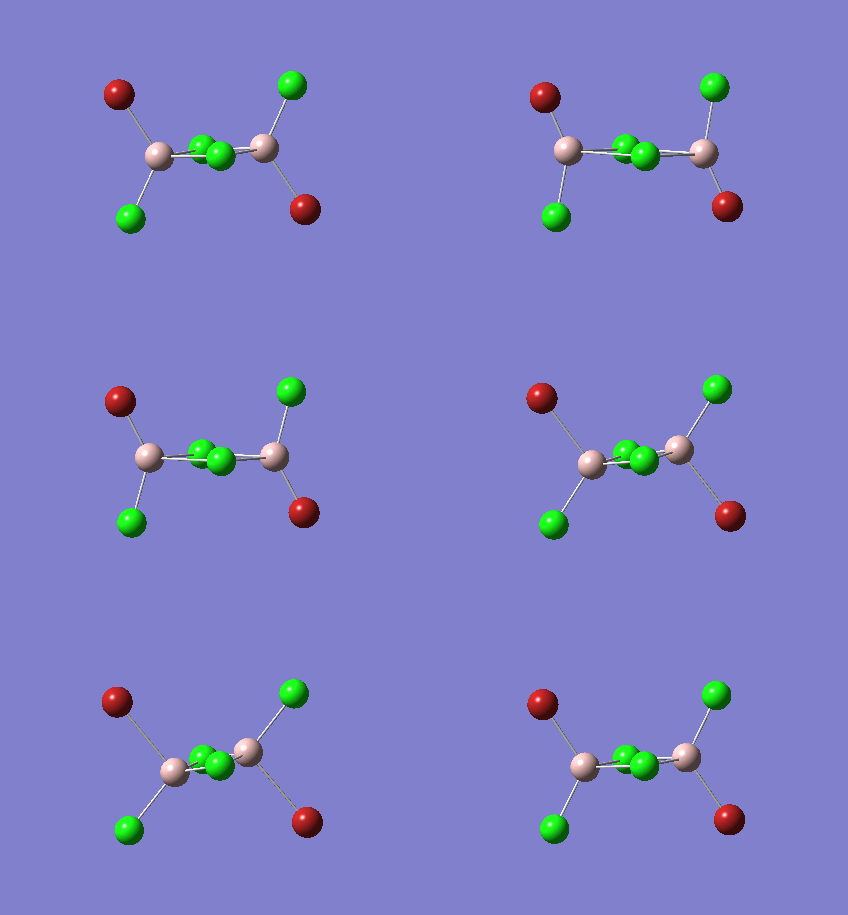
|
No |
| C2v | 461 | 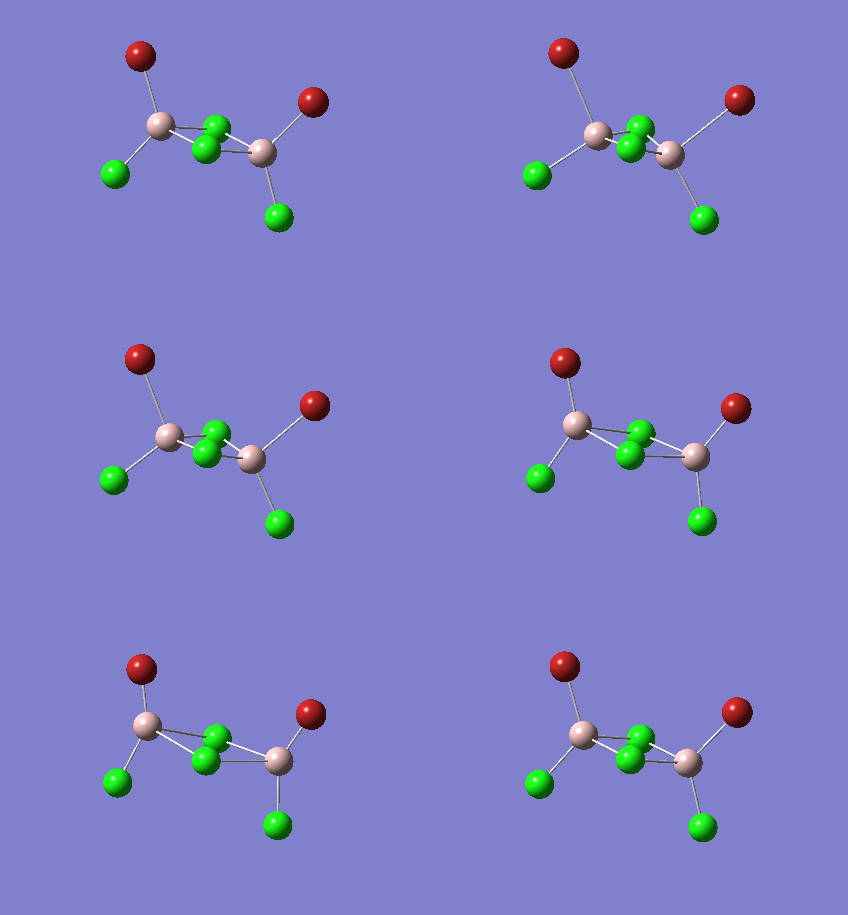
|
Yes |
Moreover, the additional table below illustrates how changes in the position of the Bromine atoms in the molecule can affect vibrational activity. To aid visualisation, the asymmetric Al - Br stretching vibrations under consideration, (which are all IR active), have been animated. For the C1, C2h and C2v isomers, (which contain at least one terminal Bromine - Aluminium bond), the vibrational frequencies appear in nearly identical locations in the IR spectra. Conversely, the D2h conformer, which notably contains no terminal Bromine atoms, appears at a much lower vibrational frequency. In order to correlate this result, the underlying theory of bond vibrations must be considered. A vibrational frequency depends on both the bond strength and the reduced mass of the bond under investigation, however, as the atoms under consideration are the same, the reduced masses will also be equal, therefore, only bond strength can be considered. As previously stated, stronger bonds require more energy input in order to vibrate, hence, the vibrational band appears at higher vibrational frequencies compared to weaker bonds. In the previous section, it was determined that the bridging Bromine atoms have a longer bond length compared to terminal Bromine atoms, which is a result of the decreased electron density present in these bonds. Therefore, it can be concluded that the terminal Bromine atoms form stronger bonds with the Aluminium atom and the bridging Bromine atoms are significantly weaker. Hence, the D2h conformer appears significantly lower in the computed IR spectrum than the other conformers which contain a least one terminal Bromine - Aluminium bond.
| Conformer | Vibrational Frequency (cm-1) | Animated Stretching |
| C1 | 424 | 
|
| C2h | 421 | 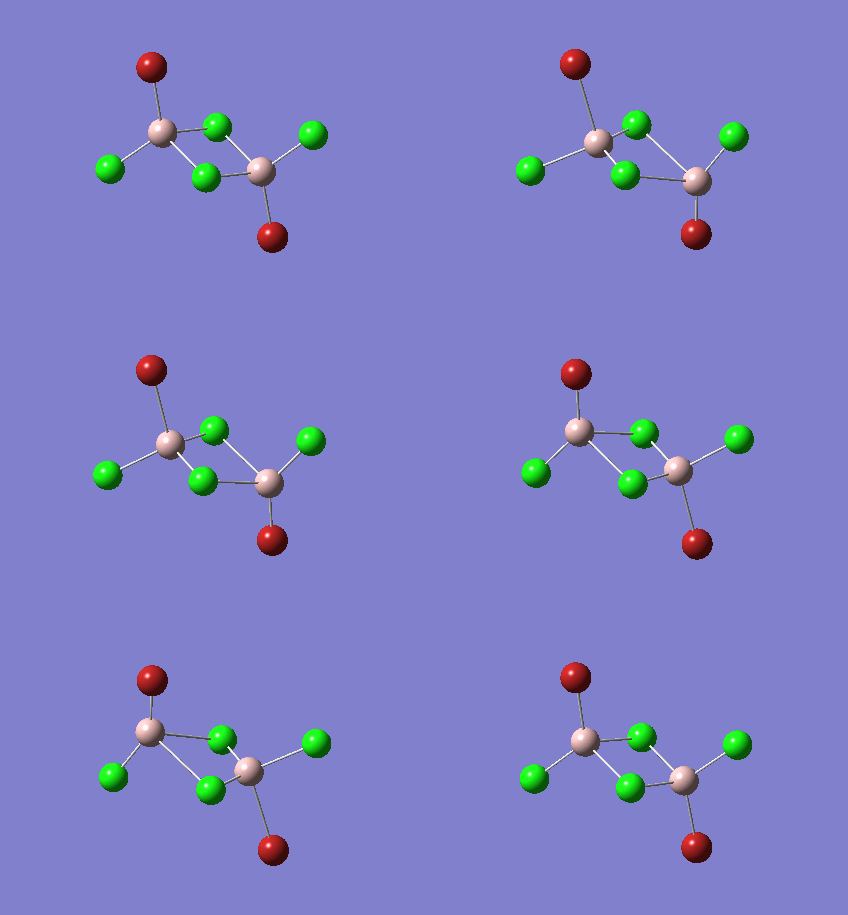
|
| C2v | 420 | 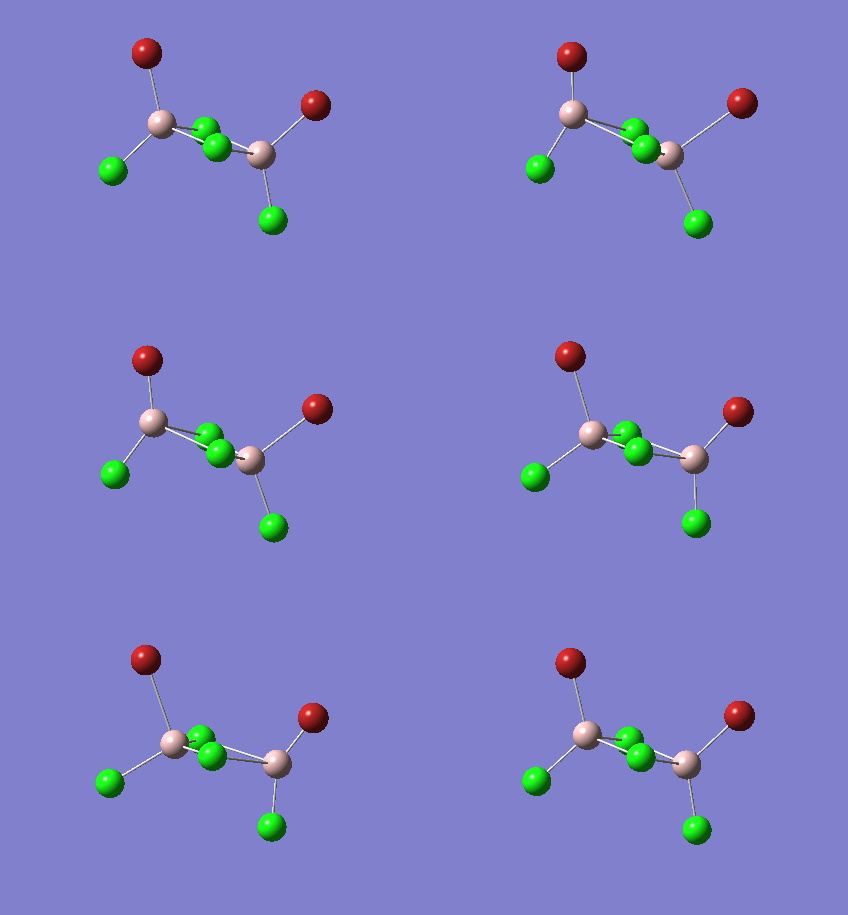
|
| D2h | 241 | 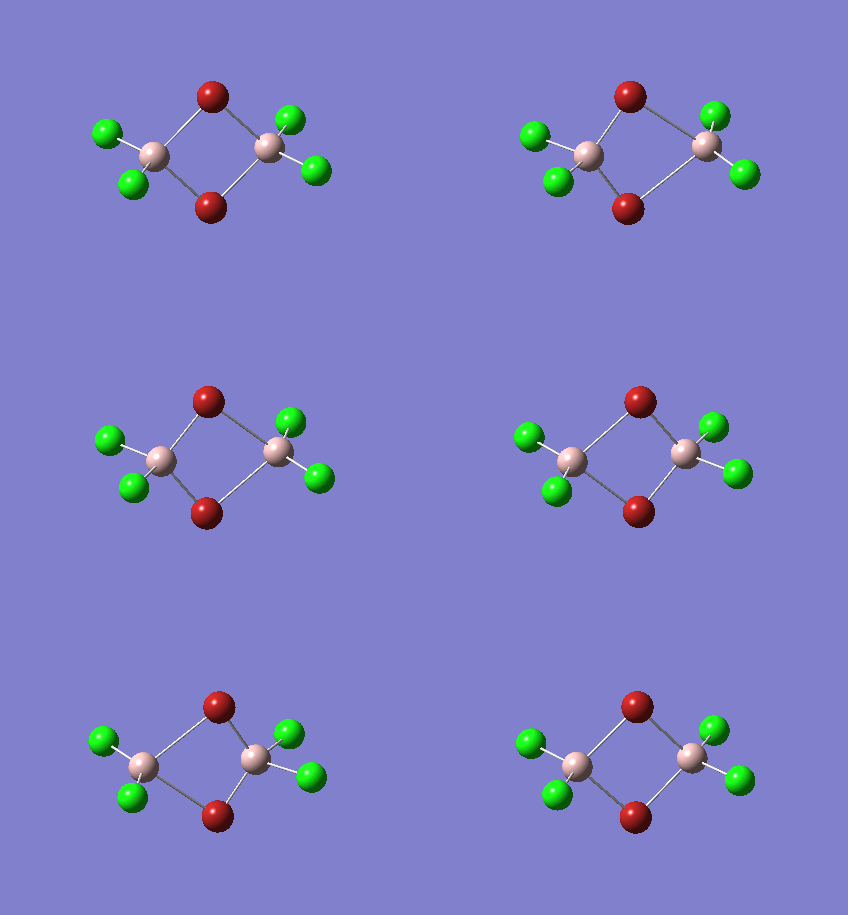
|
Population Analysis of C2h conformer of Al2Cl4Br2
In order to visualise the molecular orbitals associated with the lowest energy conformer, an energy calculation must be undertaken on the output file of the optimisation of the C2h conformer of Al2Cl4Br2, utilising the same basis sets and pseudo-potentials specified in the previous sections. The .log output file can be viewed here and the following list details some of the calculation's details and select results.
- File Type: .fch
- Calculation Type: SP
- Calculation Method: RB3LYP
- Basis set: GEN
- Final Energy (au): -2352.41629723
- Gradient (au): 0.00000000
- Dipole Moment (Debye): 0.0286
- Time of Calculation: 36.3 seconds
- DOI:10042/27227
Below are 24 non-core molecular orbitals which have been visualised from the calculation. The remaining 30 molecular orbitals are core orbitals, and resemble the non valence electronic orbitals that a particular electron pair occupies. These core orbitals are also significantly lower in energy than the valence electrons, therefore are often not involved in bonding interactions due to their inherent stability.
A few of the above molecular orbitals have been selected to analyse the interactions that are present in the molecular orbitals. Additionally, some anti-bonding orbitals have been visualised in order to observe any significant interactions that are present in the molecular orbital.
References
- ↑ [DOI: 10.1021/ja983408t Timoshkin, Alexey Y; Suvorov, Andrew V; Bettinger, Holger F; Schaefer, Henry F; J. Am. Chem. Soc., 121, 1999, 5690]
- ↑ [Atkins, Peter; Overton, Tina; Rourke, Jonathan; Weller, Mark; Armstrong, Fraser; Inorganic Chemistry 5th Edition, Oxford, Oxford University Press, 2010, 30]
- ↑ [Anderson, Rosaleen J; Bendell, David J; Groundwater, Paul W; Organic Spectroscopic Analysis 1st Edition, Cambridge, RSC Publishing, 2004, 26]
- ↑ [Coxon, J. M; Gerrard, J. A; Worked Solutions in Organic Chemistry 1st Edition, London, Thomson Science, 1998, 27]
- ↑ [ed. A.J.Downs; Chemistry of Aluminium, Gallium, Indium, and Thallium, 1st Edition, Glasgow, Chapman and Hall, 1993, 123]
- ↑ [Anderson, Rosaleen J; Bendell, David J; Groundwater, Paul W; Organic Spectroscopic Analysis 1st Edition, Cambridge, RSC Publishing, 2004, 26]

