Rep:Mod:Rp1912org
Cyclopentadiene
The Molecules studies in this section are all optimised using Avogadro (MMFF94s Force field).
Dimerisation of Cyclopentadiene
| Exo Product | Endo product | |||||
|---|---|---|---|---|---|---|
| Optimised molecule | ||||||
| Energy in kJ/mol | 231.84 | 243.63 |
The relative energies computed using molecular mechanics (MMFF94s force field on Avogadro) show that the exo product is more stable and thus is the thermodynamic product. The higher stability of the exo prodcut arises from a lower sterically hindered approach of the dieneophile to the diene which is reflected in the exo product compared to the endo product as shown above. However, according to literature, the exo prodcut is not the most favoured product in the thermal Diels-Alder dimerisation of cyclopentadiene[1], suggesting that this reaction is under kinetic control ( which is based on the stability of the transition state structure) rather than a thermodynamic one ( which based solely on the stability of the product). Mechanistically, this means that the transition state of the endo product is lower in energy due to a lower activation energy barrier and thus will be the faster reaction under kinetic conditions and hence will be the major prodcut. The reasons for the more stable transition state geometry of the endo product can be explained using Woodward and Hoffmann's theory of secondary orbital overlap [2][3]. This stabilising secondary orbital overlap arises due to the endo approach of the dienophile toward the diene, resulting in the in-phase orbital interaction between the secondary orbitals (non bond forming orbitals). These stabilising interactions are not present in the exo transition sate, hence why it's transition state is higher in energy and the reason why it is not the kinetic product.
Hydrogenation of Cyclopentadiene Dimer
| 3 | 4 | |||||
|---|---|---|---|---|---|---|
| Optimised molecule | ||||||
| Total Energy in kJ/mol | 212.37 | 172.74 | ||||
| Stretching Energy in kJ/mol | 13.83 | 11.81 | ||||
| Bending Energy in kJ/mol | 129.07 | 103.28 | ||||
| Torsional Energy in kcal/mol | 0.33 | -1.58 | ||||
| VDWs Energy in kcal/mol | 55.56 | 44.50 |
The endo-dicyclopentadiene formed from the diels alder cycloadditon of cyclopentadiene can be hydrogenated to give an endo-tetrahydrodicyclopentadiene adduct. However, dicyclopentadiene is only fully hydrogenated to this adduct upon prolonged hydrogenation. Initially, this reaction gives an endo-dihydro-dicyclopentadine molecule 3 or 4. Which of the two molecules 3 or 4 is initially formed is based on whether hydorgenation proceeds via kinetic or thermodynamic control. The relative energies of both molecules 3 and 4 were computed by optimising their geometries(using MMFF94s force-field in Avogadro). The results obtained show that molecule 4, with only the norbornene double bond hydrogenated is more stable than molecule 3, where only the C5 (cyclopentene) double bond is hydrogenated. This shows that thermodynamic prediction is that molecule 4 is formed upon initial hydrogenation. This is in fact in agreement with literature.[4], which states that the rate of hydrogenation of the double bond in the norbornene is much higher than the rate of hydrogenation of the double bond in the C5 ring.[4], . From these results, it can be seen that it is the location of the double bond which determines the relative stabilities of these molecules. Double bond in the norbornene is less favoured/more destabilised than a double bond in the C5 unit. This is consistent with the higher reactivity of the norbornene double bond due to the release of the (larger) ring strain induced by the bridging present in the norbornene compared to the cyclopenetene ring which is much less strained. This can be seen from the relative double bond angles of norbornene and cyclopentene. The computed angles are 107o and 112o respectively. It can be seen that there is a larger deviation from the ideal 120o angle involving an sp2 hybridised carbon in the norboenene. This angle strain also leads to larger angle bending energy contribution. The angle bending energy contribution comes from the energy associated with vibrations around the equilibrium bond angle. The large energy means that it takes a lot of energy to deform the molecule from its equilibrium bond angle. A larger angle bending energy is seen (as shown above) in molecule 3 due to the larger angle strain present in molecule 3, as mentioned earlier.
In addition, it can be seen that there is a larger Van der Waals energy contribution in molecule 3 than 4. A large Van der Waals energy contribution refers to more non-bonded Van der Waals ruplusion than van der Waals attractive interactions being present in a molecule. The VDWs repulsion and attraction concept is similar to that seen in the Leonard Jones potential where there is strong repulsion at shorter distances and attraction at longer distances between two atoms until the equilibrium bond length is reached. At equillibrium bond length, the attraction is at a maximum and as the atoms move further apart, the attraction begins to decrease again. In a similar way, there is maximum VDWs attraction when the distance between two non bonded atoms equal the sum of the VDWs radii of the two atoms. The reasons for the larger VDWs energy in molecule 3 than 4 can be better understood by looking at the VDWs energy contribution in the dicyclopentadiene molecule before hydrogenation. This energy contribution was was computed to be 51.63 kJ/mol. This shows that hydrogenation of the norbornene double bond in molecule 4 leads to an increase in Van der Waals attractive interactions, indicated by a 7.13 kJ/mol decrease in VDWs energy. On the other hand, the hydrogenation of the cyclopentene double bond leads to an increase in VDWs repulsion indicated by a 3.93 kJ/mol increase in VDWs energy in molecule 3. The specific interaction that led to this increase and decrease in VDWs energy are likely to be between non-bonded H atoms. Van der Waals radii of H is 1.2Ǎ[5], so sum of Van der Waals radii is 2.4Ǎ, this is the the distance at which there will be maximum VDWs attraction. A distance below 2.1 Ǎ between the Hs will be strongly repulsive.
Taxol Intermediate
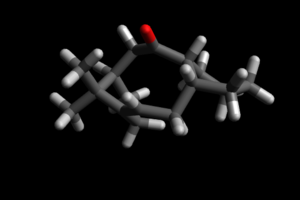
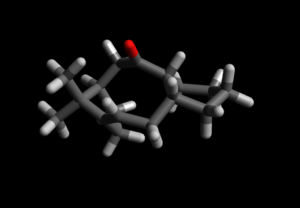
The geometries of the two taxol intermediates were optimised to give a range of different energy conformers for each intermediate. This was achieved by changing the the cyclohexane ring conformation into chair, twist-boat and boat. It can be seen from the results that the lowest energy conformer is when the cyclohexane ring is in the chair conformer followed by twist boat and then boat. This is as expected for cyclohexane molecule[6].
Atropisomer 1 (C=O pointing up)
| Conformer 1 | Conformer 2 | Conformer 3 | |||||||
|---|---|---|---|---|---|---|---|---|---|
| Optimised molecule | |||||||||
| Total Energy in kJ/mol | 295.37 | 319.55 | 326.19 | ||||||
| Conformation of Cyclohexane ring | 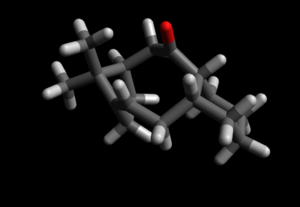 |
 |
| ||||||
| Conformation of Cyclohexane ring | Chair | Twist Boat | Boat |
Atropisomer 2 (C=O pointing down)
| Conformer 1 | Conformer 2 | Conformer 3 | |||||||
|---|---|---|---|---|---|---|---|---|---|
| Optimised molecule | |||||||||
| Total Energy in kJ/mol | 253.56 | 277.56 | 278.42 | ||||||
| Conformation of Cyclohexane ring | 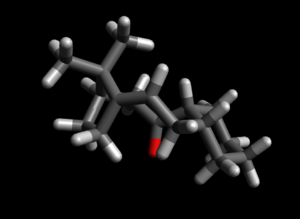 |
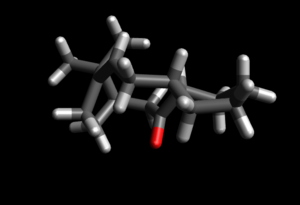 |
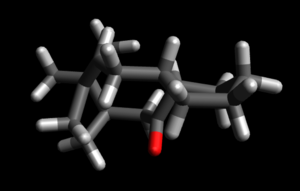
| ||||||
| Conformation of Cyclohexane ring | Chair | Twist Boat | Boat |
Which is more stable? Atropisomer 1 or 2??
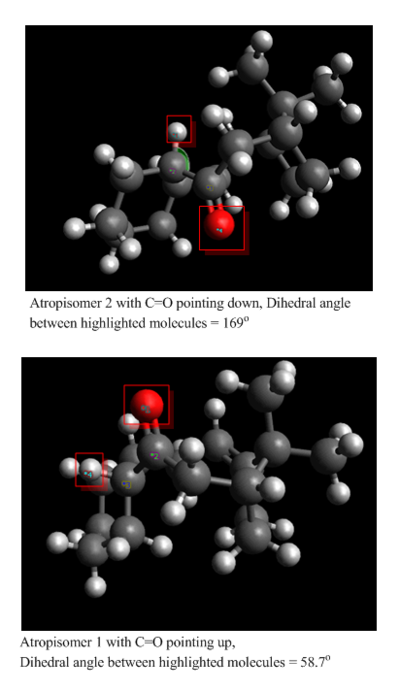
It can be seen from the above computed relative energies of the atropisomers 1 and 2 that the isomer with the C=O pointing down is more stable. This is because of the the favourable anti-periplaner (app) orientation of the C=O bond with the hydrogen of the adjacent carbon. This orientation is only present when the C=O is pointing down and is highlighted in figure below. This orientation allows for stabilising orbital overlap. The best overlap occurs between a high energy donor orbital and a low energy acceptor orbital. In atropisomer 2 with the C=O pointing down there is a stabilising interaction between σC-H and σ*C-O. This is a very stabilising interaction as the σC-H orbital is a good high energy donor and the electronegativity of the oxygen makes the σ*C-O a very good low energy acceptor. This favourable orbital interaction is not present in atropisomer 1 with C=O pointing up because the orientation of C=O bond and the C-H bond is gauche (highlighted in figure below, dihedral angle of 58.7o). This type of favourable overlap is only optimal in app orientation with a dihedral angle of 180o. It can been seen in figure below that in atropisomer 2 the dihedral angle is 168o which is close to this preferred 180o, leading to a good stabilising overlap.
In addition to this orbital overlap , van der waals dispersion forces (and pauli repulsion) between non bonded atoms play a role in the overall stability of a particular conformer. Steric repulsion is also present between the C=O bridge and the norbornene bridge in isomer 1. Also it can be seen that the computed bending energy for isomer 1 is much higher than for isomer 2. This indicates that the isomer with the C=O pointing up is more rigid than the other isomer, hence the reason for the larger amount of energy required to bend this molecule.
Hyperstability of alkenes
The concept of hyperstability can be seen in these taxol intermediates where the bridgehead double bond reacts slowly, this is especially true in the more stable atropisomer 2. Hyperstability refers to the unusal stability of these alkenes [7]that are usually disfavoured (according to Bredt's rule[8]) which states that extreme angle strain is introduced into rings if a double bond is next to a bridge leading to an over destabilising of the molecule. The slow reaction rate comes from the lack of thermodynamic driving force, as the presence of this double bond is more stable than the corresponding saturated version of the molecule for example. This can be seen from the relative energies computed for atropisomer 2 and it's saturated version. It can be seen that the saturated molecule is less stable than the atropisomer 2, suggesting that the olefinic strain expected in the atropisomer 2 is in fact stabilising, thus the reason for the lack of thermodynamic driving force for a simple hydrogenation reaction of the atropisomer 2.
| Atropisomer 2 - conformer 1 | Hydrogenated Atropisomer 2 -conformer 1 | |||||
|---|---|---|---|---|---|---|
| Optimised Molecule | ||||||
| Angles of interest | 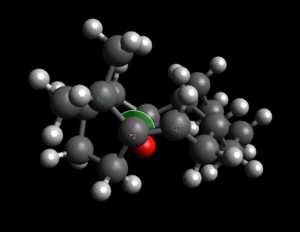 |
| ||||
| Total Energy in kJ/mol | 253.56 | 338.48 | ||||
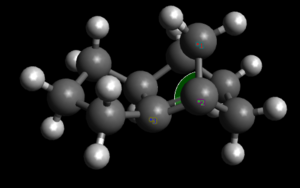
| Bridgehead angle (o) | 122.6o | 124.7o | ||||
| Preferred angle (o) | sp2 Carbon - 120.0o | sp3 carbon - 109.0o |
This idea can be better explained by looking at the specific bridgehead alkene angles computed for both a smaller ringed system and a larger ring molecule. Here norbornene is used to explain Bredt's rule[8]. This was done by calculating optmised energies of norbornene and hydrogenated norbornene. The lowest energy conformer of Atropisomer 2 is used to explain hyperstable alkenes, again the optimised energies of atropisomer 2 and hydrogenated atropisomer 2 were calculated.
It can be seen from the energies obtained for the norbornene system that a bridgehead double bond is not preferred in smaller rings indicated by the angle strain introduced by this double bond. It can be seen that the bridgehead angle in norbornene is much lower than the preferred 120o for that sp2 carbon. The effect of this can be better understood in terms of reactivity, where it can be seen from the relative computed energies that the saturated norbornene is much more stable than norbornene containing the bridgehead double bond. Note that in reality, the norbornene isomer such as the one shown above will not exist, it is only used here to explain these concepts. The hydrogenation was done to emphasize the fact that a double bond at this position is not thermodynamically preferred.
The data obtained for the norbornene system was then compared to the angle strain data obtained for the larger ringed system to explain the existence of hyperstability. It can be seen from the relative energies obtained for the atropisomer 2 and it's hydrogenated version, that the double bond is actually preferred at the bridgehead (as opposed to what was seen in the norbornene). This stability can again be explained in terms angle strain at the bridgehead double bond. However, unlike in the norborene system, the bridgehead double bond here does not introduce angle strain into the molecule. This can be explained by comparing the bridgehead angle of the the atropisomer and its hydrogenated version. It can be seen that hydrogenation of the bridgehead double bond increases the angles strain in the molecule. The angle is much larger than the preferred 109o for an sp3 carbon. However, the bridgehead double bond angle before hydrogenation shows that it is much closer to the preferred 120o for an sp2 carbon, introducing very little strain into the molecule. This explains why reaction of this double bond tends to be slow and not preferred as it leads to the loss of this stability(as shown by the computed data obtained for hydrogenation of this double bond.[9]
Spectroscopic Simulation using Quantum Mechanics
All initial optimisations were done using MMFF94s force field on avogadro. The optimised geometries were then further optimised using Gaussian for spectroscopic simulation. The following was used: Method: DFT=B3LYP Basis set = 6-31G (d,p) solvent = Benzene
Optimisation using Avogadro
| Conformer 1 | Conformer 2 | |||||
|---|---|---|---|---|---|---|
| Optimised molecule | ||||||
| Total Energy in kJ/mol | 420.86 | 427.92 | ||||
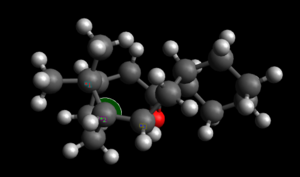
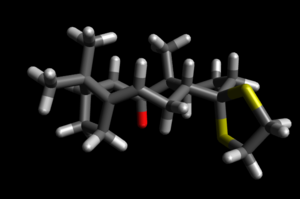
| Conformation of Cyclohexane ring | 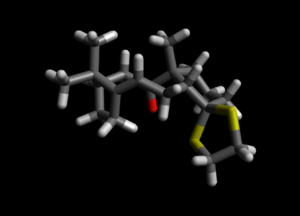 |
| ||||
| Conformation of Cyclohexane ring | Chair | Twist Boat |
Optimisation using Gaussian
optimisation file of comformer 1: DOI:10042/138181
optimisation file of comformer 2: DOI:10042/138186
| Conformer 1 | Conformer 2 | |||||
|---|---|---|---|---|---|---|
| Optimised molecule | ||||||
| Conformation of Cyclohexane ring | Chair | Twist Boat |
13 C NMR
| lower energy conformer | Higher energy conformer | |
|---|---|---|
| Optimised Molecule | 
|

|
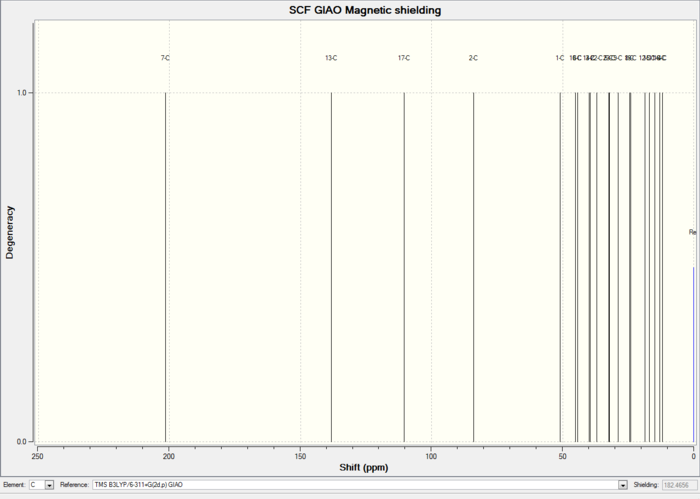
13 C NMR of Lower energy conformer
13 C NMR of Higher energy conformer
| Carbon | Computed δ (ppm)- lower energy conformer | Computed δ (ppm)- lower energy conformer | Literature δ(ppm)[10] |
|---|---|---|---|
| 7 | 201.46 | 200.98 | 211.49 |
| 13 | 138.33 | 138.75 | 148.72 |
| 17 | 110.43 | 109.30 | 120.90 |
| 2 | 84.03 | 79.11 | 74.61 |
| 1 | 50.86 | 58.24 | 60.53 |
| 10 | 45.17 | 46.27 | 51.30 |
| 6 | 44.34 | 45.85 | 50.94 |
| 14 | 39.94 | 40.34 | 45.53 |
| 3 | 39.55 | 32.37 | 43.28 |
| 22 | 37.07 | 38.40 | 40.82 |
| 5 | 32.30 | 25.59 | 38.73 |
| 23 | 32.13 | 34.44 | 36.78 |
| 9 | 28.93 | 27.75 | 35.47 |
| 8 | 24.45 | 21.32 | 30.84 |
| 19 | 24.01 | 19.27 | 30.00 |
| 12 | 18.49 | 19.00 | 25.56 |
| 15 | 16.84 | 16.13 | 25.35 |
| 11 | 14.80 | 15.56 | 22.21 |
| 16 | 13.02 | 13.79 | 21.39 |
| 4 | 11.97 | 11.38 | 19.83 |
It can be seen from the computed carbon NMR shifts that there is good agreement with the literature. However, it is important to note that the in normal NMR spectroscopy, if there are more than one conformations possible for a molecule, the barrier to bond rotation that leads to the different conformations are low, meaning that the interconversions between the different conformation occurs are a very fast rate on the NMR time scale. This means that the NMR shifts obtained experimentally is time averaged. On the other hand, an NMR spectrum obtained computationally refer to that of a single conformation, which is the case here, where 2 spectra were obtained for a lower and higher energy conformer of the molecule under study. Therefore, to make a fair comparison between the literature and the computed NMRs, time averaged shifts must be obtained using computational methods. This can be achieved by computing the NMRs of many of the possible conformers. The shifts obtained for the different conformers should then be weighted according to their presence in the Boltzmann's distribution. Computationally this is very expensive and so this was not done in this study.[11]
1 H NMR
To reduce the complexity of the comparision with literature hydrogen NMR shifts for this molecule, only the computed shifts for lowest energy chair conformer is used in this section. The lowest energy conformer, should in theory give the best comparison with literature, as the lowest energy conformer is expected to have the highest population in the Boltzmans distribution of conformers, therefore, the largest contribution to the average shift obtained experimentally should be from this conformer. The comparison with literature is shown below.
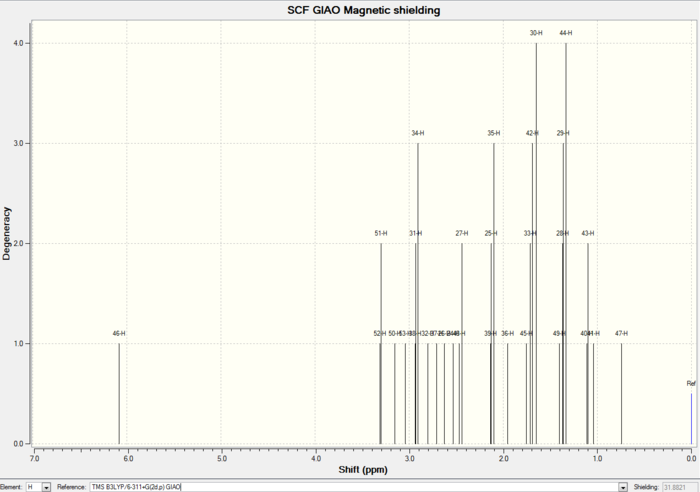
1H NMR of conformer 1
| Hydrogen | Lowest energy conformer 1 δ(ppm) | Literature δ(ppm) [10] | 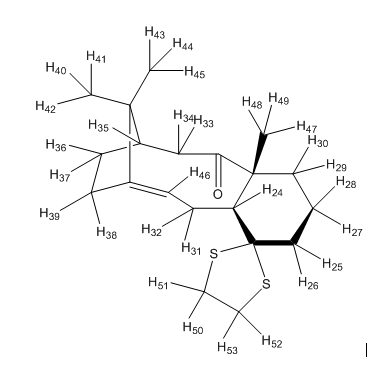
|
|---|---|---|---|
| 46 | 6.08 | 5.21 | |
| 33,34,31,32, 37, 38 | 2.92 -1.70 | 3.00 -2.70 | |
| 50, 51, 52, 53 | 3.31-3.04 | 2.70-2.35 | |
| 25, 26, 27, 28, 29, 30 | 2.63 - 1.37 | 2.20-1.70 | |
| 24 | 2.53 | 1.58 | |
| 35, 36, 39 | 2.12-1.95 | 1.50-1.20 | |
| 47, 48, 49 | 1.52 (averaged shifts of 47, 48 and 49) | 1.10 | |
| 43, 44, 45 | 1.39 (averaged shifts of 43, 44, 45) | 1.07 | |
| 40, 41, 42 | 1.28 (averaged shifts of 40, 41 and 42) | 1.03 |
It can be seen from the above comparison that the computed NMR shifts do not agree well with literature. Overall, it can be seen that the computed predictions are higher than the experimental NMR shifts. This is as expected because, the NMR shifts computed here are of the lowest energy conformer, where as the experimental shifts will be the time averaged shifts of all the possible conformers as explained earlier in the carbon NMR section. Another point to note is that the experimental NMR shifts quoted here included spin spin coupling, with formations of multiplets. The computed shifts did not take into account spin spin coupling and therefore, a chemical shift was obtained for each hydrogen in the molecule. Also due to the fixed geometry in the calculation for the computed shifts, no degenerate hydrogen were obtained, for example experimental shifts show the methyl group hydrogens (40, 41, 42) in this molecule having 1 distinct shift, as all these hydrogens will be in the same environment due to free rotation. However, since 3 separate shifts were obtained for these same hydrogens computationally, these values were averaged to make a better comparison with literature (as shown in the table above).
Finally, taking the group of hydrogens 33,34,31,32, 37, 38 as an example, at first glance it is possible to think that these hydrogens cannot in reality be grouped together to correspond to a 6 H multiplet in literature[10] as they are cannot all couple to each other to give the multiplet quoted in literature. However, it was grouped in this instance, as these hydrogens are all likely to have very similar chemical shifts and so can lead to overlapping peaks. This means that the multiplet quoted in literature may in fact correspond to many overlapping multiplets instead of a single 6 H multiplet[10].
In conclusion, from the spectroscopic data obtained computationally it can be seen that, it is more reliable to use computed carbon NMR spectra for comparison with experimental spectra. The use of computed H NMR spectra such as the one obtained here is much less reliable, due to the lack of coupling information obtained for example. However, it is now possible to obtain a spin spin coupled spectra computationally, but is very computationally expensive. Therefore this technique was not employed here, but could be done as part of future work.
Analysis of the properties of alkene epoxides
Trans-β-methyl Styrene oxide
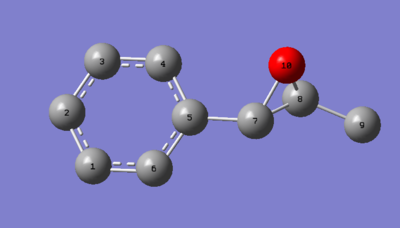
The geometries of the R,R and S,S enantiomers of Trans-β-methyl Styrene oxide were optimised (using MMFF94s in Avogadro). The optimised geometries were then further optimised on gaussian to generate spectroscopic data (1H NMR and 13C NMR) for the two enantiomers. Several Chiro-optical properties were then calculated for both enantiomers, including optical rotations and VCD (Vibrational circular dichroism) spectra.
13C NMR
Method: DFT=B3LYP Basis set = 6-31G (d,p) solvent = Chloroform
Spectroscopic simulation file of R, R Trans-β-methyl styrene oxide: DOI:10042/138554
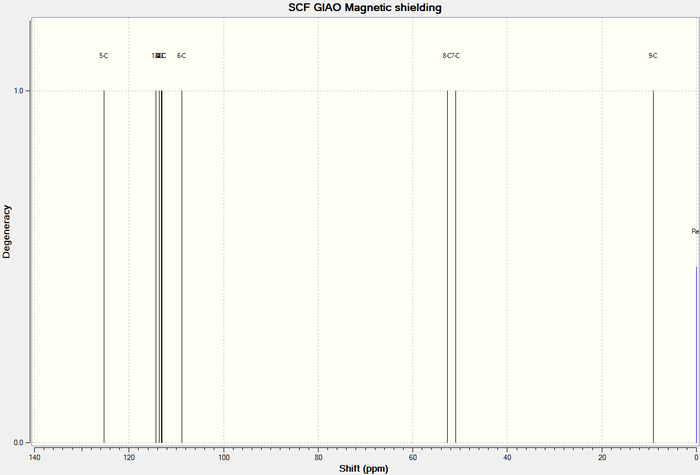
13C NMR spectrum of R,R Trans-β-methyl styrene oxide
Spectroscopic simulation file of S, S Trans-β-methyl styrene oxide: DOI:10042/138559
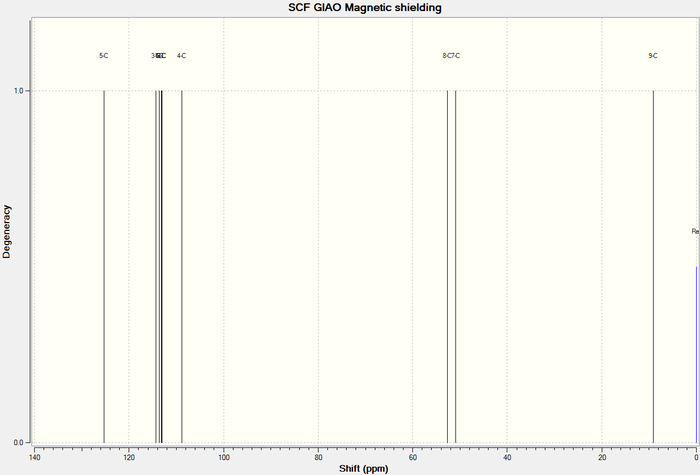
13C NMR spectrum of S,S Trans-β-methyl styrene oxide
| R,R | S,S | |
|---|---|---|
| Optimised Molecule | 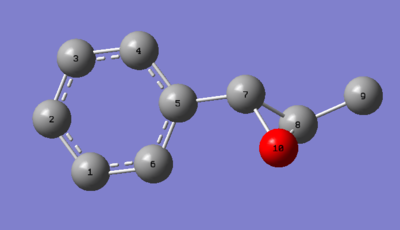
|
|
| Carbon | R,R (δ (ppm)) | S,S (δ (ppm)) | Literature Values (δ (ppm)) [12] |
|---|---|---|---|
| 5 | 125.27 | 125.27 | 135.84 |
| 1 | 114.37 | 113.62 | 128.3 |
| 3 | 113.62 | 114.37 | 127.7 |
| 4 | 113.09 | 108.78 | |
| 2 | 113.02 | 113.02 | |
| 6 | 108.78 | 113.09 | 125.7 |
| 8 | 52.62 | 52.62 | 59.7 |
| 7 | 50.87 | 50.87 | 59.7 |
| 9 | 9.13 | 9.13 | 18.1 |
It can be seen from the above computed 13C NMR spectra that the two enantiomers can not be distinguished using carbon NMR, as they give identical chemical shifts. The Only difference seen is in the computed assignments of the specific carbons to the spectra. It can be seen that the carbon 1,3,4 and 6 are assigned the opposite way around in the two enantiomers, but this does not help towards assigning a specific enantiomer to a spectrum as the chemical shifts are still identical.
This technique can still be used to compare the computed shifts with experimental results. It can be seen from the literature comparison above that there is reasonably good agreement, however overall the computed shifts are lower than the those quoted in literature. Also, when comparing experimental results with computed ones such as these to confirm the epoxide formation, the most importnant chemical shifts are the epoxide carbon shifts ( carbon 7 and 8). As you can see, these computed shifts are fairly similar to those quoted in literature, rememebring that the computed shifts are only of one conformer.
It should also be noted that for carbon atoms 2,3,4 only one chemical shift was quoted in literature, as all the carbons in the benzene are n very similar environments. Computationally, of course it was possible to obtain separate peaks for every carbon present. This can be very useful in understanding how chemical shifts are affected by the presence of an electronegative group (such as O) in a benzene molecule (for example to see if there are any ortho/para effects), as often it is very difficult to experimentally obtain distinct chemical shifts for benzene units of a molecule. This is true in both hydrogen and carbon NMRs.
1H NMR
Method: DFT=B3LYP Basis set = 6-31G (d,p) solvent = Chloroform
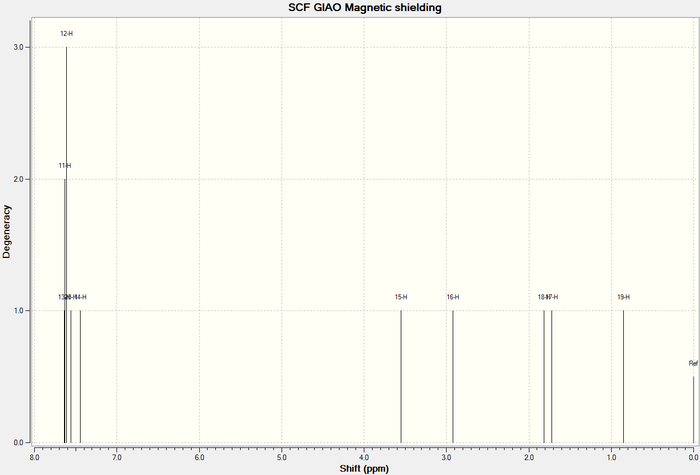
1H NMR spectrum of R,R Trans-β-methyl styrene oxide
| Hydrogen | R,R (δ (ppm) | Literature Values δ (ppm)[12] | Optimised molecule-R,R |
|---|---|---|---|
| 13,11,12 | 7.63 | 7.24-7.39 | 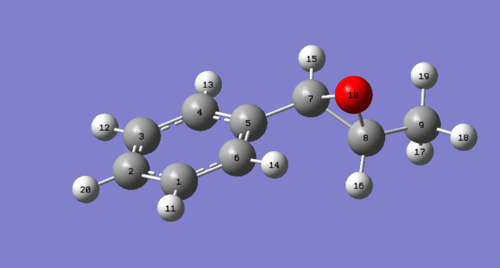
|
| 20 | 7.56 | ||
| 14 | 7.44 | ||
| 15 | 3.55 | 3.57 | |
| 16 | 2.92 | 3.32-3.40 | |
| 18 | 1.81 | 1.45 | |
| 17 | 1.72 | ||
| 19 | 0.85 |
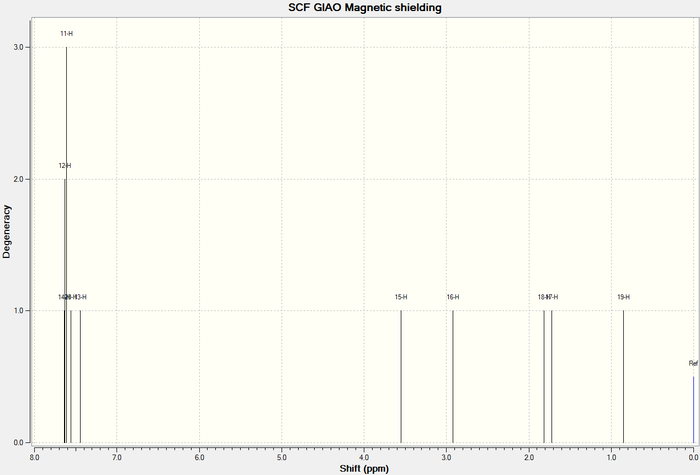
1H NMR spectrum of S,S Trans-β-methyl styrene oxide
| Hydrogen | S,S (δ (ppm)) | Literature Values δ (ppm)[12] | Optimised S, S molecule |
|---|---|---|---|
| 14,11,12 | 7.63 | 7.24 - 7.39 | 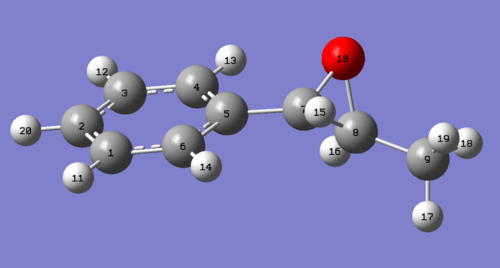
|
| 20 | 7.56 | ||
| 13 | 7.44 | ||
| 15 | 3.55 | 3.57 | |
| 16 | 2.92 | 3.32 - 3.40 | |
| 18 | 1.81 | 1.45 | |
| 17 | 1.72 | ||
| 19 | 0.85 |
It can be seen from the above computed 1H NMR spectra of the two enantiomers that it is not possible to distinguish between them using this technique, as they give identical chemical shifts. It can be seen from the computed assignments that hydrogen 13 and 14 are the opposite way around in the two enantiomers. In reality this does not help to distinguish between them as the two spectra are still identical. However the chemical shifts obtained computationally can be compared to experimental data to confirm the presence of an epoxide product. Here, the spectra obtained were compared to literature, and they are only in agreement to a certain degree because as explained earlier, the experimental chemical shifts are time averaged values of all the possible conformers of a specific molecule, compared to a computed spectra which gives chemical shifts of a molecule that is assumed to have only a single defined geometry. This is main reason for the deviations seen between literature and computed data. There is very good agreement with literature for the methyl hydrogens (17, 18 and 19). In reality, these hydrogens will be in the same environmet due to free rotation around carbon 8 and 9. This means an average chemical shift can be obtained from the chemical shifts computed for these hydrogens. This value comes out otbe 14.6 ppm, which is is excellent agreeent with chemical shift quoted inliterature.
It can also be seen that spin-spin coupling was not included in the (Gaussian) quantum mechanical calculation when these spectra were generated and hence the computed spectra gives no information on the multiplicity of the hydrogens, and hence this information could not be compared to literature.
Chiro-optical Properties - Optical rotation
Chiro-optical properties such as optical rotation and VCD spectrun can be computed using a similar approach to that used for the generation of the spectroscopic data. This information is much more useful in assigning the absolute configuration for a particular enantiomer. This can be done by computing optical rotation values for a known enantiomer say, the R, R enetiomer of Trans-beta-methystyrene oxide. Once an optical rotation value is obtained for this enantiomer it can then be assumed that the other enantiomer, S,S trans-beta-methylstyrene will have an optical rotation that is identical in magnitude but opposite in sign as expected. This can then be used as reference for comparison with experimentally obtained optical rotation to assign absolute configuration.
Optical Rotation file here R, R Trans-β-methylstyrene oxide:DOI:10042/138566
Optical Rotation file here S, S Trans-β-methylstyrene oxide:DOI:10042/138568
| Enantiomer | Computed Optical rotation ([α]D in deg) | Literature Optical rotation ([α]D in deg) |
|---|---|---|
| R,R | 46.8o | +45.7o[13], -48.5o[14], 44.3o[15] |
| S,S | -46.8o |
It can be seen that the optical rotation values are in good agreement with literature. It can also be seen, as expected, the computed optical rotation values are equal in magnitude and opposite in sign for the two enantiomers. This technique can therefore be used to distinguish between the two enantiomers by comparing experimental optical rotation values to computed values such as these.
Chiro-optical Properties - VCD spectra
VCD file R, R Trans-β-methyl-styrene oxide : DOI:10042/138574
VCD file S, S Trans-β-methyl-styrene oxide : DOI:10042/138577
| Enantiomer | VCD Spectrum |
|---|---|
| R,R | 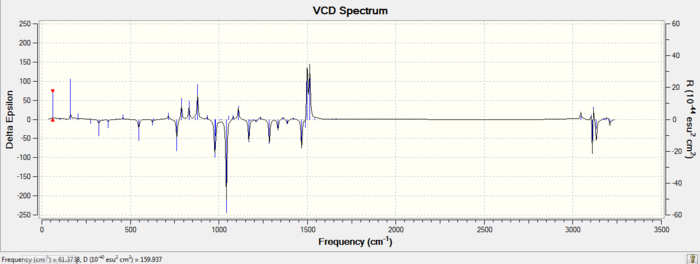
|
| S,S | 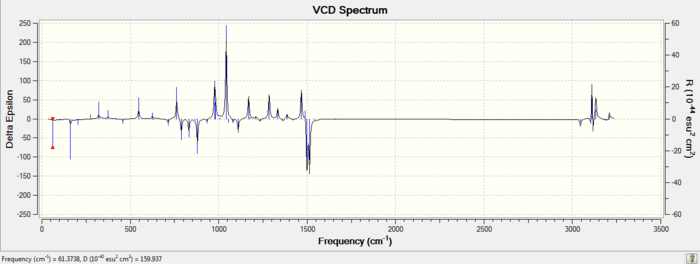
|
VCD is a technique which can be used to determine with certainty the absolute configurations of chiral molecules, such as the enantiomers studied here. Quantum mechanically computed VCD spectra such as the ones shown above are increasingly being used to compare with experimental VCD spectra to determine absolute configurations of molecules. VCD works on the idea that enantiomers will behave differently to circularly polarised light ( same idea used to obtain optical rotation values). The difference here is that a VCD spectra is obtained at infrared wavelengths where the dichorism is caused by the vibrational motions in the molecules[16]. It can be seen from the VCD spectra obtained above for the R,R and S,S trans-beta-methylstyrene oxide that the two spectra are opposite in sign (wheras an IR spectra of the two enantiomers would have been identical), therfore experimentally obtained VCD can be compared to this spectra to determine if the sample is the R,R or S,S enantiomer. In addition to this, an advantage of using VCD experimentally is that, no separation of the enantiomers is necessary to determine which enantiomer you have in excess[16]. This is done by comparing the relative intensities of the peaks in the VCD obtained (the enantiomer in excess will have a higher intensity). This technique therefore, can be thought of as a combination of both chiral chromatography and optical rotation where both ee and absolute configuration can be determined.
Dihydronaphthalene oxide
For this epoxide, only one of the enantiomers were studied as the previous study on both of the Trans-β-methyl styrene enantiomers showed that the NMR chemical shifts were identical. Also, the two enantiomers showed opposite chiro-optical properties, meaning that using the chiro-optical properties of one enantiomer, the properties of the other enantiomer could be determined.
The geometry of the S,R enantiomer of Dihydronaphthalene oxide was optimised (using MMFF94s in Avogadro). The optimised geometry was then further optimised on gaussian to generate spectroscopic data (1H NMR and 13C NMR) for the enantiomer. Several Chiro-optical properties were then calculated for the enantiomers, including optical rotation, ECD (Electronic Circular Dichroism) and VCD (Vibrational circular dichroism) spectra as before.
13C NMR
Method: DFT=B3LYP Basis set = 6-31G (d,p) solvent = Chloroform
Spectroscopic simulation file of 1S,2R Dihydronaphthalene oxide: DOI:10042/138640
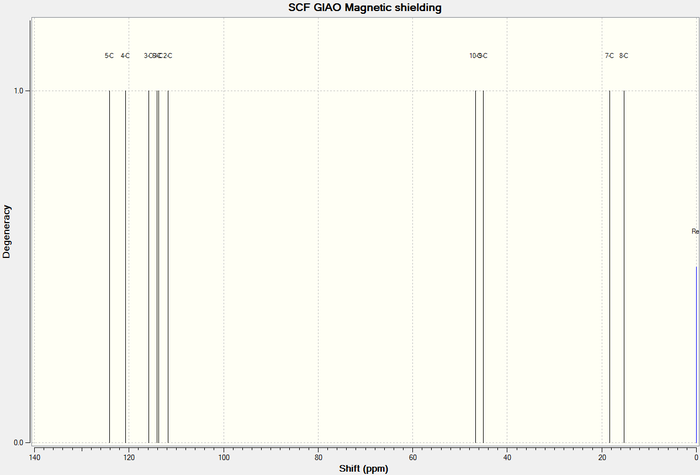
sup>13C NMR spectrum of 1S,2R Dihydronaphthalene oxide
| Carbon | 1S, 2R (δ (ppm)) | Literature Values (δ (ppm))[12] | Optimised Molecule |
|---|---|---|---|
| 5 | 124.14 | 137.10 | 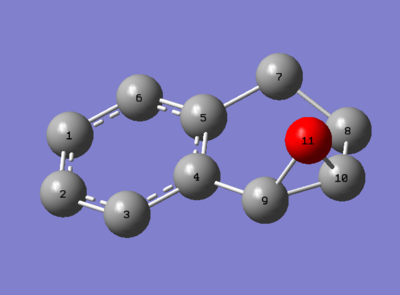
|
| 4 | 120.68 | 132.90 | |
| 3 | 115.85 | 129.90 | |
| 6 | 114.13 | 128.83 | |
| 1 | 113.72 | 128.80 | |
| 2 | 111.74 | 126.50 | |
| 10 | 46.73 | 55.50 | |
| 9 | 45.12 | 55.20 | |
| 7 | 18.33 | 24.80 | |
| 8 | 15.24 | 22.20 |
As, before for trans-beta-methylstyrene oxide, It can be seen that the carbon NMR chemical shifts obatined computaionally are lower than those quoted in literature. As before, these values can still be used to confirm the formation of an epoxide. Carbons 9 and 10 correspond to the epoxide carbons and are the most important chemical shifts obtained computationally, as these will be used as reference for comparision with experimental results to cofirm formation of an epoxide. In the case of dihydronaphthalene, chemical shifts of C 9 and 10 do not agree exactly with literature, but do still lie witihin the range for an epoxide carbon.
1H NMR
Method: DFT=B3LYP Basis set = 6-31G (d,p) solvent = Chloroform
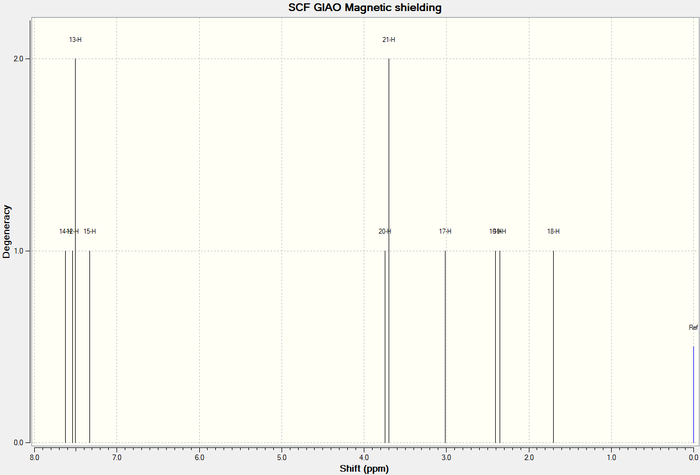
1H NMR spectrum of 1S,2R Dihydronaphthalene oxide
| Hydrogen | 1S, 2R (δ (ppm)) | Literature Values (δ (ppm)) [12] | Optimised Molecule |
|---|---|---|---|
| 14 | 7.63 | 7.34 | 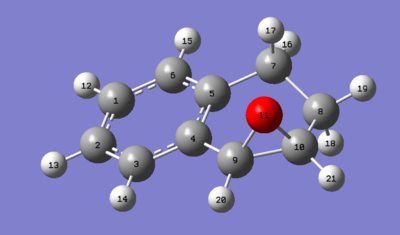
|
| 12,13 | 7.52 | 7.09-7.25 | |
| 15 | 7.33 | 7.02 | |
| 20,21 | 3.72 | 3.79, 3.66 | |
| 17 | 3.02 | 2.64-2.70 | |
| 16 | 2.40 | 2.47 | |
| 19 | 2.35 | 2.29-2.37 | |
| 18 | 1.70 | 1.62 - 1.72 |
It can be seen that the computed chemical shifts are in agreement with those quoted in literature. As seen throgught out this study, computed hydrogen NMR values are higher than those measured experimentally. Again the epoxide hydrogens 20 and 21 are in vergy good agreement with literature. therefore, these computed shifts can be used to compare with exerimental result to confirm formation of epoxide.
Chiro-optical Properties - Optical rotation
Optical Rotation file of 1S,2R Dihydronaphthalene oxide: DOI:10042/138647
| Enantiomer | Computed Values ([α]D in deg) | Literature Values ([α]D in deg) |
|---|---|---|
| 1S, 2R | -155.8o | -144.9o[17], -138.0o[18] |
Chiro-optical Properties - VCD spectra
VCD file of 1S,2R Dihydronaphthalene oxide: DOI:10042/138653
| Enantiomer | VCD Spectrum |
|---|---|
| 1S,2R | 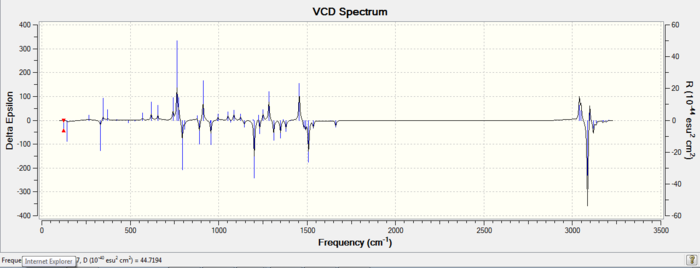
|
Catalysts for Asymmetric Epoxidation of Alkenes
Shi Catalyst
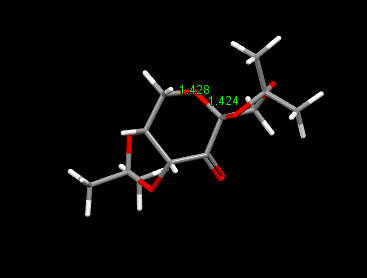
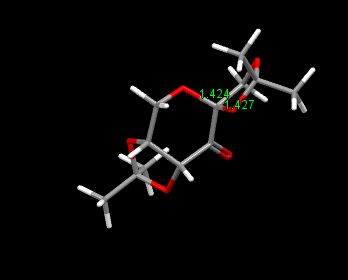
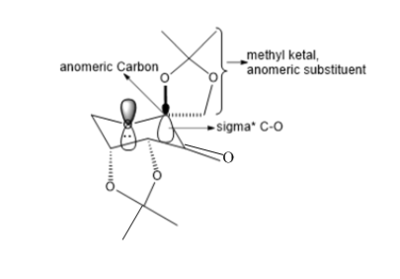
The crystal structure of Shi catalyst is shown above. It can be seen that the attack of an alkene from the bottom face is prevented by the acetal group on the bottom face. This leaves approach of the alkene from the top face. Further selectivity is achieved on the top face by the methyl ketal group at the anomeric carbon. It is because of the anomeric effect that this group can be placed in this position, where a stabilsiing interaction can occur between the lone pair on oxygen (of fructose unit) and the σ* c-o as indicated in the diagram below. This anomeric interaction can be confirmed by looking at the c-o bond lengths around the anomeric centre. It is expected that if the lone pair is being donated into the antibonding σ*, this c-o bond will increase, while the c-o bond length of the fructose unit decreases. [19]. This is in fact what can be seen in the diagram above where an decrease in bond length is seen from 1.428 Ǎ to 1.424 Ǎ in the fructose unit. In addition an increase in bond length is seen in the anomeric substitutent c-o bond to 1.427 Ǎ as expected as an antibonding orbital are being occupied by interaction with the oxygen lone pair (as shown in diagram below).
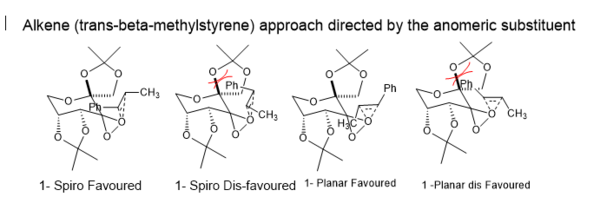
This reason for having this anomeric substituent is so that it can introduce selctivity into alkene approach as shown below. Firstly, there are two ways in which the alekene can orientate itself with respect to the fructose based catalyst; spiro and planar. However, the affect of the anomeric substituent here is to direct the approach of the alkene into both the spiro and planar geometries. The diagram below shows the alkene trans-beta-methylstyrene, in the spiro and planar transition state geometries[20][21], where the position of the alkene substituents are directed by the anomeric substituent.
Jacobsen Catalyst
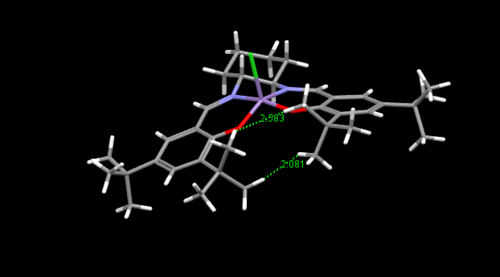
As you can see from the crystal structure obtained from the CCDC that the Jacobsen catalyst has axially locked t-butyl groups that prevent certain approaches of the alkene to the double bond,inducing selectivity into any epoxidations done using this catalysts. It can be seen that there is close approach between the t-butyl hydrogens leading to unfavourable van der waals repulsion between the hydrogens that are 2.1 Ǎ apart. This distance is much lower than the sum of VDWs distance of 2 hydrogen atoms of 2.4Ǎ [5](reasons for VDWs repulsion and attraction at these distances are explained in section 1.2). This repulsive interaction may lead to the active catalyst with (Mn=O species) in the transition state having a non planar conformation to reduce this repulsive interactions which can lead to further selectivity in approach of alkene.
Transition State Analysis of Asymmetric Epoxidation of Alkenes
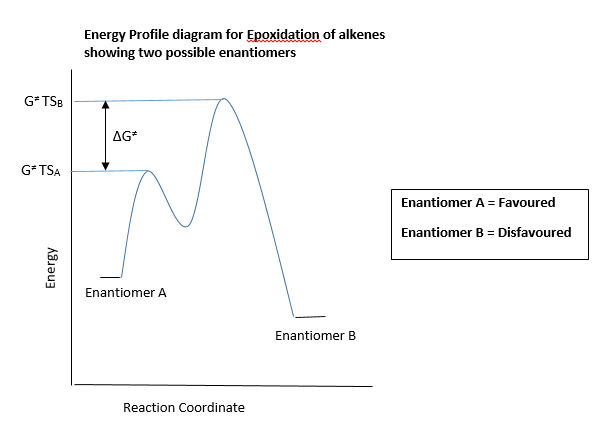
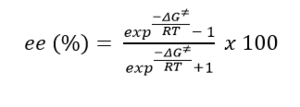
The Transition state energies obtained from the given optimised transition state geometries were used to calculate an enantiomeric excess (ee) for the epoxidation of Trans-β-methylstyrene and Dihydronaphthalene using shi and Jacobsens catalyst. The was done by firstly identifying which was the lowest energy transition state between the possible enantiomers. This was done to establish which enantiomer would be more favoured and therefore would be formed in excess. An energy profile diagram is given above showing this idea. The Lowest energy transition state of the other (unfavoured) enantiomer was also identified. The energy difference between the transition states of the favoured and disfavoured enantiomers can be used to calculate a constant K. This constant can be thought of as an equilibrium constant which can be related to the ratio of concentrations of each of the enantiomers formed. The constant K can then be used to calculate an enantiomeric excess (ee) for that particular epoxidation using the following relationships:
Note that in the above equations, ΔG‡ corresponds to the difference in transition state energies of the enantiomers. the equation for K is derived from the relation ΔG = RTln(K).
Transition state analysis - Shi Catalyst
| Shi Catalyst Epoxidation Transition state energies (in A.U) | ||
|---|---|---|
| Trans-beta-methylstyrene oxide | R,S | S,R |
| TS 1 | -1343.022970 | -1343.017942 |
| TS 2 | -1343.019233 | -1343.015603 |
| TS 3 | -1343.029272 | -1343.024742 |
| TS 4 | -1343.032443 | -1343.023766 |
The lowest energy transition state leads to formation of R,R trans-beta-methyl-styrene oxdie.
| Shi Catalyst Epoxidation Transition state energies (in A.U) | ||
|---|---|---|
| Dihydronaphthalene oxide | R,S | S,R |
| TS 1 | -1381.120782 | -1381.131343 |
| TS 2 | -1381.125886 | -1381.116109 |
| TS 3 | -1381.134059 | -1381.126039 |
| TS 4 | -1381.126722 | -1381.136239 |
The Lowest energy Transition state leads to the formation of 1S, 2R Dihydronaphthalene oxide.
| Alkene | G‡favoured (kJmol-1) | G‡disfavoured (kJmol-1) | ΔG‡ (kJmol-1) | Computed ee %, (config.) | Literature ee %, (config) |
|---|---|---|---|---|---|
| Trans-beta-methyl-styrene | -3526131.95 | -3526111.73 | -20.22 | 99.9426548 (R,R) | 88 %, (R,R) [22] |
| 1,2 Dihydronaphthalene | -3626173.47 | -3626167.75 | -5.72 | 81.9239135 (1S, 2R) | 32 % (1S, 2R) [22] |
The above computed ee values were calculated using the equation discussed earlier. Note that the ΔG‡ is equal to the difference between the two transition state energies of the enantiomers, as shown in the energy profile diagram shown above. It can be seen from the ee obtained computationally that this method is a fairly good tool in predicting the selectivity of the shi catalyst. Overall, The results show that shi catalyst is more selective with trans-alkenes. This selectivity can be better explained by looking at the ΔG‡ values of each of the alkene epoxidations above. It can be seen in the epoxidation of the 1,2 Dihydronaphthalene (a cis alkene), that ΔG‡ value is much lower than in the epoxidation of Trans-beta-methyl-styrene. In assymmetric epoxidation reactions, to achieve good selectivity the ΔG‡ must be as large as possible. A very large difference between the transition states of the possible enantiomers means that one of the enantiomers (the one with the lowest transition state energy as shown in the energy profile diagram) will be much more favoured than the other enantiomer. This is the basis on which selective asymmetric epoxidations work. Hence, it can be concluded using a transition state energy argument that the shi catalyst can selectively epoxidise trans-alkenes better than cis alkenes, which is in agreement with literature.
However based on the ee calculated, the selectivity discussed earlier cannot be seen as well. A higher ee was caculated for the trans alkene as expected, suggesting better selectivity with trans alkenes. However, the calculated ee for dihydronaphthalene is not much lower than the calculated ee for trans-beta-methyl-styrene (as expected because exponential functions are involved in calculating ee, a large difference in ΔG‡ between the two systems do not correspond to a large difference in ee between the two systems). This means that by comparing the ee values, it cannot be said that the shi catalyst has a preference in selectively epoxidising trans alkenes over cis alkens. This does not agree with literature, which shows that ee for dihydronaphthalene should be much lower than the calculate value of 81 %. The reasons for this disagreement with ee values could be due to a number of different factors. Firstly, the absolute values of transition state energies calculated are much larges than expected for these enantiomers. This means that the quantum mechanical approximation used here has over predicted the real energies. This could be due to that the fact that the calculation did not account for some interactions that could affect the transition state energies or in other words, there are not enough terms used in the calculations, resulting in a poor approximation. Also, the deviation from literature, can be due to the fact that the calculations were done at room temperature, but the literature ee values correspond to reactions done at 0oC.
It was found that this computational method can be used to correctly predict the configuration of the enantiomer formed in excess. It can be seen that in both alkene systems studied here, the computational prediction of the enantiomer formed in excess is in good agreement with literature. It can be seen that for the Trans-beta-methyl styrene system , the R, R conformer is formed in excess using the shi catalyst. This is not only in agreement with literature, but it is also in agreement with theory. In shi epoxidations, the trasntiton state can either proceed via spiro or planar geometry as mentioned earlier in section 5.1.
Theory predicts that the epoxidation of a trans-alkene proceeds via a favoured spiro transition state as shown in the diagram in section 5.1. In total there are 8 possible transition states which could lead to either the R,R or the S,S trans-beta-methyl styrene epoxide (4 of which are shown in diagram in section 5.1). The lowest energy transition state computed here, likely corresponds to the sprio favoured 1 geometry shown in diagram in section 5.1 which leads to the R, R enantiomer.
Transition state analysis - Jacobsen's Catalyst
| Jacobsen's Catalyst Epoxidation Transition state energies (in A.U) | ||
|---|---|---|
| Trans-beta-methylstyrene oxide | R,R | S,S |
| TS 1 | -3383.253816 | -3383.262481 |
| TS 2 | -3383.254344 | -3383.257847 |
The lowest energy transition state leads to the formation of R, R Trans-β-methyl styrene oxide.
| Jacobsen's Catalyst Epoxidation Transition state energies (in A.U) | ||
|---|---|---|
| Dihydronaphthalene oxide | R,S | S,R |
| TS 1 | -3421.359354 | -3421.369033 |
| TS 2 | -3421.359499 | -3421.361580 |
The lowest energy transition state leads to the formation of 1S, 2R Dihydronaphthalene oxide
| Alkene | G‡favoured (kJmol-1) | G‡disfavoured (kJmol-1) | ΔG‡ (kJmol-1) | Computed ee %, (config.) | Literature ee %, (config) |
|---|---|---|---|---|---|
| Trans-beta-methyl-styrene | -8882756.32 | -8882734.96 | -21.36 | 99.9638602 % (S,S) | 47 % [23](not available) |
| 1,2 Dihydronaphthalene | -8982780.05 | -8982805.08 | -25.03 | 99.9917693 %, (1S,2R) | 86 % [23](1S, 2R) |
It can be seen above that the ee values obtained computationally that this method cannot be used to determine the selectivity of the Jacobsen's catalyst definitvely. This is becasue the difference in ΔG‡ obtained for the trans and cis alekene system are small. This means that it cannot be said that Jacobsens catalyst selectively epoxidises cis alkens much better than trans-alkenes. However, overall, ΔG‡ is larger in the cis alkene dihydronaphthalene epoxidation, suggesting that there is slightly better selectivity in cis alkene epoxidation, but ΔG‡ in trans-beta-methylstyrene, even though is smaller than in dihydronaphthalene, the absolute value is still very large (-21.36 kJ/mol), suggesting good selective epoxidation of trans-beta-methylstyrene. This does not agree with literature, which says that Jacobsen catalyst selectiviely epoxidises cis alkenes. [24] [25]. It can also be seen that the literature ee is much lower than the predited for both alkene systems, especially for trans-beta-methyl styrene. These literature values agree with theory in that the jacobsens catalyst gives good ee with cis alkenes.
The computed results therefore cannot be used to understand the selectivity of Jacobsens catalyst. This may be due to the lack of complete understanding about the transition states of Jacobsen epoxiations. It can be seen above that absolute configuration from literature could not be found for trans-beta-methystyrene oxide. Also, very few literature references were found which gave specific ee values fot these alkene systems, suggesting that jacobsen epoxidation is still a field of intense current research. Currently there are several accepted theories about what happens in the transition state, based on stereo electronic arguments[26][24] . Therefore, the results obtained here will depend on what was assumed when the transition state geometries were drawn and optimised. From the results obtained it seems like not all the factors which affect the approach of the alkene to the Mn=O species in the transition state were considered in the quantum mechnical calculations to give the experimetally observed results.
Overall comparing the two catalyst systems, it can be seen that the quantum mechanical calculations employed here are better at predicting the selectivity of the Shi catalyst than the Jacobsen. This however does not mean that the results obtained for the shi catalyst are in perfect agreement with experiment, it means that the quantum mechanical transition state assumptions made for the shi epoxidations are closer to reality than those made for jacobsen epoxidations.
Non-covalent Interactions (NCI) in the active site of the reaction transition state
Transition states of Shi epoxidation of Trans-β-methylstyrene is studied in this section.
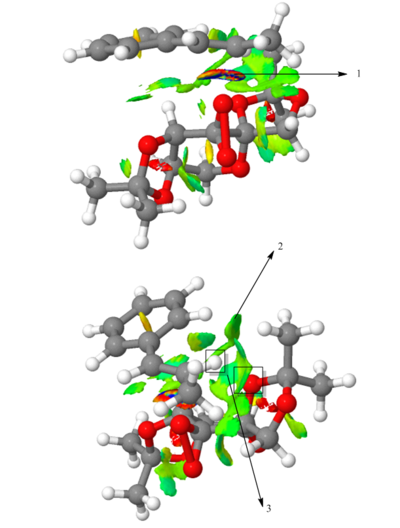
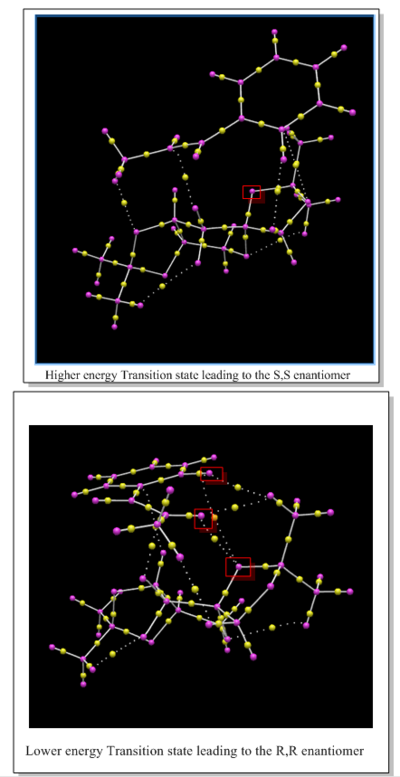
The above diagram shows non covalent interaction in one of the transition states of shi epoxidation of trans-beta-methyl styrene. The transition state (TS) above is the lowest energy TS and hence leads to the formation of the favoured R, R enantiomer which was predicted from the earlier transition state calculation ( see above section) and predicted theory which states that this is a spiro transition state. This NCI analysis was obtained by running calculations which filtered out the covalent interactions, to only shown non covalent interactions such as hydrogen bonds, lectrostatic attractions and Van der Waals/dispersion interactions. The different colours indicate whether an interaction is attractive or repulsive. Blue = strong attraction, Green = weak attraction, yellow = weak repulsion and red = strong repulsion.
An analysis of the active site between the catalyst and the trans-beta-methylstyrene is given below:
1. This is the epoxide bond forming part of the Transition state (between the dioxirane of the shi catalyst and and the trans-beta-methylstyrene double bond). This interaction can therefore be thought of as a half covalent interaction. Hence this cannot be thought of as a non covalent interaction.
2. In this part, there is a weakly attractive interaction between the non bonded hydrogens of the methyl groups of the methyl ketal group (of shi catalyst) and a phenyl hydrogen of trans-beta-methylstyrene. This is likely to be a weak VDWs attraction.
3. The interaction seen (light blue) is between the oxygen lone pairs of the methyl ketal group oxygen (of shi catalyst) and a hydrogen of the trans-betamethyl styrene. This is strong attractive hydroogen bonding interaction (between O and H shown with the box around it).
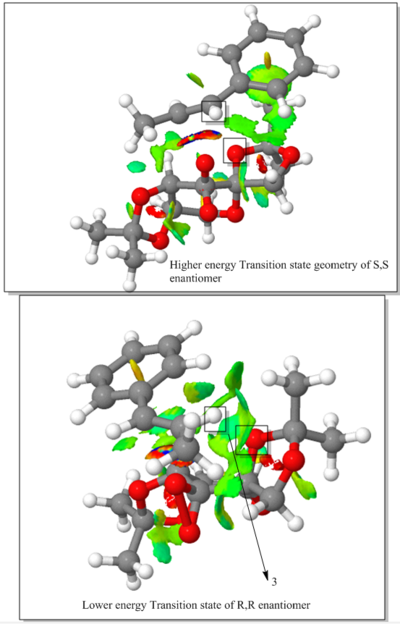
The interaction described in point 3 is overall stabilising the active site and hence the reason why this transition state leads to the formation of the the favoured R, R enantiomer and is the reason why it is lower in energy than the transition state geometry that leads to the formation of the S,S disfavoured enantiomer. It can be seen below that in this higher energy transition state geometry that leads to S,S enetiomer that this H-bonding interaction is not present. This is because, as predicted using theory, the orientation of the trans-beta-methyl styrene to the fructose catalyst is planar, which does not allow for this interaction between the hydrogen and the oxygen as before.
Electronic topology (QTAIM) in the active-site of the reaction transition state
Transition states of Shi epoxidation of Trans-β-methylstyrene is studied in this section.
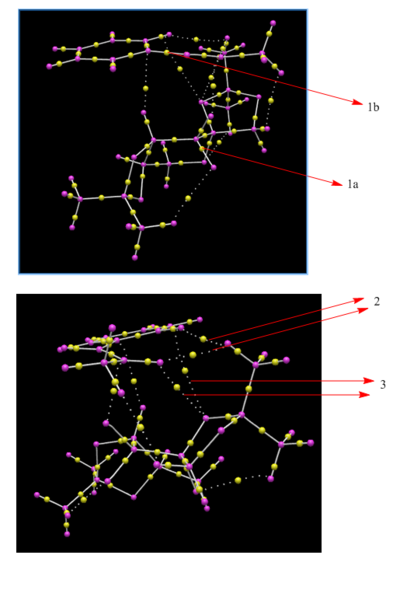
This technique is complimentary to the NCI technique above, as it also shows weak non covalent interactions between non bonded atoms. The diagram below shows the QTAIM for the lowest energy transition state geometry of the shi eposixdation of Trans-beta-methylstyrene. This Transition state leads to favoured R,R enantiomer. The most important information obtained from a QTAIM is the bond critical point (BCP) which corresponds to the point between two atoms where the shared electron density reaches a minimum (electron density goes to zero here). The BCP can correspond to covalent interactions and non-covalent interactions.
1a. Corresponds to a BCP associated with covalent interactions between a Carbon and Oxygen of the dioxirane unit of the catalyst. The relative position of the BCP is closer to the H than the oxygen. This makes sense in terms of the electronegativity of the atoms. Oxygen is much more elctronegative than hydrogen and hence in a covalent interaction where electron are shared, more electron density is likely to reside closer to the oxygen than the hydrogen. Therefore, since the BCP corresponds to the where the shared electron density is at a minimum, this is likely to occur closer to an electron positive atom than an electronegative atom .
1b. Corresponds to a BCP associated with a covalent interaction between two carbon atoms of the Trans-beta-methyl styrene. The relative position of this BCP is in the centre of the two carbon as expected since they have identical electronegativities.
2. This is interaction is same as the NCI interaction mentioned earlier (point 2 in NCI section). This is a VDWs type interaction between Hs of the catalyst and the trans-beta-methylstyrene. This is weakly attractive as predicted earlier with the NCI analysis.
3. Corresponds to a weak non covalent interaction between H (of trans-beta-methyl styrene) and O (of the shi catalyst). This interaction is the same as the NCI interaction mentioned earlier (point 3 in the NCI section). This is a stabilising Hydrogen bonding interaction. It can be seen that there are two specific H-bonding interactions here.
Using the earlier NCI analysis, it was not possible to see exactly how many of these interactions were present. This is the reason why QTAIM can be used as a complimentary technique with NCI to fully understand any stabilising interactions present in active sites of transition states, which can be used to explain any selectivity seen in the products. A combination of NCI and QTAIM can therfroe be used here to explain the selectivity seen in shi epoxidation of trasn-beta-methylstyrene, where good enantiomeric excess of the R, R enantiomer was obtained computationally (see transition state section). As explained earlier in the NCI analysis, the higher energy transition state that leads to the S, S enantiomer contained no stabilising H-bonding interactions in the active site and hence this was predicted as the reason for its higher energy. This can be confirmed using QTAIM analysis of this higher energy transition state. Below is a comparision of the QTAIM analysis of the higher and lower energy transition state geometries that lead to the S,S and R,R geometries respectively. It can be confirmed using this that there are no stabilising hydrogen bonding interactions present in the higher energy transition state as predicted by the NCI analysis. In additon, it can also be seen that the lower energy Transition state has more weak attractive non covalent interaction than the higher energy Transition state as expected. Therefore, the prediction made using the NCI analysis which stated that this extra stabilising interactions leads to a lower energy transition state and hence the enantiomer associated with this transition state will be formed in excess (the R, R enantiomer), which agrees with the ee calculated and with literature.
References
- ↑ S. D. Kahn , W. J. Hehre, J. Am. Chem. Soc.,, 1987, 109, 663–666, DOI: 10.1021/ja00237a004
- ↑ P. V. Alston , R. M. Ottenbrite , T. Cohen, J. Org. Chem.,, 1978, 43, 1864–1867, DOI: 10.1021/jo00404a003
- ↑ M. A. Fox , R. Cardona , N. J. Kiwiet, J. Org. Chem.,, 1987, 52, 1469–1474, DOI: 10.1021/jo00384a016
- ↑ 4.0 4.1 D.Skala, J. Hanika, Kinetics of Cyclopentadiene Hydrogenation using PD/C Catalayst, Petroleum and coal, 2003, Vol 45, 3-4. Online:http://www.vurup.sk/sites/vurup.sk/archivedsite/www.vurup.sk/pc/vol45_2003/issue3-4/pdf/05.pdf (accessed December 2014)
- ↑ 5.0 5.1 S. S. Batsanov, Inorganic Materials., 2001 37, 871–885,online: http://link.springer.com/article/10.1023%2FA%3A1011625728803 (accessed December 2014)
- ↑ H. S. Rzepa , Conformational Analysis, 2010-2014, online: http://www.ch.ic.ac.uk/local/organic/conf/c1_rings.html (accessed December 2014)
- ↑ A. B. McEwen , P. v. R. Schleyer, J. Am. Chem. Soc.,, 1986, 108, 3951–3960, DOI: 10.1021/ja00274a016
- ↑ 8.0 8.1 John R. Wiseman , Wayne A. Pletcher, J. Am. Chem. Soc., 1970, 92 (4), pp 956–962 DOI: 10.1021/ja00707a035
- ↑ W. F. Maier, P. Von Rague Schleyer, J. Am. Chem. Soc., 1981, 103, 1891. DOI:10.1021/ja00398a003
- ↑ 10.0 10.1 10.2 10.3 Spectroscopic data: L. Paquette, N. A. Pegg, D. Toops, G. D. Maynard, R. D. Rogers, J. Am. Chem. Soc.,, 1990, 112, 277-283. DOI:10.1021/ja00157a043
- ↑ P. H. Willoughby, M. J. Jansma, T. R. Hoye, Nature Protocols, 9, 2014, 643-660 doi:10.1038/nprot.2014.042
- ↑ 12.0 12.1 12.2 12.3 12.4 P. C. Bulman Pagea,P. Parkerb,B. R. Buckleyb,G. A. Rassiasc,D. Bethelld, Organocatalysis of asymmetric epoxidation by iminium salts using sodium hypochlorite as the stoichiometric oxidant tetrahedron, 2009, 65, 2910-2915.doi:10.1016/j.tet.2009.02.007
- ↑ Z. Wang, L. Shu, M. Frohn, Y. Tu, and Y. Shi, Org. Synth. 2003, 80, 9.DOI: 10.15227/orgsyn.080.0009
- ↑ P. Besse, M. F. Renard, H. Veschambre, Chemoenzymatic synthesis of chiral epoxides. Preparation of 4-phenyl-2,3-epoxybutane and 1-phenyl-1,2-epoxypropane tetrahedron, 1994, 5, 1249-1268. doi:10.1016/0957-4166(94)80167-3
- ↑ A. Wong , B. Wang , M. Zhao and Y. Shi *, J. Org. Chem. 2009, 74, 6335–6338. DOI: 10.1021/jo900739q
- ↑ 16.0 16.1 spincotech, Studying Chirality with Vibrational Circular Dichroism (VCD), online:http://www.spincotech.com/llp/Applications/VCD.pdf (accessed December 2014)
- ↑ H. Sasaki1, R. Irie, T. Hamada, K. Suzukia, T. Katsuki, Rational design of Mn-salen catalyst (2): Highly enantioselective epoxidation of conjugated cis olefins, 1994, 50, 11827–11838. doi:10.1016/S0040-4020(01)89298-X
- ↑ D. R. Boyd, N. D. Sharma, R. Agarwal, N. A. Kerley, R. A. S. McMordie, A. Smith, H. Dalton, A. J. Blacker and G. N. Sheldrake J. Chem. Soc., Chem. Commun., 1994, 1693-1694. DOI: 10.1039/C39940001693
- ↑ G. Glockler, J. Phys. Chem.,, 1958, 62, 1049-1054, DOI: 10.1021/j150567a006
- ↑ O. A. Wong and Y. Shi, Chem. Rev. , 2008, 108, 3958-3987, DOI: 10.1021/cr068367v
- ↑ Y. Tu , Z. Wang , and Y. Shi, J. Am. Chem. Soc. , 1996, 118, 9806–9807, DOI: 10.1021/ja962345g
- ↑ 22.0 22.1 Z. Wang, Y. Tu, M. Frohn, J. Zhang, and Y. Shi J. Am. Chem. Soc,, 1997, 119, 11224-1123. DOI: 10.1021/ja972272g
- ↑ 23.0 23.1 T. Katsuki Coordination Chemistry Reviews,, 1995, 140, 189-214.doi:10.1016/0010-8545(94)01124-T
- ↑ 24.0 24.1 E. M. McGarrigle and D. G. Gilheany, Chem. Rev. , 2005, 105, 1563-1602.DOI: 10.1021/cr030694g
- ↑ W. Zhang , J. L. Loebach, S. R. Wilson ,Eric N. Jacobsen., J. Am. Chem. Soc. , 1990, 112, 2801–2803.DOI: 10.1021/ja00163a052
- ↑ L. Kürti , M. M. Blewett and E. J. Corey., Org. Lett. , 2009, 11, 4592–4595, DOI: 10.1021/ol901859d

