Rep:Mod:Rachel Gregory
Introduction
In this computational study of inorganic molecules GaussView 5.0 was used to build and analyse inorganic molecules using different optimisation methods and varying basis sets. In some cases, more computational power was needed and so GaussView 5.0 was used to make input files for submission to the High Powered Computer (HPC).
Infrared spectra of the inorganic molecules were predicted; molecular orbitals (MOs) and natural bonding orbitals (NBOs) were analysed to determine bonding interactions. In some cases, the computed MOs were compared to orbitals derived from the Linear Combination of Atomic Orbitals (LCAO).
Energy calculations have an error of approximately 10 kJ mol1 (0.0038 atomic units). Dipole moment calculations are accurate to 0.01 Debye. The methods used for determining frequency have an error of 10% due to a harmonic approximation being used for anharmonic vibrations. Intensities are rounded to the nearest whole integer. Bond distances are accurate to approximately 0.01 Å and bond angles are accurate to 0.1°. The optimisation was determined to be complete once the gradient was < 0.001. The gradient is the root mean squared (RMS) and tends to zero as the minimum energy conformation is approached.
BH3
BH3 Optimisation
BH3 3-21G optimisation
BH3 was drawn in GaussView5.0 with D3h geometry and bond lengths of 1.5Å. Optimisation was run using the B3LYP method and 3-21G basis set. This generated a .log file.
| BH3 | ||||
|---|---|---|---|---|
| ||||
| More Info | ||||
| File | .log | |||
| Calculation Type | FOPT | |||
| Calculation Method | B3LYP | |||
| Basis Set | 3-21G | |||
| Final energy/au | -26.38296912 | |||
| Gradient/au | 0.00020672 | |||
| Dipole Moment | 0.00 | |||
| Point Group | D3h | |||
| Calculation time | 0 days 0 hours 0 minutes 9.0 seconds. | |||
| H-B-H bond angle/° | 120.0 | |||
| H-B bond length/Å | 1.19 | |||
        Item               Value     Threshold  Converged?
Maximum Force            0.000413     0.000450     YES
RMS     Force            0.000271     0.000300     YES
Maximum Displacement     0.001610     0.001800     YES
RMS     Displacement     0.001054     0.001200     YES
Predicted change in Energy=-1.071764D-06
Optimization completed.
   -- Stationary point found.
                          ----------------------------
                          !   Optimized Parameters   !
                          ! (Angstroms and Degrees)  !
--------------------------                            --------------------------
! Name  Definition              Value          Derivative Info.                !
--------------------------------------------------------------------------------
! R1    R(1,2)                  1.1935         -DE/DX =    0.0004              !
! R2    R(1,3)                  1.1935         -DE/DX =    0.0004              !
! R3    R(1,4)                  1.1935         -DE/DX =    0.0004              !
! A1    A(2,1,3)              120.0            -DE/DX =    0.0                 !
! A2    A(2,1,4)              120.0            -DE/DX =    0.0                 !
! A3    A(3,1,4)              120.0            -DE/DX =    0.0                 !
! D1    D(2,1,4,3)            180.0            -DE/DX =    0.0                 !
--------------------------------------------------------------------------------
GradGradGradGradGradGradGradGradGradGradGradGradGradGradGradGradGradGrad
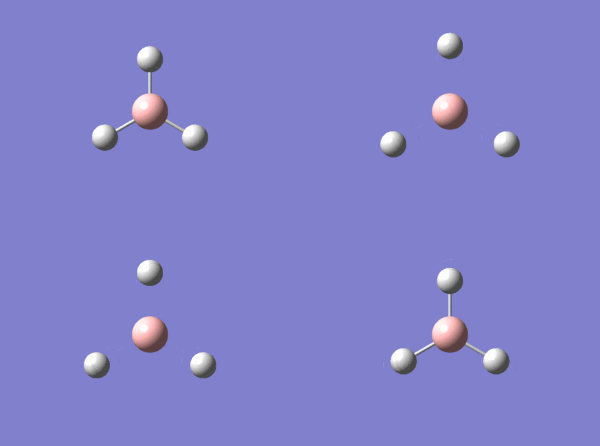
There are no bonds shown in the final structure because the bond distances obtained by the optimisation are longer than the pre-determined maximum B-H bond length defined by GaussView. For my definition of a bond see What is a bond?.
BH3 6-31G (d,p) optimisation
The optimised geometry obtained above was used to start a new optimisation using a higher level basis set, the 6-31G (d,p) set, and a new log file was generated.
| BH3 | ||||
|---|---|---|---|---|
| ||||
| More Info | ||||
| File Type | .log | |||
| Calculation Type | FOPT | |||
| Calculation Method | RB3LYP | |||
| Basis Set | 6-31G (d,p) | |||
| Final energy/au | -26.61532374 | |||
| Gradient/au | 0.00000295 | |||
| Dipole Moment | 0.00 | |||
| Point Group | Cs | |||
| Calculation time | 0 days 0 hours 0 minutes 5.0 seconds. | |||
| H-B-H bond angle/° | 120.0 | |||
| H-B bond length/Å | 1.19 | |||
       Item               Value     Threshold  Converged?
Maximum Force            0.000006     0.000450     YES
RMS     Force            0.000004     0.000300     YES
Maximum Displacement     0.000024     0.001800     YES
RMS     Displacement     0.000015     0.001200     YES
Predicted change in Energy=-1.980694D-10
Optimization completed.
   -- Stationary point found.
                          ----------------------------
                          !   Optimized Parameters   !
                          ! (Angstroms and Degrees)  !
--------------------------                            --------------------------
! Name  Definition              Value          Derivative Info.                !
--------------------------------------------------------------------------------
! R1    R(1,2)                  1.1923         -DE/DX =    0.0                 !
! R2    R(1,3)                  1.1923         -DE/DX =    0.0                 !
! R3    R(1,4)                  1.1923         -DE/DX =    0.0                 !
! A1    A(2,1,3)              120.0002         -DE/DX =    0.0                 !
! A2    A(2,1,4)              120.0002         -DE/DX =    0.0                 !
! A3    A(3,1,4)              119.9997         -DE/DX =    0.0                 !
! D1    D(2,1,4,3)            180.0            -DE/DX =    0.0                 !
--------------------------------------------------------------------------------
GradGradGradGradGradGradGradGradGradGradGradGradGradGradGradGradGradGrad
The bond length found of 1.19Å is longer than literature values for the BH bond in BH3 containing molecules, such as BH3CN where the measured bond angle is 1.12Å [1]
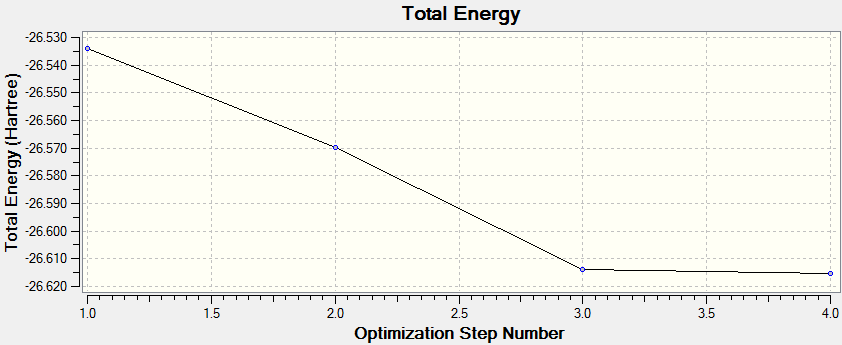
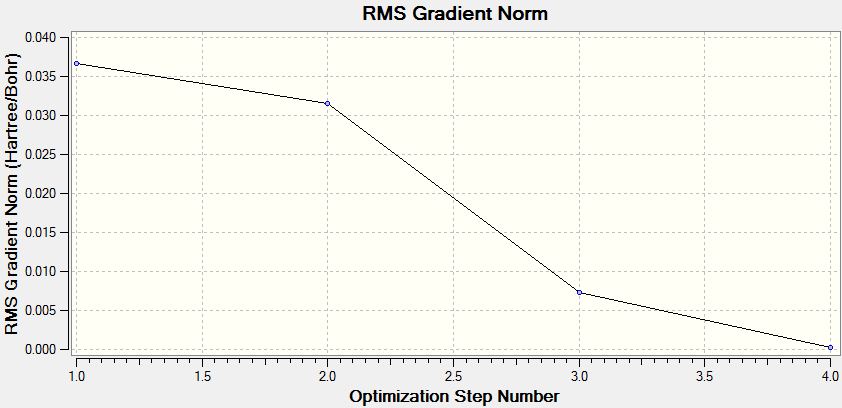
BH3 The Optimisation Process
The optimisation is deemed to be successful when all parameters have converged and a stationary point is found.
BH3 Frequency Analysis
BH3 was redrawn in GaussView using the software's pre-determined bond lengths. The molecule was optimised using the 3-21G optimisation method followed by the 6-31G (d,p) method, the .log file can be found here. Frequency analysis was then run. The energy of the molecule was found to be lower than before on several repeats. This is due to a local minimum energy structure being found previously in the 6-31G (d,p) optimisation but the global minimum energy structure being found in this optimisation. This is confirmed by the low frequencies being the region from -10 to +10.
| BH3 | |
|---|---|
| More Info | |
| File Type | .log |
| Calculation Type | FREQ |
| Calculation Method | RB3LYP |
| Basis Set | 6-31G (d,p) |
| Final energy/au | -26.61532363 |
| Gradient/au | 0.00000480 |
| Dipole Moment | 0.00 |
| Point Group | C3h |
| Calculation time | 0 days 0 hours 0 minutes 7.0 seconds. |
| H-B-H bond angle/° | 120.0 |
| H-B bond length/Å | 1.19 |
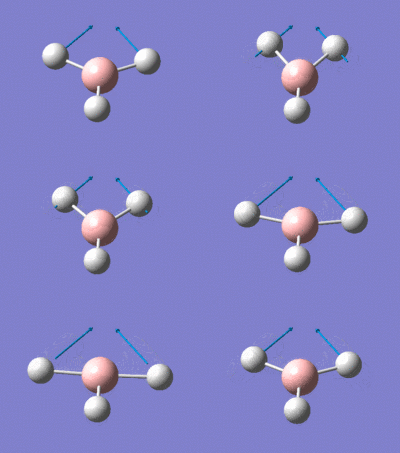
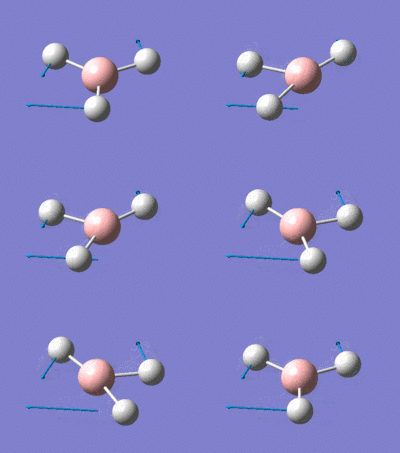
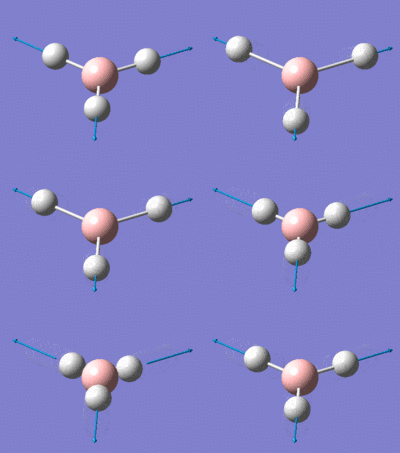
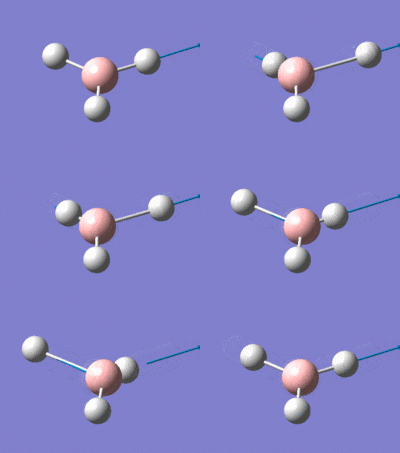
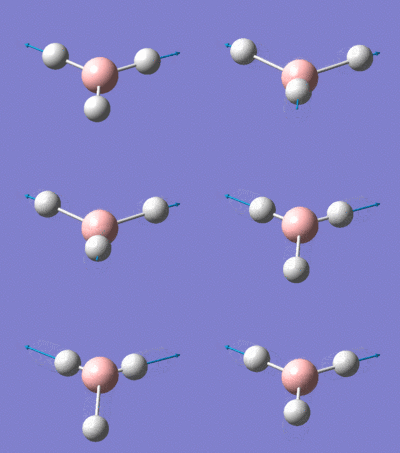
The .log file from the calculation was opened and the vibrations calculated were analysed.
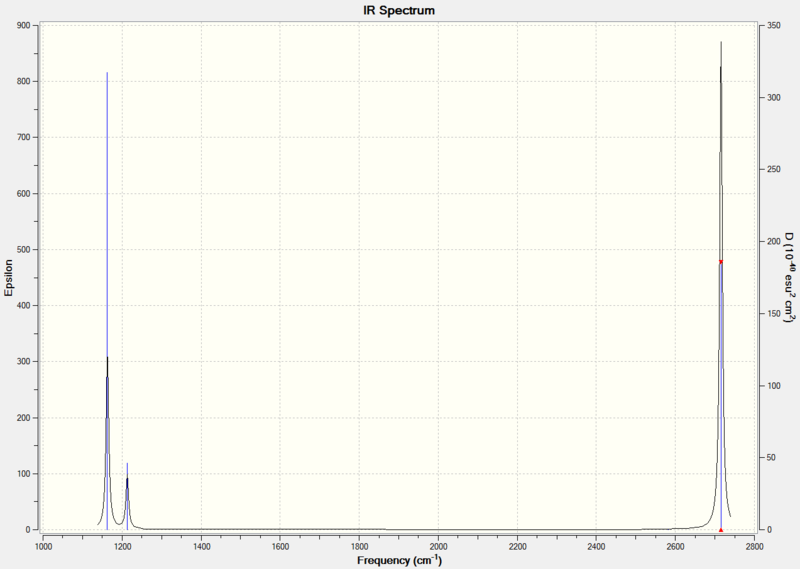
What Makes Vibrational Modes IR Active?
For a vibrational mode to be IR active, there must be a net change in dipole moment of the molecule. Totally symmetric vibrations do not result in a dipole moment and so they have an intensity of zero.
BH3: Population Analysis
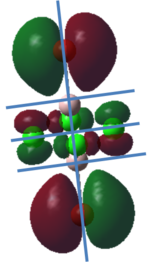
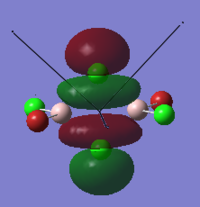
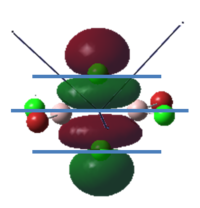
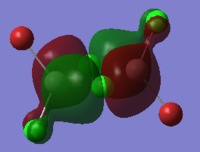
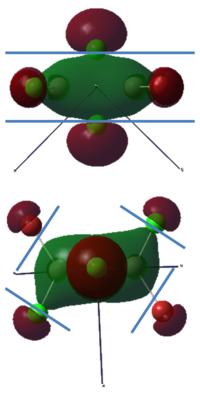
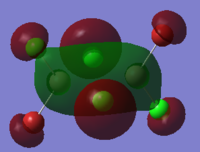
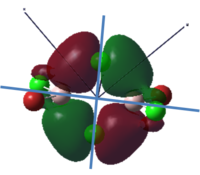
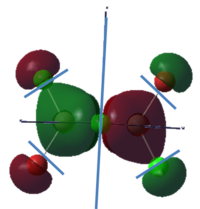
To calculate the BH3 MOs the optimised .chk file was opened. The calculation was run using the energy method. MO analysis was switched on using "pop=full" in the keywords section and Full NBO analysis was undertaken. The calculation was run in GaussView5.0. The .chk file was then opened and the MOs visualised. The core MO (the 1a1' MO) is not shown in the molecular orbital diagram below:
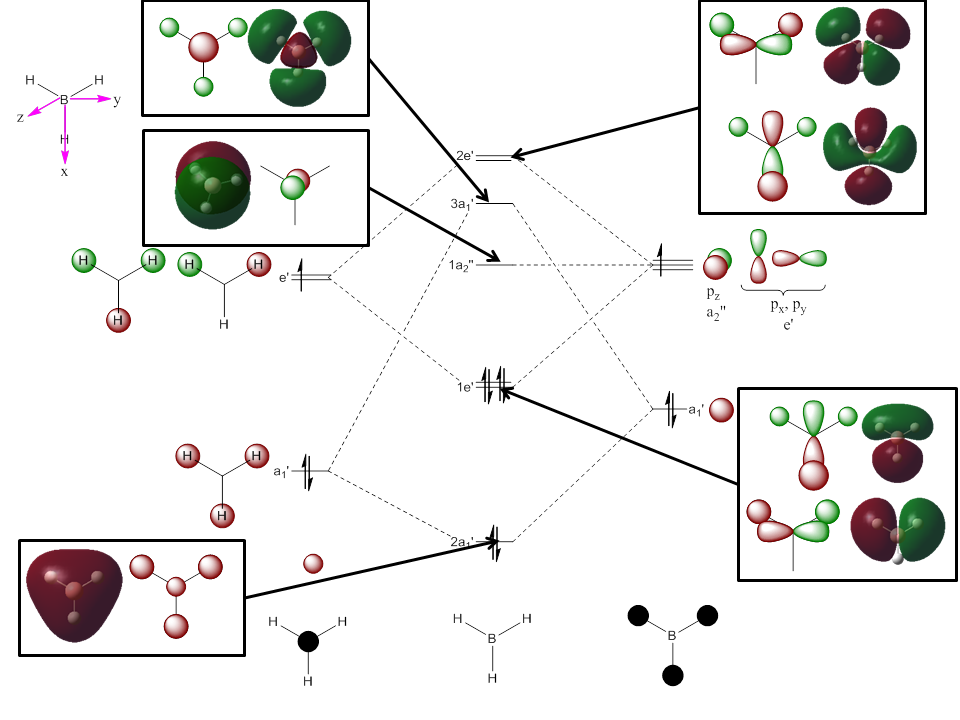
The Linearly Combined Atomic Orbitals (LCAOs) are much less diffuse than the projections generated by GaussView, but the same general changes in phase, nodal planes and shape of orbitals are observed. The 2a1' MO is more diffuse than the corresponding LCAO, with the MO spreading over all space between the atoms but the LCAO is localised on each atom. The doubly degenerate 1e' MOs are again more diffuse, and the MO with the xz nodal plane spreads further in the positive x direction than the LCAO. The red part of the MO with the nodal plane in the xz direction is more diffuse and more spherical than the LCAO. The 1a2" MO is much more diffuse and spreads across the whole molecule, above and below the plane of the molecule, whereas the LCAO is centred on the boron atom. The 3a1' MO has lobes of a different shape to the LCAO. The LCAO lobes are spherical, whereas those centred on the H atoms in the MO are hemispherical and the lobe centred on the B atom is more like a triangular prism. The 2e' MO shown on the top right has similar orbitals on the H atoms, but the p atomic orbital lobes on the B atom are twisted away from the lobes on the H atoms. The LCAO/MO combination below shows the second 2e' orbital. The MO and LCAO are very similar, but the red lobes in the MO extend further from the atoms than in the LCAO.
TlBr3
TlBr3 Optimisation
Thallium (III) bromide is an unstable compound which disproportionates to TlBr2 at temperatures less than 40°C. [2]
Thallium is also highly toxic and so computational analysis of thallium compounds is much safer than experimental work. Thallium has 81 electrons and bromine 35 electrons and both thallium and bromine show relativistic effects which are not demonstrated by the standard Schrödinger equation. A pseudo-potential allows some of these relativistic effects to be recovered. In the calculations here, the valence electrons and core electrons are separated because most of chemistry is based on the assumption that the valence electrons are responsible for the majority of bonding character and so the core electrons are modelled by a pseudo-potential (PP) or an effective core potential (ECP).
TlBr3 was drawn in GaussView. The optimisation was run using the DFT B3LYP method and using the LanL2DZ basis set, which uses the medium level D95V basis set on first row atoms and Los Alamos ECP (pseudo potentials) on heavier elements. The calculation was run on the HPC service. The completed TlBr3 optimisation was deposited to "D-Space" and can be found at DOI:10042/23388 .
| TlBr3 | ||||
|---|---|---|---|---|
| ||||
| More Info | ||||
| File Type | .log | |||
| Calculation Type | FOPT | |||
| Calculation Method | RB3LYP | |||
| Basis Set | LANL2DZ | |||
| Final energy/au | -91.21812851 | |||
| Gradient/au | 0.00000090 | |||
| Dipole Moment | 0.00 | |||
| Point Group | D3h | |||
| Calculation time | 0 days 0 hours 0 minutes 27.9 seconds. | |||
| H-B-H bond angle/° | 120.0 | |||
| Tl-Br bond length/Å | 2.65 | |||
The bond length found is 7.9% longer than literature values, which using the Hartree Fock method of optimisation give a bond length of 2.457Å and using the MP4 method give 2.472Å. Experimental values are in the region of 2.51Å [3]. .
        Item               Value     Threshold  Converged?
Maximum Force            0.000002     0.000450     YES
RMS     Force            0.000001     0.000300     YES
Maximum Displacement     0.000022     0.001800     YES
RMS     Displacement     0.000014     0.001200     YES
Predicted change in Energy=-6.083996D-11
Optimization completed.
   -- Stationary point found.
                          ----------------------------
                          !   Optimized Parameters   !
                          ! (Angstroms and Degrees)  !
--------------------------                            --------------------------
! Name  Definition              Value          Derivative Info.                !
--------------------------------------------------------------------------------
! R1    R(1,2)                  2.651          -DE/DX =    0.0                 !
! R2    R(1,3)                  2.651          -DE/DX =    0.0                 !
! R3    R(1,4)                  2.651          -DE/DX =    0.0                 !
! A1    A(2,1,3)              120.0            -DE/DX =    0.0                 !
! A2    A(2,1,4)              120.0            -DE/DX =    0.0                 !
! A3    A(3,1,4)              120.0            -DE/DX =    0.0                 !
! D1    D(2,1,4,3)            180.0            -DE/DX =    0.0                 !
--------------------------------------------------------------------------------
GradGradGradGradGradGradGradGradGradGradGradGradGradGradGradGradGradGrad
The Tl-Br bond length calculated of 2.65Å is longer than literature values for other compounds containing the TlBr3 fragment, where bond lengths are in the region of 2.55Å [4]. This is expected because these compounds contain anionic fragments.
TlBr3 Frequency Analysis
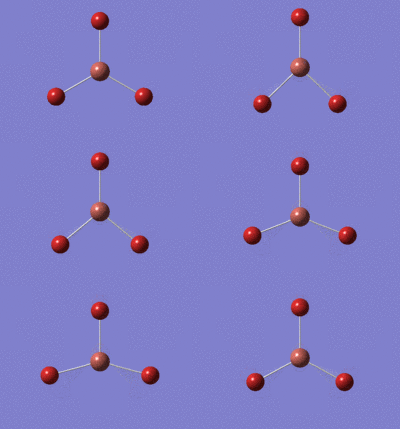
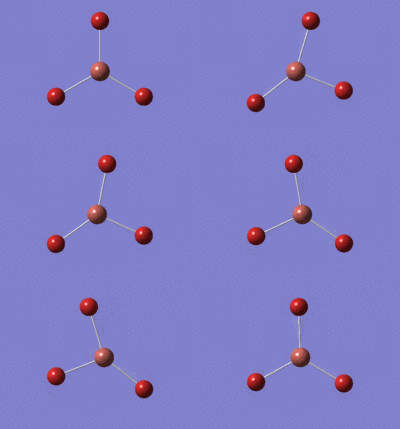
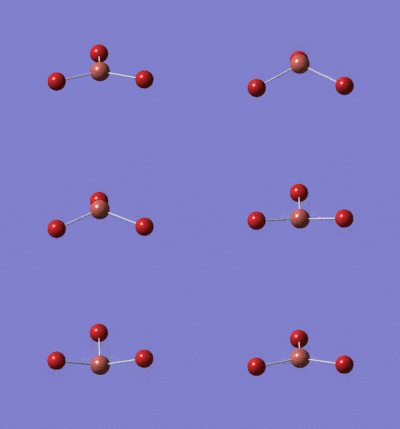
The optimised structure of TlBr3 obtained above was confirmed by carrying out a frequency analysis using the HPC. The completed frequency analysis is at DOI:10042/23435 . The two low frequency lines are shown below.
Low frequencies --- -3.4213 -0.0026 -0.0004 0.0015 3.9367 3.9367
Low frequencies --- 46.4289 46.4292 52.1449

BBr3
BBr3 Optimisation
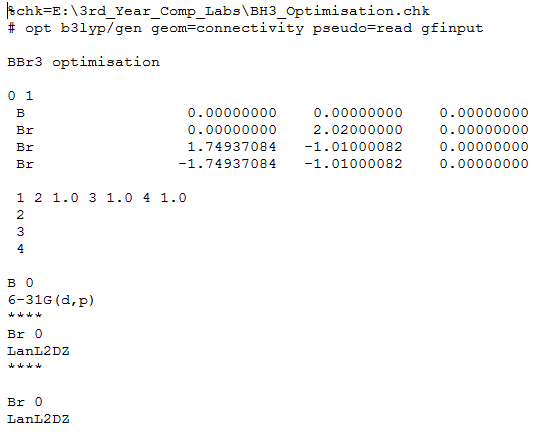
BBr3 was drawn in GaussView and based on the 6-31G(d,p)optimised log file for BH3. The GEN basis option was used so that the basis set for each individual atom can be chosen. The text input file was edited to choose the basis set for each atom, and read as follows:
The completed optimisation file can be found at DOI:10042/23393
| BBr3 | ||||
|---|---|---|---|---|
| ||||
| More Info | ||||
| File | .log | |||
| Calculation Type | FOPT | |||
| Calculation Method | B3LYP | |||
| Basis Set | Gen | |||
| Final energy/au | -64.43645296 | |||
| Gradient/au | 0.00000382 | |||
| Dipole Moment | 0.00 | |||
| Point Group | D3h | |||
| Calculation time | 0 days 0 hours 0 minutes 9.0 seconds. | |||
| Br-B-Br bond angle/° | 120.0 | |||
| Br-B bond length/Å | 1.93 | |||
       Item               Value     Threshold  Converged?
Maximum Force            0.000008     0.000450     YES
RMS     Force            0.000005     0.000300     YES
Maximum Displacement     0.000036     0.001800     YES
RMS     Displacement     0.000023     0.001200     YES
Predicted change in Energy=-4.026779D-10
Optimization completed.
   -- Stationary point found.
                          ----------------------------
                          !   Optimized Parameters   !
                          ! (Angstroms and Degrees)  !
--------------------------                            --------------------------
! Name  Definition              Value          Derivative Info.                !
--------------------------------------------------------------------------------
! R1    R(1,2)                  1.934          -DE/DX =    0.0                 !
! R2    R(1,3)                  1.934          -DE/DX =    0.0                 !
! R3    R(1,4)                  1.934          -DE/DX =    0.0                 !
! A1    A(2,1,3)              120.0            -DE/DX =    0.0                 !
! A2    A(2,1,4)              120.0            -DE/DX =    0.0                 !
! A3    A(3,1,4)              120.0            -DE/DX =    0.0                 !
! D1    D(2,1,4,3)            180.0            -DE/DX =    0.0                 !
--------------------------------------------------------------------------------
GradGradGradGradGradGradGradGradGradGradGradGradGradGradGradGradGradGrad
The calculated Br-B bond length of 1.93Å is close to literature values for the B-Br bond of compounds containing the BBr3 group, of 1.96Å [5].
Comparison of Bond Lengths of BH3, BBr3 and TlBr3
| Molecule | B-L Bond Length/Å |
|---|---|
| BH3 | 1.19 |
| BBr3 | 1.93 |
| TlBr3 | 2.65 |
As the ligand changes from H and Br and increases in van der Waals radius from 1.20Å to 1.85Å [6] the bond length increases. The bond length increase is 0.74Å, 0.09Å larger than the increase in van der Waals radius. This is because the B-Br orbital overlap is worse than for B-H because the Br p orbitals are larger and more diffuse than the H 1s orbital and so overlap is poorer, resulting in a longer, weaker bond. Hydrogen and bromine both have one singly occupied orbital in their outer shell and so form one strongly dative covalent bond with another atom. The boron-hydrogen bond has a bond enthalpy of 330 kJ/mol[7]
Boron and thallium are both Group 13 elements with one electron occupying the p orbitals. They both can form three covalent bonds. Changing the central atom from boron (second row, [He], 2s2, 2p1) to thallium (sixth row, [Xe], 4f14 5d10 6s2 6p1) also results in the bond lengthening. Thallium has a van der Waals radius of 1.96Å compared to boron which has a van der Waals radius of 1.80Å. The boron-bromine bond has a bond dissociation energy of 435 kJ/mol[7] and the thallium-bromine bond has a bond dissociation energy of 333.9 kJ/mol[7]. The difference in bond length and bond dissociation energy here is primarily due to poorer orbital overlap or Tl-Br and B-Br due to the significant difference in size. Thallium is larger and so the bonding 6p orbitals are more diffuse which results in poorer overlap with Br and so the bonds are weaker than for boron.
What is a bond?
GaussView does not always show a physical bond between two atoms when calculations have been completed.This is because the computed electron density across the physical space between the atoms is less than the predetermined value set by GaussView. In addition, if nodes are computed to be between two atoms then no bond will be drawn or if the bond is deemed to be ionic in nature then a physical bond will not be drawn and instead a positive and negative ion will be drawn.
Comparison of Vibrational Frequencies for BH3 and TlBr3
| Vibration Number | BH3 | TlBr3 | ||||
| Frequency cm-1 | Intensity | Symmetry | Frequency/ cm-1 | Intensity | Symmetry | |
| 1 | 1162.98 | 92.5497 | A2" | 46.43 | 3.6867 | E' |
| 2 | 1213.17 | 14.0545 | E' | 46.43 | 3.6867 | E' |
| 3 | 1213.18 | 14.0581 | E' | 52.14 | 5.8466 | A2" |
| 4 | 2582.32 | 0.0000 | A1' | 165.27 | 0.0000 | A1' |
| 5 | 2715.5 | 126.3285 | E' | 210.69 | 25.483 | E' |
| 6 | 2715.5 | 126.3189 | E' | 210.69 | 25.4797 | E' |
The TlBr3 vibrational frequencies are an order of magnitude lower than those of BH3 indicating that the bonds are much weaker. The vibrational frequency (in wavenumbers), ν, is related to the reduced mass, μ, as shown below:
Where
ν = vibrational frequency (cm-1, c = speed of light, 3•108 ms-1 k = force constant, μ = reduced mass (g), m1 = mass of atom 1 (g)
Hence, the reduced mass for the B-H bond is 0.92 g and for the Tl-Br bond is 57.4 g. The reduced mass is inversely proportional to the vibrational frequency and so the vibrational frequency of the Tl-Br bond will be significantly lower than the vibrational frequency for the B-H bond.
Both spectra show three peaks due to the vibrational modes discussed above. The vibrational modes have different relative energies in BH3 and TlBr3. In BH3 the A2" vibrational mode is lowest in energy but in TlBr3 the A2" vibrational mode is the third lowest in energy. In both molecules the A1'vibrational mode is the fourth lowest in energy and has an intensity of zero because it has no overall dipole moment and so is IR inactive. The reordering of energies may be due to the change in reduced mass. Changing the reduced mass affects the force required to cause the vibration and so the energy will also change.
Despite the change in order of energies, the vibrational modes have the same order of intensity in both molecules, with the A2" being the least intense IR active stretch, followed by the pair of E' vibration modes at the lower wavenumber and then the pair of E' vibrational modes at the higher wavenumber.
In the TlBr3 spectrum the two peaks at lower wavenumbers overlap, this is not observed in the BH3 spectrum.
The same method and basis set must be used for both the optimisation and frequency analysis calculations because, as found in the initial optimisation of BH3, the final optimised energy is highly dependent on these. To compare the spectra of two molecules the same method and basis set must be used on all atoms throughout the optimisation and frequency calculations.
Carrying out a frequency analysis allows the bond strengths and vibrational modes to be calculated. In addition, modes which are not immediately apparent on an IR spectrum due to overlapping can be analysed.
For a molecule of N atoms there are 3N-6 vibrational modes. To calculate the vibration modes a matrix of dimension (3N-6) is diagonalised. When running the calculations Gaussian uses a matrix of dimension 3N and as a result there are six additional "modes" displayed. These modes correspond to the frequency for translating the molecule in each of the x, y and z directions and rotating the molecule about each of the cartesian axes. Ignoring The Theory of Relativity, the value of these frequencies should be zero as no energy is required. Slight inaccuracies in the calculation parameters result in the low frequencies deviating a small amount from zero.
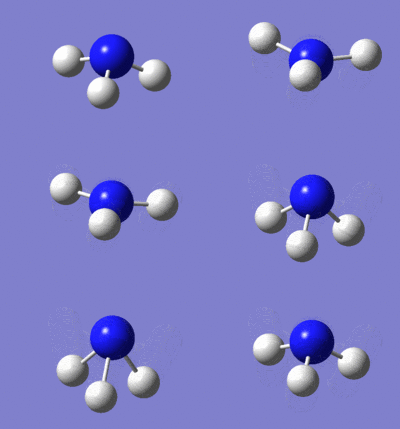
NH3
NH3 Optimisation
NH3 was constructed in GaussView and optimised using the 6-31G(d, p) basis set as shown below. The log file can be found here. All parameters have converged so the optimisation is deemed to be complete.
| NH3 | ||||
|---|---|---|---|---|
| ||||
| More Info | ||||
| File | .log | |||
| Calculation Type | FOPT | |||
| Calculation Method | RB3LYP | |||
| Basis Set | 6-31G(d, p) | |||
| Final energy/au | -56.55776856 | |||
| Gradient/au | 0.00000885 | |||
| Dipole Moment/Debye | 1.8464 | |||
| Point Group | C1 | |||
| Calculation time | 0 days 0 hours 0 minutes 16.0 seconds. | |||
| H-N-H bond angle/° | 105.7 | |||
| H-N bond length/Å | 1.02 | |||
      Item               Value     Threshold  Converged?
Maximum Force            0.000024     0.000450     YES
RMS     Force            0.000012     0.000300     YES
Maximum Displacement     0.000079     0.001800     YES
RMS     Displacement     0.000053     0.001200     YES
Predicted change in Energy=-1.629729D-09
Optimization completed.
   -- Stationary point found.
                          ----------------------------
                          !   Optimized Parameters   !
                          ! (Angstroms and Degrees)  !
--------------------------                            --------------------------
! Name  Definition              Value          Derivative Info.                !
--------------------------------------------------------------------------------
! R1    R(1,2)                  1.018          -DE/DX =    0.0                 !
! R2    R(1,3)                  1.018          -DE/DX =    0.0                 !
! R3    R(1,4)                  1.018          -DE/DX =    0.0                 !
! A1    A(2,1,3)              105.7413         -DE/DX =    0.0                 !
! A2    A(2,1,4)              105.7486         -DE/DX =    0.0                 !
! A3    A(3,1,4)              105.7479         -DE/DX =    0.0                 !
! D1    D(2,1,4,3)           -111.8631         -DE/DX =    0.0                 !
--------------------------------------------------------------------------------
GradGradGradGradGradGradGradGradGradGradGradGradGradGradGradGradGradGrad
The HN bond length calculated is 0.03Å shorter than literature references for NH bonds in compounds containing the NH3 fragment [8].
NH3 Frequency Analysis
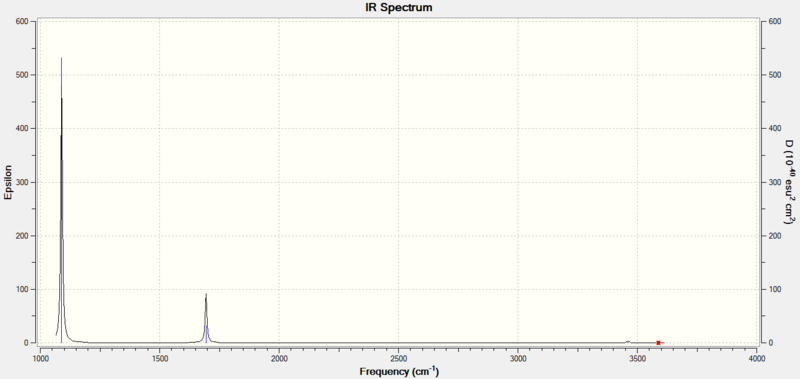
A frequency analysis was then carried out using the same basis set. The output file can be found here. The low frequencies are slightly outside the ± 15cm-1 window, this is due to minor inaccuracies in the calculation.
| NH3 | ||||
|---|---|---|---|---|
| ||||
| More Info | ||||
| File | .log | |||
| Calculation Type | FREQ | |||
| Calculation Method | RB3LYP | |||
| Basis Set | 6-31G(d, p) | |||
| Final energy/au | -56.55776856 | |||
| Gradient/au | 0.00000888 | |||
| Dipole Moment/Debye | 1.8464 | |||
| Point Group | C1 | |||
| Calculation time | 0 days 0 hours 0 minutes 10.0 seconds. | |||
| H-N-H bond angle/° | 105.7 | |||
| H-N bond length/Å | 1.02 | |||
Low frequencies ---  -30.7325    0.0008    0.0013    0.0017   20.2673   28.2766
Low frequencies --- 1089.5552 1694.1241 1694.1865
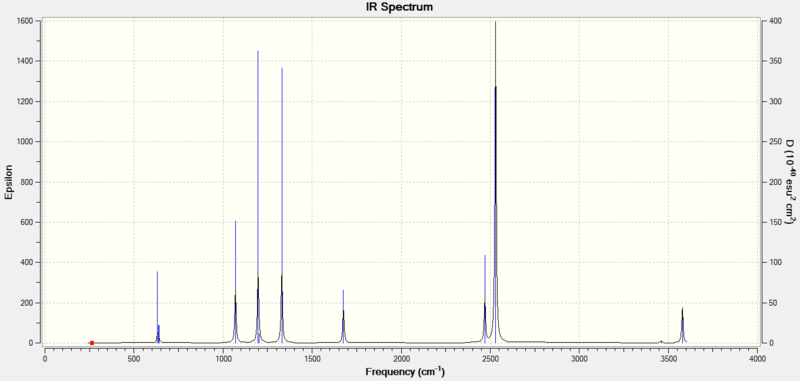
The IR spectrum is shown below:
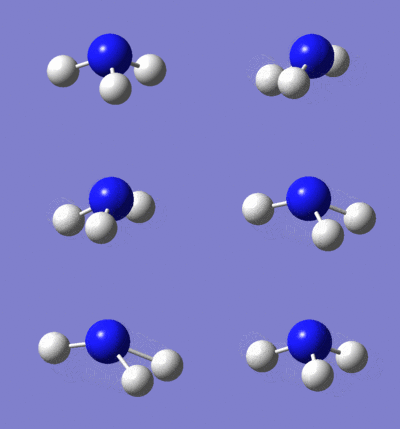
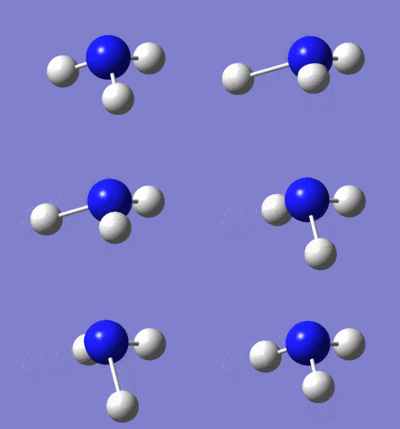
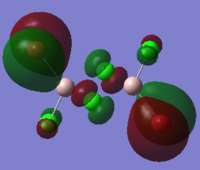
NH3 Population Analysis
A population analysis was run using the same method and basis set. The completed files can be found here and here.
| MO Number | Filled? | Diagram | MO Number | Filled? | Diagram |
|---|---|---|---|---|---|
| 1 | Yes | 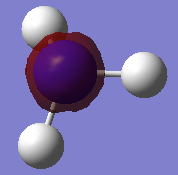 |
5 | Yes | 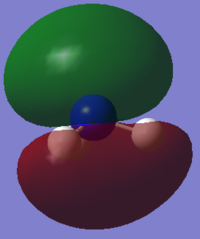
|
| 2 | Yes | 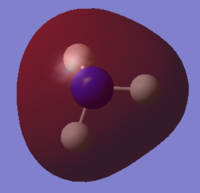 |
6 | No | 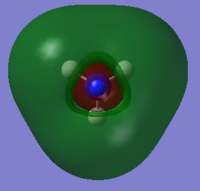
|
| 3 | Yes | 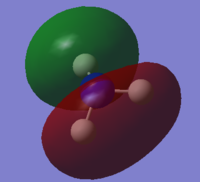 |
7 | No | 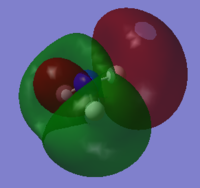
|
| 4 | Yes | 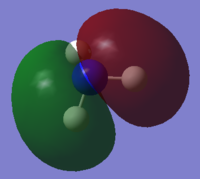 |
8 | No | 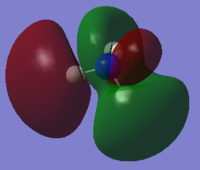
|
NH3 NBO Analysis
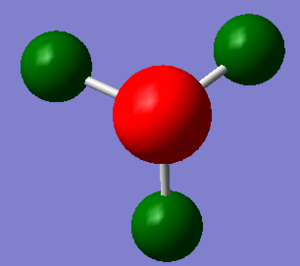
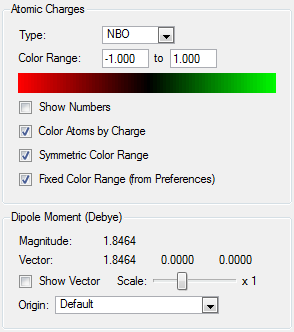
NBO analysis was run using the .log file from the NH3 population analysis above.
 |
 |

|
Association Energies: Ammonia-Borane
Ammonia-Borane Optimisation
Ammonia-borane was drawn in Gaussview and optimised using the 6-31G(d, p) basis set and the following .log file was generated as an output and showed that all parameters converged.
| NH3BH3 | ||||
|---|---|---|---|---|
| ||||
| More Info | ||||
| File | .log | |||
| Calculation Type | FOPT | |||
| Calculation Method | RB3LYP | |||
| Basis Set | 6-31G(d, p) | |||
| Final energy/au | -83.22468918 | |||
| Gradient/au | 0.00006806 | |||
| Dipole Moment/Debye | 5.5654 | |||
| Point Group | C1 | |||
| Calculation time | 0 days 0 hours 1 minutes 3.0 seconds. | |||
| Feature | Calculated Value | Literature Value |
|---|---|---|
| H-N-B bond angle/° | 105.7 | 110.4 [9] |
| H-N-H bond angle/° | 107.9 | 109.5 [9] |
| H-B-N bond angle/° | 104.6 | 108.1 [9] |
| H-B-H bond angle/° | 113.9 | 110.34 [9] |
| H-N bond length/Å | 1.02 | 1.0157 [10] |
| H-B bond length/Å | 1.21 | 1.2111 [10] |
| B-N bond length/Å | 1.67 | 1.6568 [10] |
       Item               Value     Threshold  Converged?
Maximum Force            0.000137     0.000450     YES
RMS     Force            0.000063     0.000300     YES
Maximum Displacement     0.000606     0.001800     YES
RMS     Displacement     0.000336     0.001200     YES
Predicted change in Energy=-1.994010D-07
Optimization completed.
   -- Stationary point found.
                          ----------------------------
                          !   Optimized Parameters   !
                          ! (Angstroms and Degrees)  !
--------------------------                            --------------------------
! Name  Definition              Value          Derivative Info.                !
--------------------------------------------------------------------------------
! R1    R(1,7)                  1.0186         -DE/DX =   -0.0001              !
! R2    R(2,7)                  1.0186         -DE/DX =   -0.0001              !
! R3    R(3,7)                  1.0186         -DE/DX =   -0.0001              !
! R4    R(4,8)                  1.2101         -DE/DX =   -0.0001              !
! R5    R(5,8)                  1.2101         -DE/DX =   -0.0001              !
! R6    R(6,8)                  1.2101         -DE/DX =   -0.0001              !
! R7    R(7,8)                  1.668          -DE/DX =   -0.0001              !
! A1    A(1,7,2)              107.87           -DE/DX =    0.0                 !
! A2    A(1,7,3)              107.8652         -DE/DX =    0.0                 !
! A3    A(1,7,8)              111.0329         -DE/DX =    0.0                 !
! A4    A(2,7,3)              107.8697         -DE/DX =    0.0                 !
! A5    A(2,7,8)              111.0286         -DE/DX =    0.0                 !
! A6    A(3,7,8)              111.0291         -DE/DX =    0.0                 !
! A7    A(4,8,5)              113.8693         -DE/DX =    0.0                 !
! A8    A(4,8,6)              113.8721         -DE/DX =    0.0                 !
! A9    A(4,8,7)              104.6003         -DE/DX =    0.0                 !
! A10   A(5,8,6)              113.8747         -DE/DX =    0.0                 !
! A11   A(5,8,7)              104.6003         -DE/DX =    0.0                 !
! A12   A(6,8,7)              104.5984         -DE/DX =    0.0                 !
! D1    D(1,7,8,4)           -179.9867         -DE/DX =    0.0                 !
! D2    D(1,7,8,5)            -59.9892         -DE/DX =    0.0                 !
! D3    D(1,7,8,6)             60.0135         -DE/DX =    0.0                 !
! D4    D(2,7,8,4)            -59.9839         -DE/DX =    0.0                 !
! D5    D(2,7,8,5)             60.0136         -DE/DX =    0.0                 !
! D6    D(2,7,8,6)           -179.9837         -DE/DX =    0.0                 !
! D7    D(3,7,8,4)             60.0161         -DE/DX =    0.0                 !
! D8    D(3,7,8,5)           -179.9864         -DE/DX =    0.0                 !
! D9    D(3,7,8,6)            -59.9837         -DE/DX =    0.0                 !
--------------------------------------------------------------------------------
GradGradGradGradGradGradGradGradGradGradGradGradGradGradGradGradGradGrad
Ammonia-Borane Frequency Analysis
A frequency analysis was run using the same basis set to ensure an energy minimum had been found, the .log file for which can be found at File:FREQUENCYANALYSIS6-31G RSG.LOG. The low frequencies are close to zero and so an energy minimum had been found.
| NH3BH3 | |
|---|---|
| More Info | |
| File | .log |
| Calculation Type | FREG |
| Calculation Method | RB3LYP |
| Basis Set | 6-31G(d, p) |
| Final energy/au | -83.22468916 |
| Gradient/au | 0.00006804 |
| Dipole Moment/Debye | 5.5654 |
| Point Group | C1 |
| Calculation time | 0 days 0 hours 0 minutes 56.0 seconds. |
Low frequencies ---   -0.0008    0.0002    0.0011   17.1081   22.5336   38.6872
Low frequencies ---  265.8461  632.3775  639.0682
The table below shows the infrared absorption frequencies. As expected there are 18 vibrations (3N-6, N=7). One of these vibrations does not result in a change in dipole moment and so is not IR active and so has zero intensity. The IR spectrum is also shown below.
| Frequency/cm-1 | Intensity |
|---|---|
| 265.85 | 0.0000 |
| 632.38 | 13.9932 |
| 639.07 | 3.5551 |
| 640.18 | 3.5566 |
| 1069.12 | 40.4883 |
| 1196.74 | 108.8580 |
| 1203.64 | 3.5213 |
| 1203.95 | 3.4780 |
| 1329.69 | 113.7038 |
| 1676.17 | 27.5589 |
| 1676.30 | 27.361 |
| 2470.21 | 67.2464 |
| 2530.03 | 231.3611 |
| 3462.41 | 2.5099 |
| 3579.18 | 27.9250 |
| 3579.27 | 27.9209 |
Ammonia-Borane Association Energy Analysis
| Energy/au | |
|---|---|
| E(BH3) | -26.61532374 |
| E(NH3) | -56.55776856 |
| E(NH3BH3) | -83.22468918 |
The association energy of ammonia-borane is the energy difference:
To convert to kJ mol -1:
Hence the association energy of ammonia-borane is:
Conversely, the dissociation energy is 135.46 kJ mol-1 (5 s.f.). Experimentally, the association value has been found to be -172.1 kJ mol-1 [11]. This difference could be due to the assumptions made by Gaussian in each calculation. Using a more accurate basis set may reduce the disparity between calculated and experimental values.
Main Group Halides: Al2Cl4Br2
Main group trihalides have an electron deficient central atom and so they preferentially form dimers in solution. The dimers have unusual bridging halide atoms which are often described as having non-traditional 3-centre 2-electron bonds. The different conformes and the nature and vibrational modes of the bonds will now be investigated.
Isomers of Al2Cl4Br2
There are four different isomers shown in the table below:
| Number | Isomer | Name | Symmetry |
|---|---|---|---|
| 1 |  |
Cl2Al(μ-Br2)AlCl2 | D2h |
| 2 |  |
BrClAl(μ-Br,Cl)AlCl2 | C1 |
| 3 |  |
Cis-BrClAl(μ-Cl2)AlClBr | C2v |
| 4 |  |
Trans-BrClAl(μ-Cl2)AlClBr | C2h |
Each isomer was drawn and optimised in GaussView, with the output files and item tables shown below:
Isomer 1
Isomer 1 Optimisation
Isomer 1 was drawn in GaussView. Firstly an optimisation was run using the 3-21G basis set. The .log file was published to D-Space DOI:10042/23501 .
| Isomer 1 | |
|---|---|
| More Info | |
| File | .log |
| Calculation Type | FOPT |
| Calculation Method | RB3LYP |
| Basis Set | 3-21G |
| Final energy/au | -7438.22196330 |
| Gradient/au | 0.00000161 |
| Dipole Moment | 0.0007 |
| Point Group | C1 |
| Calculation time | 0 days 0 hours 6 minutes 33.9 seconds. |
        Item               Value     Threshold  Converged?
Maximum Force            0.000004     0.000450     YES
RMS     Force            0.000002     0.000300     YES
Maximum Displacement     0.000127     0.001800     YES
RMS     Displacement     0.000066     0.001200     YES
Predicted change in Energy=-8.663193D-10
Optimization completed.
   -- Stationary point found.
                          ----------------------------
                          !   Optimized Parameters   !
                          ! (Angstroms and Degrees)  !
--------------------------                            --------------------------
! Name  Definition              Value          Derivative Info.                !
--------------------------------------------------------------------------------
! R1    R(1,3)                  2.525          -DE/DX =    0.0                 !
! R2    R(1,4)                  2.525          -DE/DX =    0.0                 !
! R3    R(1,5)                  2.1692         -DE/DX =    0.0                 !
! R4    R(1,8)                  2.1692         -DE/DX =    0.0                 !
! R5    R(2,3)                  2.525          -DE/DX =    0.0                 !
! R6    R(2,4)                  2.525          -DE/DX =    0.0                 !
! R7    R(2,6)                  2.1692         -DE/DX =    0.0                 !
! R8    R(2,7)                  2.1692         -DE/DX =    0.0                 !
! A1    A(3,1,4)               91.6004         -DE/DX =    0.0                 !
! A2    A(3,1,5)              109.5329         -DE/DX =    0.0                 !
! A3    A(3,1,8)              109.5308         -DE/DX =    0.0                 !
! A4    A(4,1,5)              109.533          -DE/DX =    0.0                 !
! A5    A(4,1,8)              109.5308         -DE/DX =    0.0                 !
! A6    A(5,1,8)              122.6868         -DE/DX =    0.0                 !
! A7    A(3,2,4)               91.6003         -DE/DX =    0.0                 !
! A8    A(3,2,6)              109.5321         -DE/DX =    0.0                 !
! A9    A(3,2,7)              109.5317         -DE/DX =    0.0                 !
! A10   A(4,2,6)              109.5319         -DE/DX =    0.0                 !
! A11   A(4,2,7)              109.5318         -DE/DX =    0.0                 !
! A12   A(6,2,7)              122.6868         -DE/DX =    0.0                 !
! A13   A(1,3,2)               88.3998         -DE/DX =    0.0                 !
! A14   A(1,4,2)               88.3996         -DE/DX =    0.0                 !
! D1    D(4,1,3,2)              0.0123         -DE/DX =    0.0                 !
! D2    D(5,1,3,2)            111.4085         -DE/DX =    0.0                 !
! D3    D(8,1,3,2)           -111.3813         -DE/DX =    0.0                 !
! D4    D(3,1,4,2)             -0.0123         -DE/DX =    0.0                 !
! D5    D(5,1,4,2)           -111.4084         -DE/DX =    0.0                 !
! D6    D(8,1,4,2)            111.3814         -DE/DX =    0.0                 !
! D7    D(4,2,3,1)             -0.0123         -DE/DX =    0.0                 !
! D8    D(6,2,3,1)           -111.4072         -DE/DX =    0.0                 !
! D9    D(7,2,3,1)            111.3825         -DE/DX =    0.0                 !
! D10   D(3,2,4,1)              0.0123         -DE/DX =    0.0                 !
! D11   D(6,2,4,1)            111.4074         -DE/DX =    0.0                 !
! D12   D(7,2,4,1)           -111.3825         -DE/DX =    0.0                 !
--------------------------------------------------------------------------------
GradGradGradGradGradGradGradGradGradGradGradGradGradGradGradGradGradGrad
The input file was submitted and then edited to use the 6-31G(d, p) basis set on Al and Cl and a pseudo potential LanL2DZ on Br. The resulting .log file was published to D-space and can be found here DOI:10042/23511 .
| Isomer 1 | ||||
|---|---|---|---|---|
| ||||
| More Info | ||||
| File | .log | |||
| Calculation Type | FOPT | |||
| Calculation Method | RB3LYP | |||
| Basis Set | Gen | |||
| Final energy/au | -2352.40631609 | |||
| Gradient/au | 0.00000393 | |||
| Dipole Moment/Debye | 0.00 | |||
| Point Group | C1 | |||
| Calculation time | 0 days 0 hours 3 minutes 33.9 seconds. | |||
        Item               Value     Threshold  Converged?
Maximum Force            0.000006     0.000450     YES
RMS     Force            0.000003     0.000300     YES
Maximum Displacement     0.000112     0.001800     YES
RMS     Displacement     0.000056     0.001200     YES
Predicted change in Energy=-1.130417D-09
Optimization completed.
   -- Stationary point found.
                          ----------------------------
                          !   Optimized Parameters   !
                          ! (Angstroms and Degrees)  !
--------------------------                            --------------------------
! Name  Definition              Value          Derivative Info.                !
--------------------------------------------------------------------------------
! R1    R(1,3)                  2.4892         -DE/DX =    0.0                 !
! R2    R(1,4)                  2.4892         -DE/DX =    0.0                 !
! R3    R(1,5)                  2.0933         -DE/DX =    0.0                 !
! R4    R(1,8)                  2.0933         -DE/DX =    0.0                 !
! R5    R(2,3)                  2.4892         -DE/DX =    0.0                 !
! R6    R(2,4)                  2.4892         -DE/DX =    0.0                 !
! R7    R(2,6)                  2.0933         -DE/DX =    0.0                 !
! R8    R(2,7)                  2.0933         -DE/DX =    0.0                 !
! A1    A(3,1,4)               91.743          -DE/DX =    0.0                 !
! A2    A(3,1,5)              109.8144         -DE/DX =    0.0                 !
! A3    A(3,1,8)              109.8145         -DE/DX =    0.0                 !
! A4    A(4,1,5)              109.8144         -DE/DX =    0.0                 !
! A5    A(4,1,8)              109.8145         -DE/DX =    0.0                 !
! A6    A(5,1,8)              121.7332         -DE/DX =    0.0                 !
! A7    A(3,2,4)               91.743          -DE/DX =    0.0                 !
! A8    A(3,2,6)              109.8145         -DE/DX =    0.0                 !
! A9    A(3,2,7)              109.8144         -DE/DX =    0.0                 !
! A10   A(4,2,6)              109.8145         -DE/DX =    0.0                 !
! A11   A(4,2,7)              109.8144         -DE/DX =    0.0                 !
! A12   A(6,2,7)              121.7332         -DE/DX =    0.0                 !
! A13   A(1,3,2)               88.257          -DE/DX =    0.0                 !
! A14   A(1,4,2)               88.257          -DE/DX =    0.0                 !
! D1    D(4,1,3,2)             -0.0006         -DE/DX =    0.0                 !
! D2    D(5,1,3,2)            111.8037         -DE/DX =    0.0                 !
! D3    D(8,1,3,2)           -111.8051         -DE/DX =    0.0                 !
! D4    D(3,1,4,2)              0.0006         -DE/DX =    0.0                 !
! D5    D(5,1,4,2)           -111.8037         -DE/DX =    0.0                 !
! D6    D(8,1,4,2)            111.805          -DE/DX =    0.0                 !
! D7    D(4,2,3,1)              0.0006         -DE/DX =    0.0                 !
! D8    D(6,2,3,1)           -111.8038         -DE/DX =    0.0                 !
! D9    D(7,2,3,1)            111.8049         -DE/DX =    0.0                 !
! D10   D(3,2,4,1)             -0.0006         -DE/DX =    0.0                 !
! D11   D(6,2,4,1)            111.8038         -DE/DX =    0.0                 !
! D12   D(7,2,4,1)           -111.8049         -DE/DX =    0.0                 !
--------------------------------------------------------------------------------
GradGradGradGradGradGradGradGradGradGradGradGradGradGradGradGradGradGrad
Isomer 1 Frequency Analysis
The .log file generated above was opened in GaussView and a frequency analysis of Isomer 1 was run using the basis sets as above and the keywords integral=grid=ultrafine, to reduce the error and minimise the low frequencies, which are shown below:
Low frequencies ---   -3.7346   -2.7459   -2.0233   -0.0004    0.0014    0.0026
Low frequencies ---   15.6266   63.3788   86.0191
The .log file output file can be found here DOI:10042/23645 .
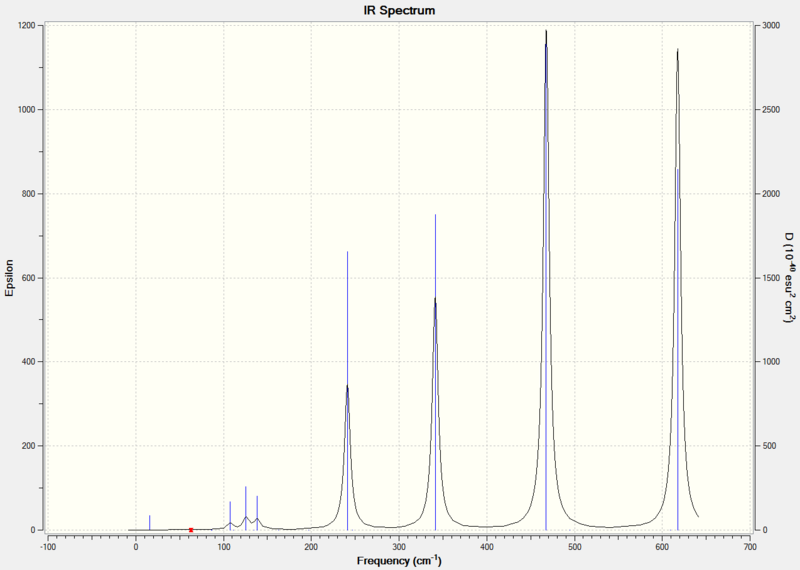
From the table above, 10 of the vibrations are IR inactive because they do not result in a dipole moment.
Isomer 2
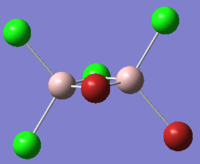
Isomer two has two enantiomers, both of which will have the same energy, and so only one is calculated. The structure of the two optical isomers is shown below:
 |

|
Isomer 2 Optimisation
Isomer 2 was drawn in GaussView. Firstly an optimisation was run using the 3-21G basis set. The .log file was published to D-Space DOI:10042/23513 .
| Isomer 2 | |
|---|---|
| More Info | |
| File | .log |
| Calculation Type | FOPT |
| Calculation Method | RB3LYP |
| Basis Set | 3-21G |
| Final energy/au | -7438.22543102 |
| Gradient/au | 0.00013208 |
| Dipole Moment | 1.6607 |
| Point Group | C1 |
| Calculation time | 0 days 0 hours 10 minutes 12.5 seconds. |
        Item               Value     Threshold  Converged?
Maximum Force            0.000287     0.000450     YES
RMS     Force            0.000081     0.000300     YES
Maximum Displacement     0.001476     0.001800     YES
RMS     Displacement     0.000577     0.001200     YES
Predicted change in Energy=-3.468295D-07
Optimization completed.
   -- Stationary point found.
                          ----------------------------
                          !   Optimized Parameters   !
                          ! (Angstroms and Degrees)  !
--------------------------                            --------------------------
! Name  Definition              Value          Derivative Info.                !
--------------------------------------------------------------------------------
! R1    R(1,3)                  2.5478         -DE/DX =   -0.0003              !
! R2    R(1,4)                  2.1718         -DE/DX =    0.0                 !
! R3    R(1,7)                  2.294          -DE/DX =   -0.0001              !
! R4    R(1,8)                  2.3903         -DE/DX =    0.0003              !
! R5    R(2,3)                  2.5147         -DE/DX =    0.0001              !
! R6    R(2,5)                  2.1657         -DE/DX =    0.0                 !
! R7    R(2,6)                  2.1678         -DE/DX =    0.0                 !
! R8    R(2,8)                  2.378          -DE/DX =   -0.0001              !
! A1    A(3,1,4)              107.9679         -DE/DX =    0.0                 !
! A2    A(3,1,7)              112.4634         -DE/DX =    0.0                 !
! A3    A(3,1,8)               88.3635         -DE/DX =    0.0                 !
! A4    A(4,1,7)              123.327          -DE/DX =    0.0                 !
! A5    A(4,1,8)              107.473          -DE/DX =    0.0                 !
! A6    A(7,1,8)              111.6155         -DE/DX =    0.0                 !
! A7    A(3,2,5)              110.7263         -DE/DX =    0.0                 !
! A8    A(3,2,6)              110.0114         -DE/DX =    0.0                 !
! A9    A(3,2,8)               89.4188         -DE/DX =    0.0                 !
! A10   A(5,2,6)              123.1268         -DE/DX =    0.0                 !
! A11   A(5,2,8)              109.5948         -DE/DX =    0.0                 !
! A12   A(6,2,8)              108.7565         -DE/DX =    0.0                 !
! A13   A(1,3,2)               87.6123         -DE/DX =    0.0                 !
! A14   A(1,8,2)               94.6053         -DE/DX =   -0.0001              !
! D1    D(4,1,3,2)           -107.946          -DE/DX =    0.0                 !
! D2    D(7,1,3,2)            112.6695         -DE/DX =    0.0                 !
! D3    D(8,1,3,2)             -0.0967         -DE/DX =    0.0                 !
! D4    D(3,1,8,2)              0.1025         -DE/DX =    0.0                 !
! D5    D(4,1,8,2)            108.4358         -DE/DX =    0.0                 !
! D6    D(7,1,8,2)           -113.4658         -DE/DX =    0.0                 !
! D7    D(5,2,3,1)            110.8754         -DE/DX =    0.0                 !
! D8    D(6,2,3,1)           -109.6902         -DE/DX =   -0.0001              !
! D9    D(8,2,3,1)              0.0972         -DE/DX =    0.0                 !
! D10   D(3,2,8,1)             -0.1038         -DE/DX =    0.0                 !
! D11   D(5,2,8,1)           -111.947          -DE/DX =    0.0001              !
! D12   D(6,2,8,1)            110.8719         -DE/DX =    0.0                 !
--------------------------------------------------------------------------------
GradGradGradGradGradGradGradGradGradGradGradGradGradGradGradGradGradGrad
The .log file from above was used to create a new calculation and the resulting File:RSG Optimisation631G Isomer2.gjf was edited to use the 6-31G(d, p) basis set on Al and Cl and a pseudo potential LanL2DZ on Br. The resulting .log file was published to D-space and can be found here DOI:10042/23521 .
| Isomer 2 | ||||
|---|---|---|---|---|
| ||||
| More Info | ||||
| File | .log | |||
| Calculation Type | FOPT | |||
| Calculation Method | RB3LYP | |||
| Basis Set | Gen | |||
| Final energy/au | -2352.41110607 | |||
| Gradient/au | 0.00001529 | |||
| Dipole Moment/Debye | 0.14 | |||
| Point Group | C1 | |||
| Calculation time | 0 days 0 hours 4 minutes 3.3 seconds. | |||
        Item               Value     Threshold  Converged?
Maximum Force            0.000035     0.000450     YES
RMS     Force            0.000014     0.000300     YES
Maximum Displacement     0.000539     0.001800     YES
RMS     Displacement     0.000182     0.001200     YES
Predicted change in Energy=-2.019017D-08
Optimization completed.
   -- Stationary point found.
                          ----------------------------
                          !   Optimized Parameters   !
                          ! (Angstroms and Degrees)  !
--------------------------                            --------------------------
! Name  Definition              Value          Derivative Info.                !
--------------------------------------------------------------------------------
! R1    R(1,3)                  2.4864         -DE/DX =    0.0                 !
! R2    R(1,4)                  2.0942         -DE/DX =    0.0                 !
! R3    R(1,7)                  2.2757         -DE/DX =    0.0                 !
! R4    R(1,8)                  2.3035         -DE/DX =    0.0                 !
! R5    R(2,3)                  2.4822         -DE/DX =    0.0                 !
! R6    R(2,5)                  2.0929         -DE/DX =    0.0                 !
! R7    R(2,6)                  2.0929         -DE/DX =    0.0                 !
! R8    R(2,8)                  2.3014         -DE/DX =    0.0                 !
! A1    A(3,1,4)              109.9222         -DE/DX =    0.0                 !
! A2    A(3,1,7)              110.7512         -DE/DX =    0.0                 !
! A3    A(3,1,8)               90.9412         -DE/DX =    0.0                 !
! A4    A(4,1,7)              121.449          -DE/DX =    0.0                 !
! A5    A(4,1,8)              109.4552         -DE/DX =    0.0                 !
! A6    A(7,1,8)              110.0847         -DE/DX =    0.0                 !
! A7    A(3,2,5)              110.2315         -DE/DX =    0.0                 !
! A8    A(3,2,6)              110.1837         -DE/DX =    0.0                 !
! A9    A(3,2,8)               91.0942         -DE/DX =    0.0                 !
! A10   A(5,2,6)              121.7109         -DE/DX =    0.0                 !
! A11   A(5,2,8)              109.6939         -DE/DX =    0.0                 !
! A12   A(6,2,8)              109.6528         -DE/DX =    0.0                 !
! A13   A(1,3,2)               84.7086         -DE/DX =    0.0                 !
! A14   A(1,8,2)               93.2561         -DE/DX =    0.0                 !
! D1    D(4,1,3,2)           -111.1413         -DE/DX =    0.0                 !
! D2    D(7,1,3,2)            111.9076         -DE/DX =    0.0                 !
! D3    D(8,1,3,2)             -0.0244         -DE/DX =    0.0                 !
! D4    D(3,1,8,2)              0.0262         -DE/DX =    0.0                 !
! D5    D(4,1,8,2)            111.5711         -DE/DX =    0.0                 !
! D6    D(7,1,8,2)           -112.5127         -DE/DX =    0.0                 !
! D7    D(5,2,3,1)            111.5095         -DE/DX =    0.0                 !
! D8    D(6,2,3,1)           -111.4085         -DE/DX =    0.0                 !
! D9    D(8,2,3,1)              0.0244         -DE/DX =    0.0                 !
! D10   D(3,2,8,1)             -0.0263         -DE/DX =    0.0                 !
! D11   D(5,2,8,1)           -112.0013         -DE/DX =    0.0                 !
! D12   D(6,2,8,1)            111.8906         -DE/DX =    0.0                 !
--------------------------------------------------------------------------------
GradGradGradGradGradGradGradGradGradGradGradGradGradGradGradGradGradGrad
Isomer 2 Frequency Analysis
The .log file generated above was opened in GaussView and a frequency analysis of Isomer 2 was run using the basis sets as above and the keywords integral=grid=ultrafine, to reduce the error and minimise the low frequencies, which are shown below:
Low frequencies ---   -2.7131   -2.0394   -0.0036   -0.0032   -0.0027    1.1966
Low frequencies ---   16.7411   55.8643   80.0410
The .log file output file can be found here DOI:10042/23665 .
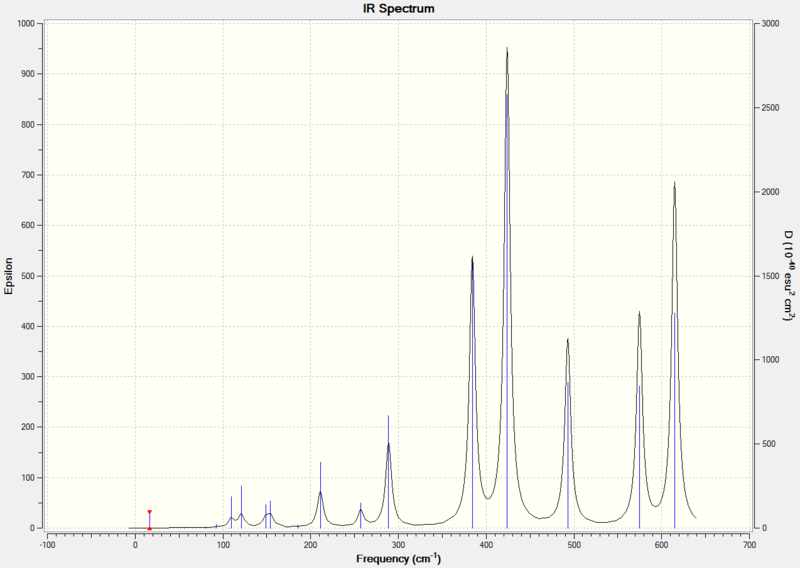
From the table above, 0 of the vibrations are IR inactive because they do not result in a change in dipole moment, see What Makes Vibrational Modes IR Active?.
Isomer 3
Isomer 3 Optimisation
Isomer 3 was drawn in GaussView. Firstly an optimisation was run using the 3-21G basis set. The .log file was published to D-Space DOI:10042/23569 .
| Isomer 3 | |
|---|---|
| More Info | |
| File | .log |
| Calculation Type | FOPT |
| Calculation Method | RB3LYP |
| Basis Set | 3-21G |
| Final energy/au | -7438.22889193 |
| Gradient/au | 0.00001124 |
| Dipole Moment | 2.15 |
| Point Group | C1 |
| Calculation time | 0 days 0 hours 6 minutes 5.4 seconds. |
        Item               Value     Threshold  Converged?
Maximum Force            0.000016     0.000450     YES
RMS     Force            0.000009     0.000300     YES
Maximum Displacement     0.001324     0.001800     YES
RMS     Displacement     0.000641     0.001200     YES
Predicted change in Energy=-1.351738D-08
Optimization completed.
   -- Stationary point found.
                          ----------------------------
                          !   Optimized Parameters   !
                          ! (Angstroms and Degrees)  !
--------------------------                            --------------------------
! Name  Definition              Value          Derivative Info.                !
--------------------------------------------------------------------------------
! R1    R(1,3)                  2.1683         -DE/DX =    0.0                 !
! R2    R(1,5)                  2.2917         -DE/DX =    0.0                 !
! R3    R(1,6)                  2.3899         -DE/DX =    0.0                 !
! R4    R(1,7)                  2.3899         -DE/DX =    0.0                 !
! R5    R(2,4)                  2.1683         -DE/DX =    0.0                 !
! R6    R(2,6)                  2.3899         -DE/DX =    0.0                 !
! R7    R(2,7)                  2.3899         -DE/DX =    0.0                 !
! R8    R(2,8)                  2.2916         -DE/DX =    0.0                 !
! A1    A(3,1,5)              123.829          -DE/DX =    0.0                 !
! A2    A(3,1,6)              108.199          -DE/DX =    0.0                 !
! A3    A(3,1,7)              108.2006         -DE/DX =    0.0                 !
! A4    A(5,1,6)              111.8524         -DE/DX =    0.0                 !
! A5    A(5,1,7)              111.8541         -DE/DX =    0.0                 !
! A6    A(6,1,7)               86.5905         -DE/DX =    0.0                 !
! A7    A(4,2,6)              108.202          -DE/DX =    0.0                 !
! A8    A(4,2,7)              108.2003         -DE/DX =    0.0                 !
! A9    A(4,2,8)              123.8297         -DE/DX =    0.0                 !
! A10   A(6,2,7)               86.5902         -DE/DX =    0.0                 !
! A11   A(6,2,8)              111.8526         -DE/DX =    0.0                 !
! A12   A(7,2,8)              111.8506         -DE/DX =    0.0                 !
! A13   A(1,6,2)               93.4055         -DE/DX =    0.0                 !
! A14   A(1,7,2)               93.4052         -DE/DX =    0.0                 !
! D1    D(3,1,6,2)            107.3444         -DE/DX =    0.0                 !
! D2    D(5,1,6,2)           -112.9045         -DE/DX =    0.0                 !
! D3    D(7,1,6,2)             -0.702          -DE/DX =    0.0                 !
! D4    D(3,1,7,2)           -107.3428         -DE/DX =    0.0                 !
! D5    D(5,1,7,2)            112.9028         -DE/DX =    0.0                 !
! D6    D(6,1,7,2)              0.702          -DE/DX =    0.0                 !
! D7    D(4,2,6,1)           -107.3442         -DE/DX =    0.0                 !
! D8    D(7,2,6,1)              0.702          -DE/DX =    0.0                 !
! D9    D(8,2,6,1)            112.9006         -DE/DX =    0.0                 !
! D10   D(4,2,7,1)            107.3458         -DE/DX =    0.0                 !
! D11   D(6,2,7,1)             -0.702          -DE/DX =    0.0                 !
! D12   D(8,2,7,1)           -112.9025         -DE/DX =    0.0                 !
--------------------------------------------------------------------------------
GradGradGradGradGradGradGradGradGradGradGradGradGradGradGradGradGradGrad
The input file was submitted and then edited to use the 6-31G(d, p) basis set on Al and Cl and a pseudo potential LanL2DZ on Br. The input file can be found here. The resulting .log file was published to D-space and can be found here DOI:10042/23575 .
| Isomer 3 | ||||
|---|---|---|---|---|
| ||||
| More Info | ||||
| File | .log | |||
| Calculation Type | FOPT | |||
| Calculation Method | RB3LYP | |||
| Basis Set | Gen | |||
| Final energy/au | -2352.41627322 | |||
| Gradient/au | 0.00001413 | |||
| Dipole Moment/Debye | 0.18 | |||
| Point Group | C1 | |||
| Calculation time | 0 days 0 hours 5 minutes 23.4 seconds. | |||
        Item               Value     Threshold  Converged?
Maximum Force            0.000038     0.000450     YES
RMS     Force            0.000015     0.000300     YES
Maximum Displacement     0.000517     0.001800     YES
RMS     Displacement     0.000253     0.001200     YES
Predicted change in Energy=-2.282388D-08
Optimization completed.
   -- Stationary point found.
                          ----------------------------
                          !   Optimized Parameters   !
                          ! (Angstroms and Degrees)  !
--------------------------                            --------------------------
! Name  Definition              Value          Derivative Info.                !
--------------------------------------------------------------------------------
! R1    R(1,3)                  2.0937         -DE/DX =    0.0                 !
! R2    R(1,5)                  2.2747         -DE/DX =    0.0                 !
! R3    R(1,6)                  2.2985         -DE/DX =    0.0                 !
! R4    R(1,7)                  2.2985         -DE/DX =    0.0                 !
! R5    R(2,4)                  2.0937         -DE/DX =    0.0                 !
! R6    R(2,6)                  2.2985         -DE/DX =    0.0                 !
! R7    R(2,7)                  2.2985         -DE/DX =    0.0                 !
! R8    R(2,8)                  2.2747         -DE/DX =    0.0                 !
! A1    A(3,1,5)              121.484          -DE/DX =    0.0                 !
! A2    A(3,1,6)              109.8669         -DE/DX =    0.0                 !
! A3    A(3,1,7)              109.8672         -DE/DX =    0.0                 !
! A4    A(5,1,6)              110.4938         -DE/DX =    0.0                 !
! A5    A(5,1,7)              110.4941         -DE/DX =    0.0                 !
! A6    A(6,1,7)               90.2014         -DE/DX =    0.0                 !
! A7    A(4,2,6)              109.8672         -DE/DX =    0.0                 !
! A8    A(4,2,7)              109.8669         -DE/DX =    0.0                 !
! A9    A(4,2,8)              121.484          -DE/DX =    0.0                 !
! A10   A(6,2,7)               90.2013         -DE/DX =    0.0                 !
! A11   A(6,2,8)              110.4941         -DE/DX =    0.0                 !
! A12   A(7,2,8)              110.4938         -DE/DX =    0.0                 !
! A13   A(1,6,2)               89.798          -DE/DX =    0.0                 !
! A14   A(1,7,2)               89.798          -DE/DX =    0.0                 !
! D1    D(3,1,6,2)            110.9941         -DE/DX =    0.0                 !
! D2    D(5,1,6,2)           -112.2963         -DE/DX =    0.0                 !
! D3    D(7,1,6,2)             -0.267          -DE/DX =    0.0                 !
! D4    D(3,1,7,2)           -110.9939         -DE/DX =    0.0                 !
! D5    D(5,1,7,2)            112.2961         -DE/DX =    0.0                 !
! D6    D(6,1,7,2)              0.267          -DE/DX =    0.0                 !
! D7    D(4,2,6,1)           -110.9939         -DE/DX =    0.0                 !
! D8    D(7,2,6,1)              0.267          -DE/DX =    0.0                 !
! D9    D(8,2,6,1)            112.2961         -DE/DX =    0.0                 !
! D10   D(4,2,7,1)            110.9942         -DE/DX =    0.0                 !
! D11   D(6,2,7,1)             -0.267          -DE/DX =    0.0                 !
! D12   D(8,2,7,1)           -112.2963         -DE/DX =    0.0                 !
--------------------------------------------------------------------------------
GradGradGradGradGradGradGradGradGradGradGradGradGradGradGradGradGradGrad
Isomer 3 Frequency Analysis
The .log file generated above was opened in GaussView and a frequency analysis of Isomer 3 was run using the basis sets as above and the keywords integral=grid=ultrafine, to reduce the error and minimise the low frequencies, which are shown below:
Low frequencies ---   -3.5356   -2.8091   -1.9049    0.0017    0.0032    0.0036
Low frequencies ---   17.3489   50.9695   78.5298
The .log file output file can be found here DOI:10042/23682 .
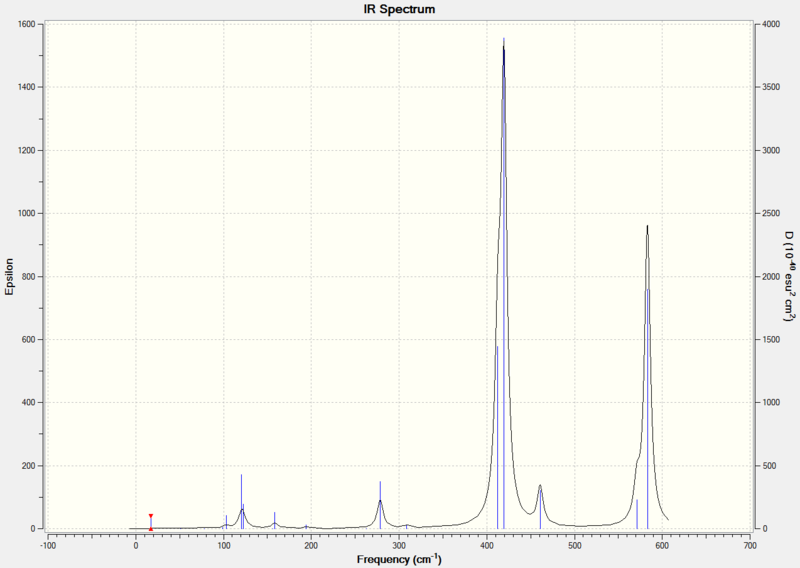
From the table above, 3 of the vibrations have an intensity of zero and are IR inactive because they do not result in a dipole moment.
Isomer 4
Isomer 4 Optimisation
Isomer 4 was drawn in GaussView. Firstly an optimisation was run using the 3-21G basis set. The .log file was published to D-Space DOI:10042/23538 .
| Isomer 4 | |
|---|---|
| More Info | |
| File | .log |
| Calculation Type | FOPT |
| Calculation Method | RB3LYP |
| Basis Set | 3-21G |
| Final energy/au | -7438.22911312 |
| Gradient/au | 0.00003139 |
| Dipole Moment | 0.0002 |
| Point Group | C1 |
| Calculation time | 0 days 0 hours 5 minutes 27.4 seconds. |
        Item               Value     Threshold  Converged?
Maximum Force            0.000056     0.000450     YES
RMS     Force            0.000029     0.000300     YES
Maximum Displacement     0.001732     0.001800     YES
RMS     Displacement     0.000757     0.001200     YES
Predicted change in Energy=-9.153807D-08
Optimization completed.
   -- Stationary point found.
                          ----------------------------
                          !   Optimized Parameters   !
                          ! (Angstroms and Degrees)  !
--------------------------                            --------------------------
! Name  Definition              Value          Derivative Info.                !
--------------------------------------------------------------------------------
! R1    R(1,4)                  2.3897         -DE/DX =    0.0                 !
! R2    R(1,5)                  2.1701         -DE/DX =    0.0                 !
! R3    R(1,6)                  2.29           -DE/DX =    0.0                 !
! R4    R(1,8)                  2.3896         -DE/DX =    0.0                 !
! R5    R(2,3)                  2.1701         -DE/DX =    0.0                 !
! R6    R(2,4)                  2.3896         -DE/DX =    0.0                 !
! R7    R(2,7)                  2.29           -DE/DX =    0.0                 !
! R8    R(2,8)                  2.3898         -DE/DX =    0.0                 !
! A1    A(4,1,5)              107.6258         -DE/DX =    0.0                 !
! A2    A(4,1,6)              112.3648         -DE/DX =    0.0                 !
! A3    A(4,1,8)               86.6262         -DE/DX =    0.0                 !
! A4    A(5,1,6)              123.8746         -DE/DX =   -0.0001              !
! A5    A(5,1,8)              107.6284         -DE/DX =    0.0                 !
! A6    A(6,1,8)              112.3672         -DE/DX =    0.0                 !
! A7    A(3,2,4)              107.6294         -DE/DX =    0.0                 !
! A8    A(3,2,7)              123.8742         -DE/DX =   -0.0001              !
! A9    A(3,2,8)              107.6266         -DE/DX =    0.0                 !
! A10   A(4,2,7)              112.3669         -DE/DX =    0.0                 !
! A11   A(4,2,8)               86.6253         -DE/DX =    0.0                 !
! A12   A(7,2,8)              112.3644         -DE/DX =    0.0                 !
! A13   A(1,4,2)               93.3747         -DE/DX =    0.0                 !
! A14   A(1,8,2)               93.3738         -DE/DX =    0.0                 !
! D1    D(5,1,4,2)           -107.4237         -DE/DX =    0.0                 !
! D2    D(6,1,4,2)            112.8358         -DE/DX =    0.0001              !
! D3    D(8,1,4,2)              0.0087         -DE/DX =    0.0                 !
! D4    D(4,1,8,2)             -0.0087         -DE/DX =    0.0                 !
! D5    D(5,1,8,2)            107.4211         -DE/DX =    0.0                 !
! D6    D(6,1,8,2)           -112.8335         -DE/DX =   -0.0001              !
! D7    D(3,2,4,1)           -107.4391         -DE/DX =    0.0                 !
! D8    D(7,2,4,1)            112.8152         -DE/DX =    0.0001              !
! D9    D(8,2,4,1)             -0.0087         -DE/DX =    0.0                 !
! D10   D(3,2,8,1)            107.442          -DE/DX =    0.0                 !
! D11   D(4,2,8,1)              0.0087         -DE/DX =    0.0                 !
! D12   D(7,2,8,1)           -112.8177         -DE/DX =   -0.0001              !
--------------------------------------------------------------------------------
GradGradGradGradGradGradGradGradGradGradGradGradGradGradGradGradGradGrad
The input file was submitted and then edited to use the 6-31G(d, p) basis set on Al and Cl and a pseudo potential LanL2DZ on Br. The input file can be found here. The resulting .log file was published to D-space and can be found here DOI:10042/23849 .
| Isomer 4 | ||||
|---|---|---|---|---|
| ||||
| More Info | ||||
| File | .log | |||
| Calculation Type | FOPT | |||
| Calculation Method | RB3LYP | |||
| Basis Set | Gen | |||
| Final energy/au | -2352.41629689 | |||
| Gradient/au | 0.00001444 | |||
| Dipole Moment/Debye | 0.00 | |||
| Point Group | C1 | |||
| Calculation time | 0 days 0 hours 4 minutes 42.8 seconds. | |||
        Item               Value     Threshold  Converged?
Maximum Force            0.000038     0.000450     YES
RMS     Force            0.000015     0.000300     YES
Maximum Displacement     0.000318     0.001800     YES
RMS     Displacement     0.000168     0.001200     YES
Predicted change in Energy=-2.168381D-08
Optimization completed.
   -- Stationary point found.
                          ----------------------------
                          !   Optimized Parameters   !
                          ! (Angstroms and Degrees)  !
--------------------------                            --------------------------
! Name  Definition              Value          Derivative Info.                !
--------------------------------------------------------------------------------
! R1    R(1,4)                  2.2985         -DE/DX =    0.0                 !
! R2    R(1,5)                  2.0937         -DE/DX =    0.0                 !
! R3    R(1,6)                  2.2747         -DE/DX =    0.0                 !
! R4    R(1,8)                  2.2985         -DE/DX =    0.0                 !
! R5    R(2,3)                  2.0937         -DE/DX =    0.0                 !
! R6    R(2,4)                  2.2985         -DE/DX =    0.0                 !
! R7    R(2,7)                  2.2747         -DE/DX =    0.0                 !
! R8    R(2,8)                  2.2985         -DE/DX =    0.0                 !
! A1    A(4,1,5)              109.857          -DE/DX =    0.0                 !
! A2    A(4,1,6)              110.5108         -DE/DX =    0.0                 !
! A3    A(4,1,8)               90.2046         -DE/DX =    0.0                 !
! A4    A(5,1,6)              121.4712         -DE/DX =    0.0                 !
! A5    A(5,1,8)              109.8574         -DE/DX =    0.0                 !
! A6    A(6,1,8)              110.5111         -DE/DX =    0.0                 !
! A7    A(3,2,4)              109.8574         -DE/DX =    0.0                 !
! A8    A(3,2,7)              121.4712         -DE/DX =    0.0                 !
! A9    A(3,2,8)              109.857          -DE/DX =    0.0                 !
! A10   A(4,2,7)              110.5111         -DE/DX =    0.0                 !
! A11   A(4,2,8)               90.2046         -DE/DX =    0.0                 !
! A12   A(7,2,8)              110.5108         -DE/DX =    0.0                 !
! A13   A(1,4,2)               89.7954         -DE/DX =    0.0                 !
! A14   A(1,8,2)               89.7954         -DE/DX =    0.0                 !
! D1    D(5,1,4,2)           -111.2504         -DE/DX =    0.0                 !
! D2    D(6,1,4,2)            112.0517         -DE/DX =    0.0                 !
! D3    D(8,1,4,2)              0.0            -DE/DX =    0.0                 !
! D4    D(4,1,8,2)              0.0            -DE/DX =    0.0                 !
! D5    D(5,1,8,2)            111.2501         -DE/DX =    0.0                 !
! D6    D(6,1,8,2)           -112.0514         -DE/DX =    0.0                 !
! D7    D(3,2,4,1)           -111.2501         -DE/DX =    0.0                 !
! D8    D(7,2,4,1)            112.0514         -DE/DX =    0.0                 !
! D9    D(8,2,4,1)              0.0            -DE/DX =    0.0                 !
! D10   D(3,2,8,1)            111.2504         -DE/DX =    0.0                 !
! D11   D(4,2,8,1)              0.0            -DE/DX =    0.0                 !
! D12   D(7,2,8,1)           -112.0517         -DE/DX =    0.0                 !
--------------------------------------------------------------------------------
GradGradGradGradGradGradGradGradGradGradGradGradGradGradGradGradGradGrad
Isomer 4 Frequency Analysis
The .log file generated above was opened in GaussView and a frequency analysis of Isomer 4 was run using the basis sets as above and the keywords integral=grid=ultrafine, to reduce the error and minimise the low frequencies, which are shown below:
Low frequencies ---   -3.3181   -3.1766   -1.6400   -0.0041   -0.0035   -0.0019
Low frequencies ---   18.1680   49.0897   72.9143
The .log file output file can be found here DOI:10042/23733 .
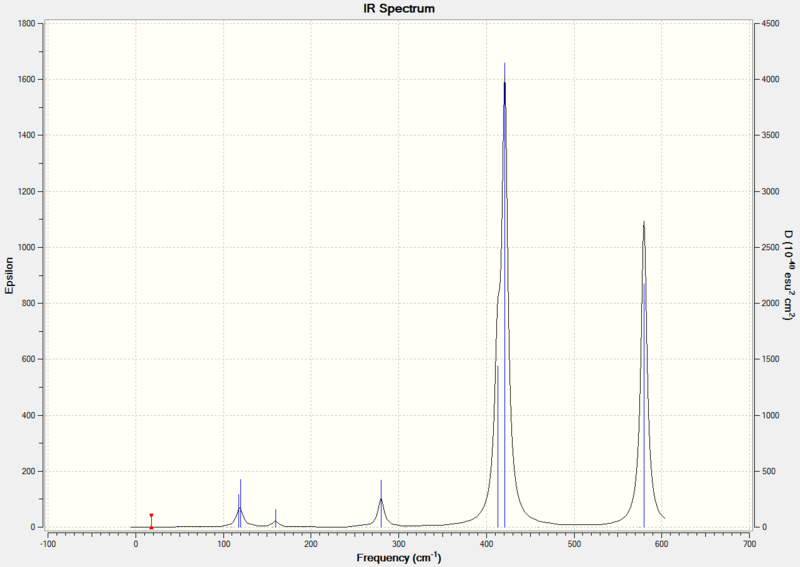
From the table above, 9 of the vibrations have an intensity of zero and are IR inactive because they do not result in a dipole moment. The calculated IR spectrum is shown below.
Population Analysis
The .chk file from the second optimisation above was opened. An energy calculation was run, using the keywords pop=full to run a full MO analysis. The output files can be found here: DOI:10042/23952 .
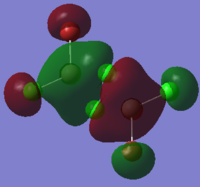
The core Molecular Orbitals are those made from core electrons, whereas the non-core MOs are those generated from the valence electrons. Al has 3 valence electrons, Cl and Br both have 7 valence electrons so in total Al2Cl4Br2 will have 48 valence electrons in 24 fully occupied non-core MOs. In addition to these MOs Gaussian has calculated a further 70 antibonding MOs.
Below are shown 5 of the non-core occupied molecular orbitals.
Energy Analysis of the four Isomers
Isomer 4 is the lowest energy isomer. The energy of the other isomers relative to isomer 1 is tabulated below:
| Isomer | Absolute Energy/kJ mol-1 | Relative Energy/kJ mol-1 | Number of Terminal Br | Number of Bridging Br |
|---|---|---|---|---|
| 1 | -6176242.78 | 26.20 | 0 | 2 |
| 2 | -6176255.36 | 13.63 | 1 | 1 |
| 3 | -6176268.93 | 0.06 | 2 | 0 |
| 4 | -6176268.99 | 0.00 | 2 | 0 |
Terminal Br atoms reduce the overall energy of the molecule compared to bridging Br. There is a very small difference between cis- and trans- Br when both are terminal, with trans- Br being slightly more stable. Bridging Cl are more stable than bridging Br due to better overlap with Al orbitals - Al is in the second row and so overlaps better with the second row Cl than the third row Br. Br is larger and has more diffuse orbitals and so the overlap is worse and so the energy of stabilisation is less and so the overall energy of the molecule is higher.
Dissociation Energy of Isomer 4
Optimisation of AlCl2Br
Isomer 1 was drawn in GaussView. Firstly an optimisation was run using the 3-21G basis set. The .log file was published to D-Space DOI:10042/23632 .
| AlCl2Br | |
|---|---|
| More Info | |
| File | .log |
| Calculation Type | FOPT |
| Calculation Method | RB3LYP |
| Basis Set | 3-21G |
| Final energy/au | -3719.09049381 |
| Gradient/au | 0.00000297 |
| Dipole Moment/Debye | 1.14 |
| Point Group | C2V |
| Calculation time | 0 days 0 hours 0 minutes 37.1 seconds. |
        Item               Value     Threshold  Converged?
Maximum Force            0.000006     0.000450     YES
RMS     Force            0.000004     0.000300     YES
Maximum Displacement     0.000039     0.001800     YES
RMS     Displacement     0.000025     0.001200     YES
Predicted change in Energy=-3.947929D-10
Optimization completed.
   -- Stationary point found.
                          ----------------------------
                          !   Optimized Parameters   !
                          ! (Angstroms and Degrees)  !
--------------------------                            --------------------------
! Name  Definition              Value          Derivative Info.                !
--------------------------------------------------------------------------------
! R1    R(1,2)                  2.1701         -DE/DX =    0.0                 !
! R2    R(1,3)                  2.1701         -DE/DX =    0.0                 !
! R3    R(1,4)                  2.2918         -DE/DX =    0.0                 !
! A1    A(2,1,3)              118.6948         -DE/DX =    0.0                 !
! A2    A(2,1,4)              120.6526         -DE/DX =    0.0                 !
! A3    A(3,1,4)              120.6526         -DE/DX =    0.0                 !
! D1    D(2,1,4,3)            180.0            -DE/DX =    0.0                 !
--------------------------------------------------------------------------------
GradGradGradGradGradGradGradGradGradGradGradGradGradGradGradGradGradGrad
As before, the input file was submitted and then edited to use the 6-31G(d, p) basis set on Al and Cl and a pseudo potential LanL2DZ on Br. The resulting .log file was published to D-space and can be found here DOI:10042/23634 .
| AlCl2Br | ||||
|---|---|---|---|---|
| ||||
| More Info | ||||
| File | .log | |||
| Calculation Type | FOPT | |||
| Calculation Method | RB3LYP | |||
| Basis Set | Gen | |||
| Final energy/au | -1176.19013697 | |||
| Gradient/au | 0.00000291 | |||
| Dipole Moment/Debye | 0.11 | |||
| Point Group | C2V | |||
| Calculation time | 0 days 0 hours 0 minutes 46.1 seconds. | |||
        Item               Value     Threshold  Converged?
Maximum Force            0.000005     0.000450     YES
RMS     Force            0.000002     0.000300     YES
Maximum Displacement     0.000022     0.001800     YES
RMS     Displacement     0.000012     0.001200     YES
Predicted change in Energy=-1.397816D-10
Optimization completed.
   -- Stationary point found.
                          ----------------------------
                          !   Optimized Parameters   !
                          ! (Angstroms and Degrees)  !
--------------------------                            --------------------------
! Name  Definition              Value          Derivative Info.                !
--------------------------------------------------------------------------------
! R1    R(1,2)                  2.0888         -DE/DX =    0.0                 !
! R2    R(1,3)                  2.0888         -DE/DX =    0.0                 !
! R3    R(1,4)                  2.2693         -DE/DX =    0.0                 !
! A1    A(2,1,3)              119.9229         -DE/DX =    0.0                 !
! A2    A(2,1,4)              120.0386         -DE/DX =    0.0                 !
! A3    A(3,1,4)              120.0386         -DE/DX =    0.0                 !
! D1    D(2,1,4,3)            180.0            -DE/DX =    0.0                 !
--------------------------------------------------------------------------------
GradGradGradGradGradGradGradGradGradGradGradGradGradGradGradGradGradGrad
Calculating the Dissociation Energy of Isomer 4
| Energy/au | |
|---|---|
| E(Isomer 4) | -2352.41629689 |
| E(AlCl2Br) | -1176.19013697 |
The dissociation energy of Isomer 4 is the energy difference:
To convert to kJ mol -1
The dissociation energy of Isomer 4 to two molecules of AlCl2Br is -94.52 kJ mol-1. The negative value for the bond dissociation shows that the monomer is less stable than the dimer.
Structural Comparison of the Four Isomers
The Al-Br bridging bonds are 8.2% longer than the Al-Cl bridging bonds. This can be explained due to Br being larger than Cl and so having more diffuse valence orbitals than Cl, and as a result orbital overlap with Al is poorer with Cl due to the size mismatch. For the same reason, terminal Al-Br bonds are 9.1% longer than terminal Al-Cl bonds. Bridging Al-Br-Al bonds are 9.2% longer than terminal Al-Br bonds because the bridging bonds are 3 centre 2 electron bonds whereas terminal bonds are 2 centre 2 electron bonds, and so bridging bonds have a lower bond order and are therefore weaker.
Bridging bromide atoms have a narrower internal angle (Al-Br-Al) than for a corresponding bridging Cl. The decrease, of approximately 5°, is because as you move down the periodic table the inert pair effect leads to sp3 hybridisation being harder to achieve and so bonding is more p-like and so bond angles reduce.
The longer bridging bromide bonds result in Isomer 1 having the largest distance between Al atoms. Isomer 2 has the next largest distance, and Isomers 3 and 4 have the same distance between Al atoms, as both isomers have two bridging Cl atoms.
All Animations of Isomer Vibrational Modes
| Vibration Number | Isomer 1 | Isomer 2 | Isomer 3 | Isomer 4 |
|---|---|---|---|---|
| 1 | 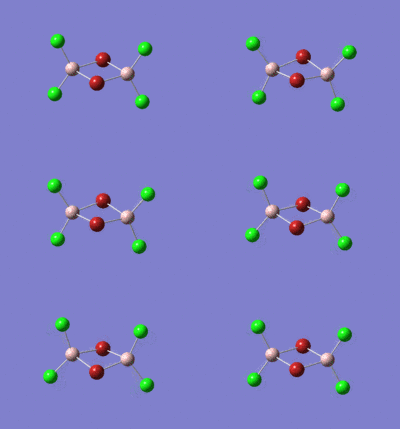 |
 |
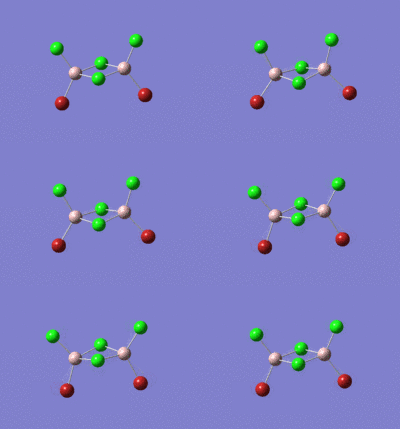 |
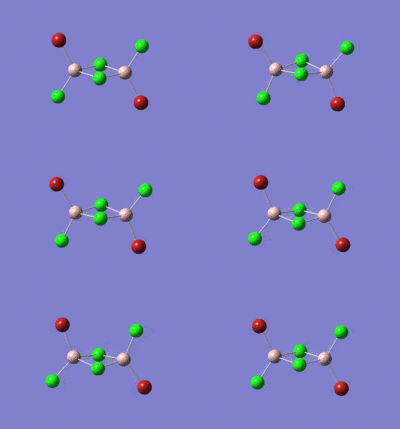
|
| The lowest energy vibrational mode for all isomers is the Al-bridging halide bending mode. The frequency is lowest for isomer 1 where there are two bridging bromides, and as the number of bridging bromides decreases the vibrational frequency increases. The trans isomer, Isomer 4, has the highest frequency for the bending mode. The higher frequency associated with Al-Cl bridging bonds shows that they are stronger than Al-Br bridging bonds. | ||||
| 2 | 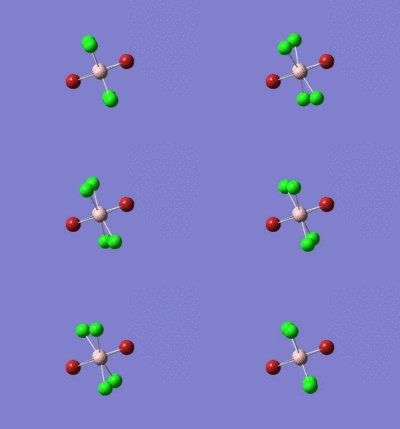 |
 |
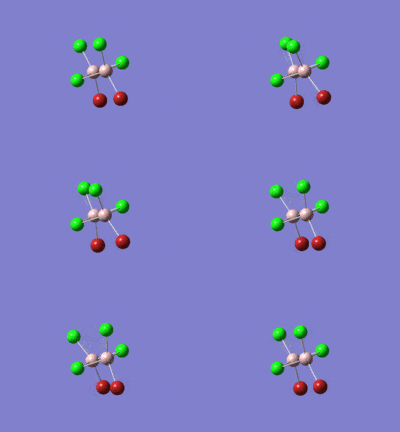 |

|
| The second lowest energy vibrational mode for all isomers is terminal halide atoms twisting. Isomer 1 has the highest frequency vibrational mode due to the stronger Al-Cl than Al-Br bonds. Isomers 3 and 4 have the lowest vibrational frequencies, and they are very similar, with the trans isomer being the lowest in energy by almost 2 cm-1. | ||||
| 3 |  |
 |
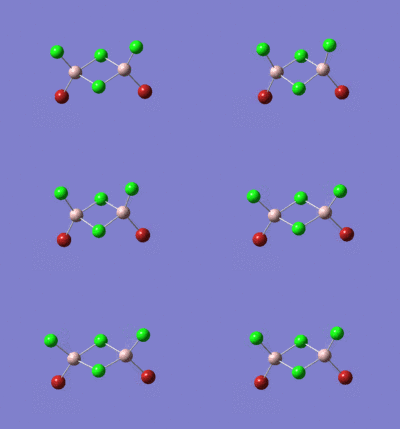 |
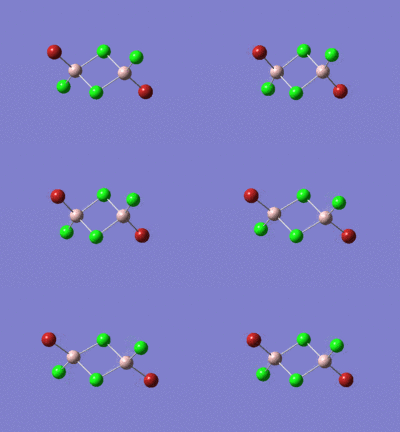
|
| Vibrational mode 3 for isomer 1 is different to that of the other isomers. For Isomer 1 this vibrational mode is rocking of the bridging halide atoms, which for the other isomers is higher in energy due to the stronger Al-Br bridging bonds in other isomers. In Isomer 2 this vibrational mode is 6cm-1 higher in energy (fourth vibrational mode). Isomers 3 and 4 have this vibrational mode as the fifth lowest in energy, which is 17cm-1 and 23 cm-1 higher than Isomer 1 respectively. For Isomers 2, 3 and 4 this vibrational mode is the same, and is a symmetric stretching of the terminal halide atoms and so as the number of terminal Br atoms increases the vibrational frequency decreases due to the weaker Al-Br bonds. | ||||
| 4 | 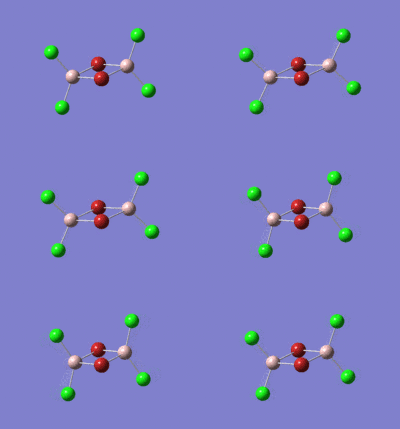 |
 |
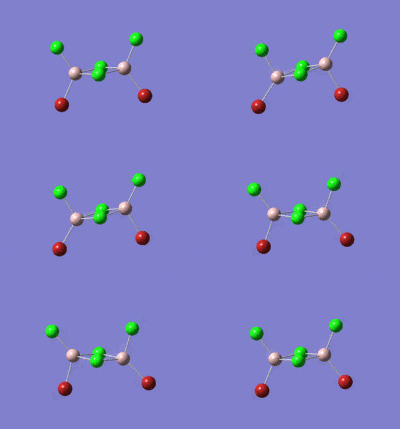 |
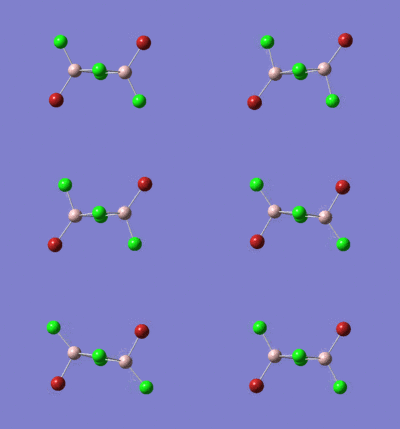
|
| For Isomer 1 the fourth vibrational mode is the symmetric stretching of terminal Al-Cl bonds which is at a higher frequency for this isomer due to the stronger terminal Al-Cl bonds. For Isomer 2, as described above, it is the rocking of the bridging halide atoms which is higher in energy than for isomer 1 due to the stronger bridging Al-Cl bond. For Isomers 3 and 4 the Al atom is rocking out of plane of the bridging atoms. The trans isomer has a higher frequency vibrational mode. | ||||
| 5 | 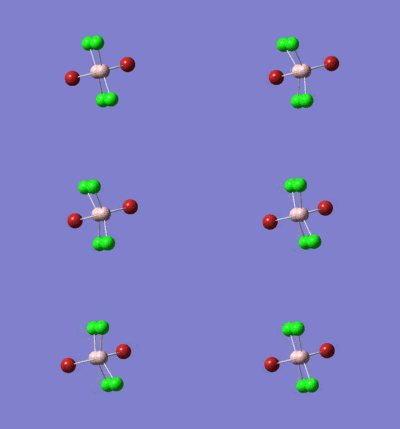 |
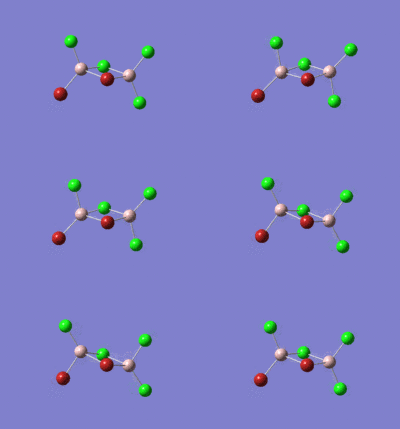 |
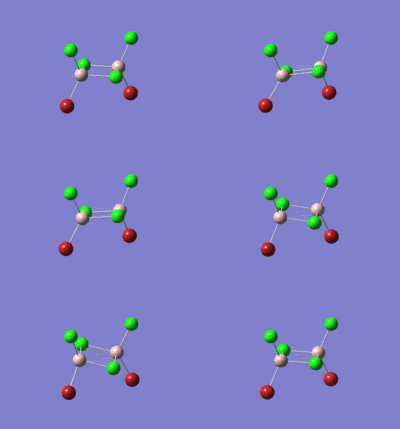 |
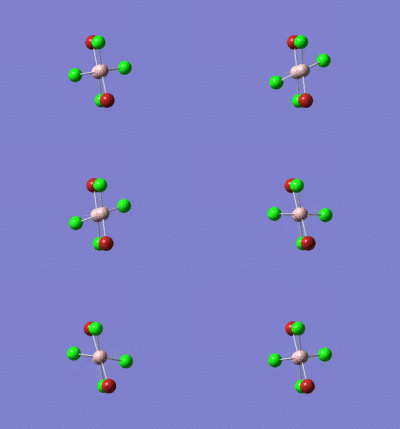
|
| For Isomer 1 this vibrational mode is an antisymmetric stretch of the Br atoms. This is lower in frequency than for the other isomers due to the weak Al-Br bridging bonds when compared to the Al-Cl bridging bonds. For Isomer 2 this is an out of plane rocking of the Al atoms, and for Isomers 3 and 4 it is rocking of the bridging Cl atoms as described above. | ||||
| 6 |  |
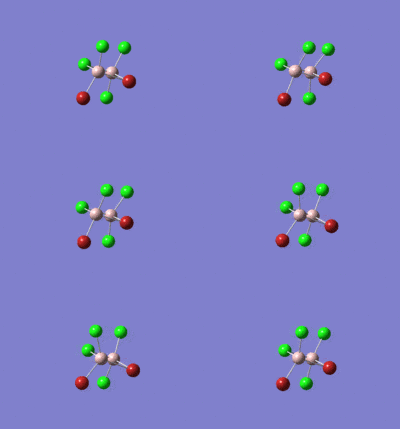 |
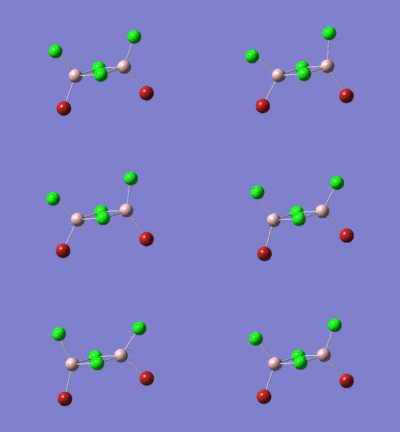 |
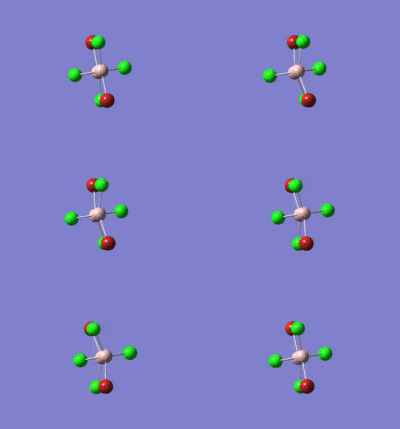
|
| For Isomer 1 this vibrational mode is out of plane rocking of the Al atoms. This is higher in frequency than for the other isomers because the terminal Cl atoms are more strongly bonded than Cl atoms and so the vibration requires more energy and hence a higher frequency. For Isomer 2 this is an antisymmetric stretch of the bridging atoms, and so it is at a higher frequency than for Isomer 1 due to the Al-Cl bridging bond being stronger than the Al-Br bridging bond. For Isomer 3 this vibrational mode is scissoring of the terminal Al-halide bonds. This vibration is at a slightly higher energy than for the trans isomer. For Isomer 4 this vibrational mode is wagging of the terminal halide atoms. Vibrational modes 6 and 7 for Isomers 3 and 4 have swapped relatively, but the vibrational modes for the cis- isomer are higher. The two Br atoms are far apart in space, so sterics are unlikely to cause this. | ||||
| 7 | 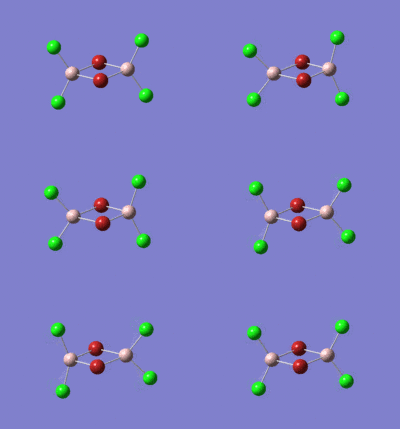 |
 |
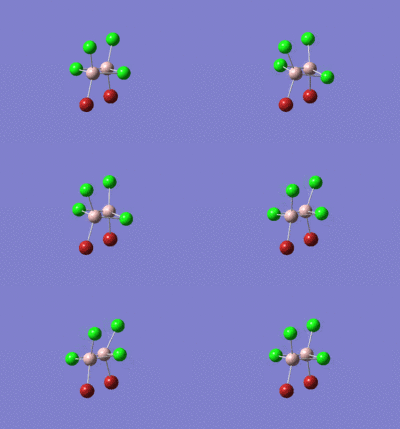 |
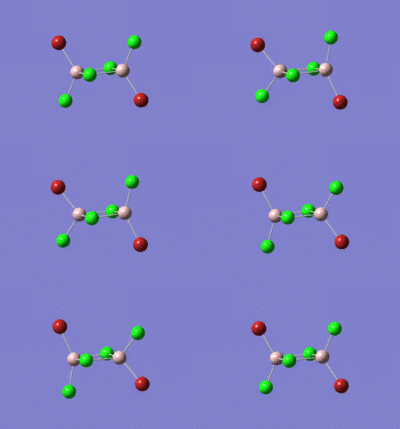
|
| For Isomers 1 and 2 this vibrational mode is the symmetric stretch of terminal halide atoms, where the stretches are out of phase with each other. The vibrational frequency for Isomer 2 is 4 cm-1 lower than for Isomer 1 due to the Al-Br terminal bond being weaker than the corresponding Al-Cl bond in Isomer. Isomers 3 and 4 are discussed above. | ||||
| 8 | 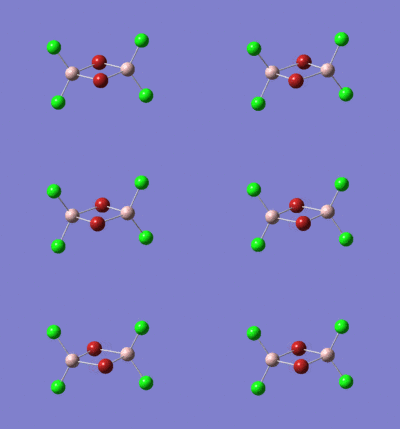 |
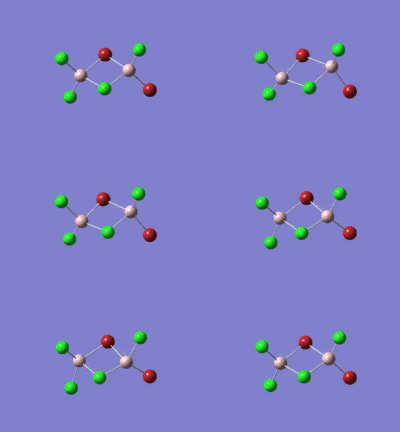 |
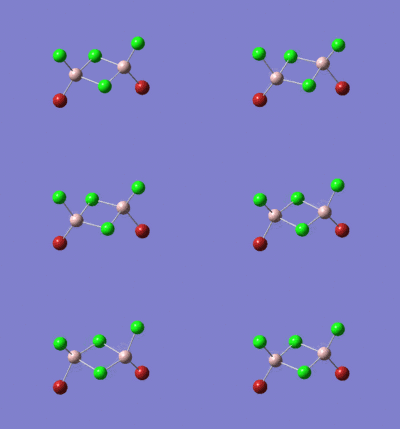 |
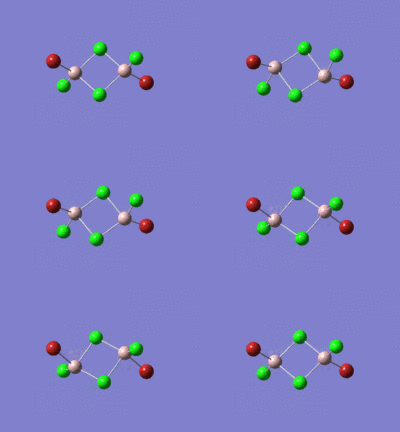
|
| For all isomers this vibrational mode is asymmetrical stretching of Al-bridging halide bonds. Hence the vibrational frequency for Isomer 1 is 14 cm-1 lower than for Isomer 2 and 22cm-1 lower than for Isomers 3 and 4, which are very similar in vibrational frequency due to their similar structure. The bridging Al-Br bonds are weaker than the bridging Al-Cl bonds and so the vibrational frequencies are lower. | ||||
| 9 | 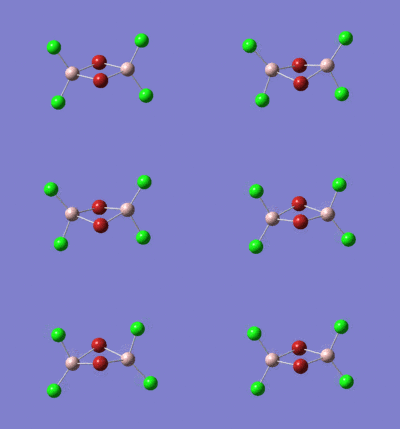 |
 |
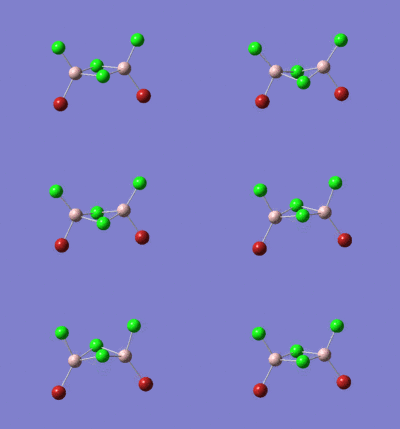 |
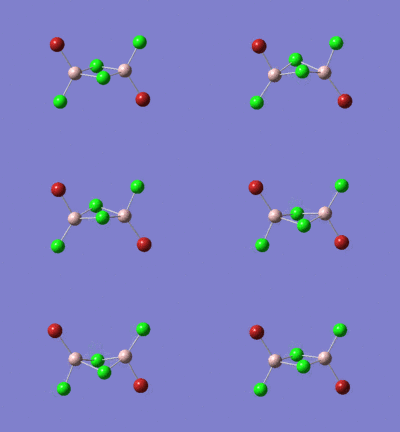
|
| For all isomers this vibrational mode is wagging of the bridging halide atoms, perpendicular to the plane of the bridging atoms. The vibrational frequency for Isomer 1 is 20-25 cm-1 lower than for the other isomers. Again, this is due to the Al-Br bridging bonds being weaker than the Al-Cl bridging bonds. When there is only one bridging Br, as in Isomer 2, the vibrational mode is 4-5 cm-1 lower in energy than for when there are two bridging Br. Again, the vibrational mode for the trans isomer is slightly higher in energy. | ||||
| 10 | 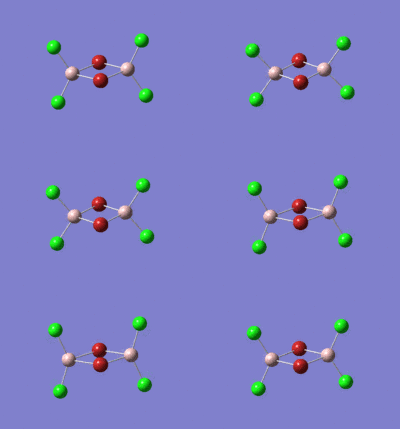 |
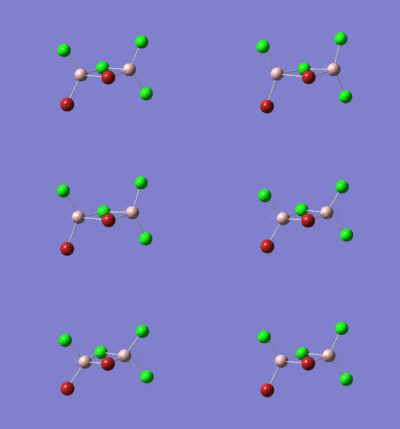 |
 |
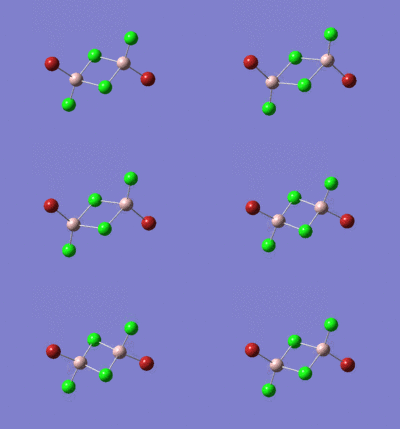
|
| For all isomers this vibrational mode is the symmetric stretch of the Al atoms in the plane of the bridging atoms. The vibrational frequency for isomer 1 is considerably lower than for the other isomers, and again the frequency for isomer 2 is lower by a small amount than isomers 3 and 4, which have the same vibrational frequency. | ||||
| 11 | 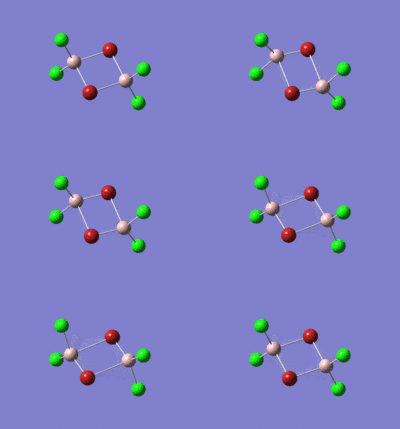 |
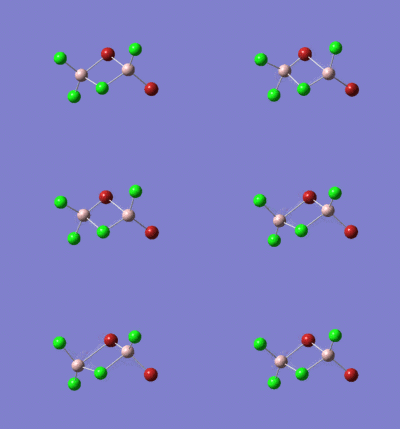 |
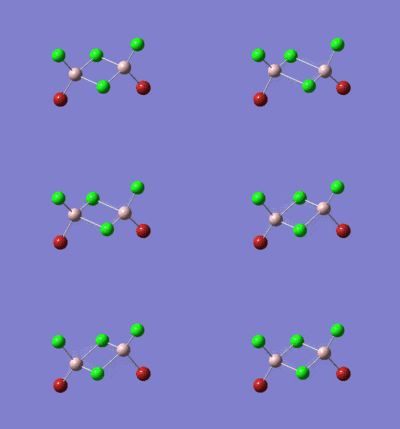 |

|
| For all isomers this vibrational mode is the asymmetric stretch of the bridging halide atoms. Hence, for the isomers with bridging bromides the stretching frequency is lower than for the isomers with bridging chlorides due to the weaker Al-Br bonds than Al-Cl bonds. | ||||
| 12 | 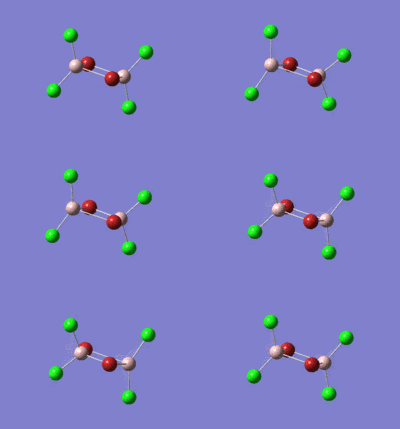 |
 |
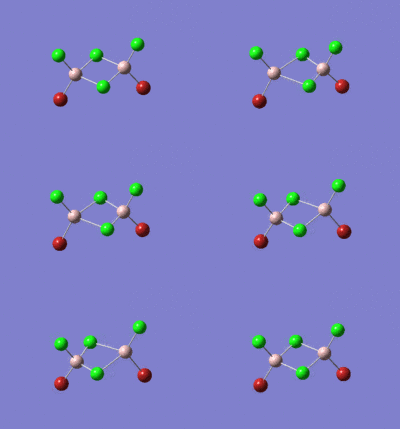 |

|
| For all isomers this vibrational mode is an asymmetric stretch of the bridging halide. The vibrational frequency is lowest for Isomer 1 due to the Al-Br bridging halide bond being weaker than the Al-Cl bridging bond of the other isomers. Again, Isomers 3 and 4 have very similar stretching frequencies, but isomer 4 is 1 cm-1 higher. | ||||
| 13 | 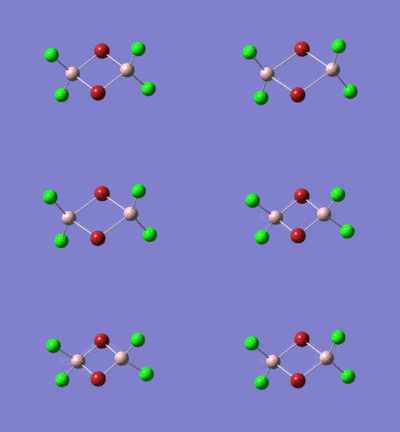 |
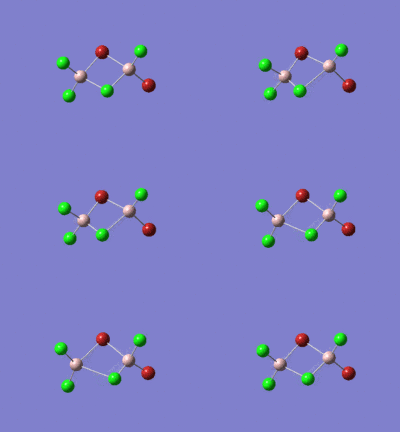 |
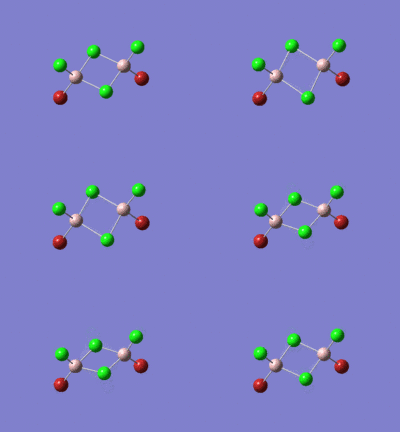 |
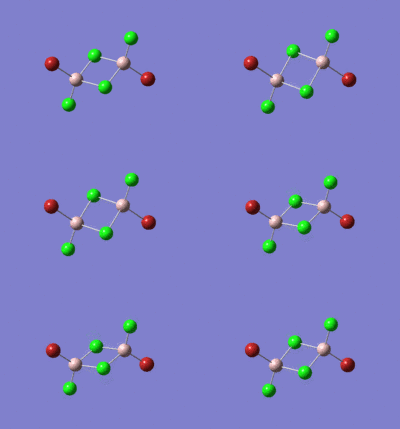
|
| For all isomers this vibrational mode is a symmetric stretch of the bridging halides in the plane of the bridging atoms. As a result, the vibrational frequency for Isomer 1 is 40 cm-1 lower than for Isomer 2 due to the presence of an Al-Br bridging bond in Isomer 1 which is replaced by an Al-Cl bridging bond in Isomer 2. The Al-Br bridging bonds are weaker than the corresponding Al-Cl bridging bonds. Isomers 3 and 4 have very similar vibrational frequencies, and the trans-isomer is slightly lower in energy than the cis-isomer. | ||||
| 14 | 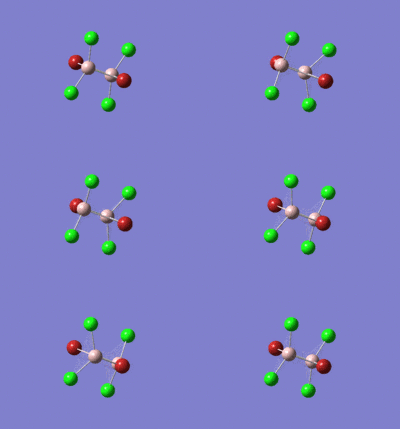 |
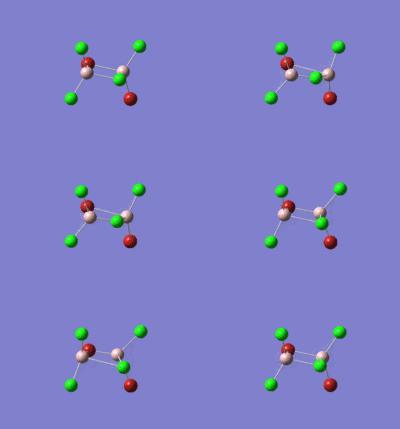 |
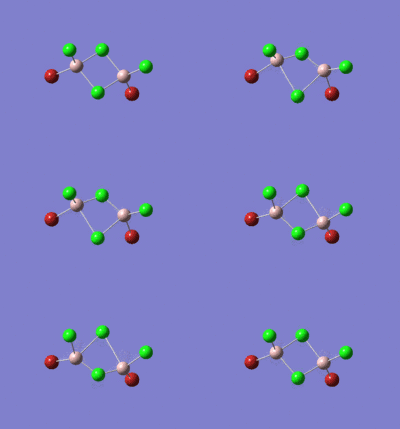 |
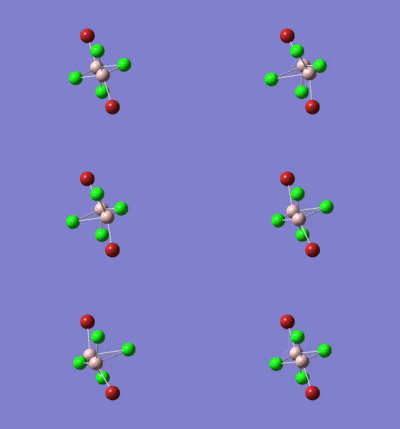
|
| For all isomers this vibrational mode is the antisymmetric stretch of bridging halides in the plane of the bridging atoms. For the same reasons as above, Isomer 1 has the lowest stretching frequency and isomers 3 and 4 have higher, almost equal, stretching frequencies. | ||||
| 15 | 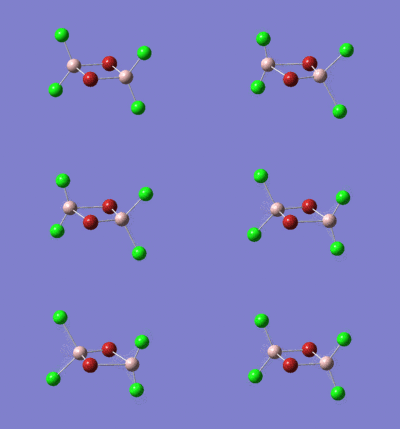 |
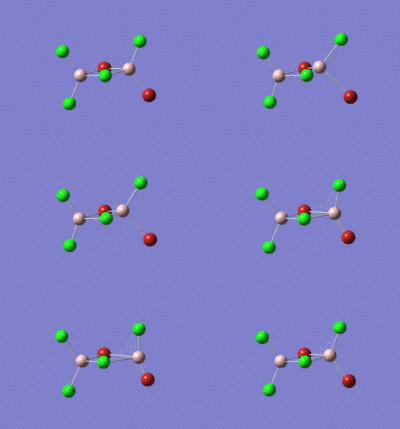 |
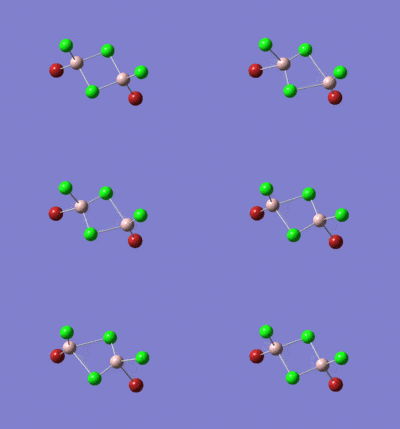 |
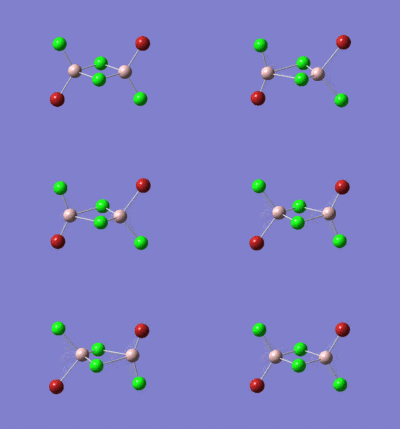
|
| For all isomers this vibrational mode is the symmetric stretching of terminal halide atoms. Isomer 1 has the highest frequency stretching mode showing that the Al-Cl terminal bonds are stronger than the corresponding Al-Br terminal bonds for Isomers 3 and 4. Isomers 2, 3 and 4 all have very similar stretching frequencies. The trans Isomer 4 has a higher vibrational frequency than the cis Isomer 3. | ||||
| 16 |  |
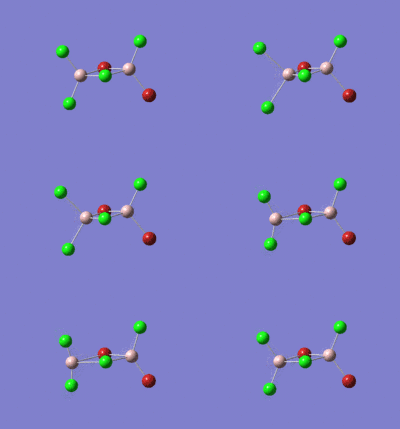 |
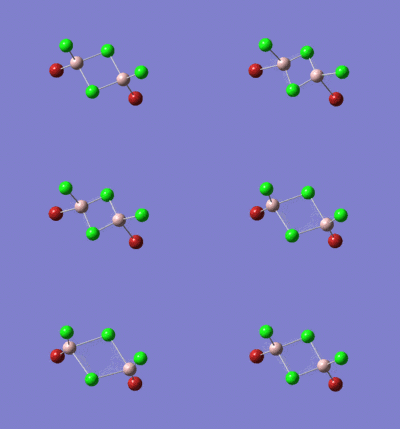 |
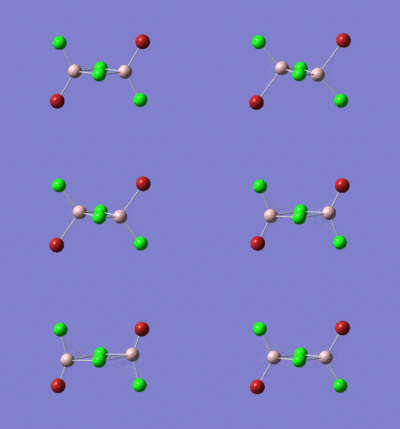
|
| For all isomers this vibrational mode is the symmetric stretching of terminal halide atoms, and for the reasons described for vibrational mode 15, Isomer 1 has the highest vibrational frequency. The trans Isomer 4 has a slightly lower vibrational frequency than the cis Isomer 3. | ||||
| 17 |  |
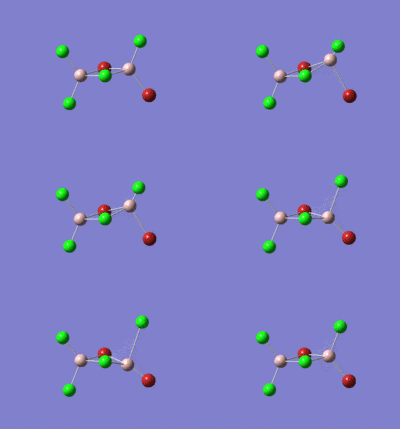 |
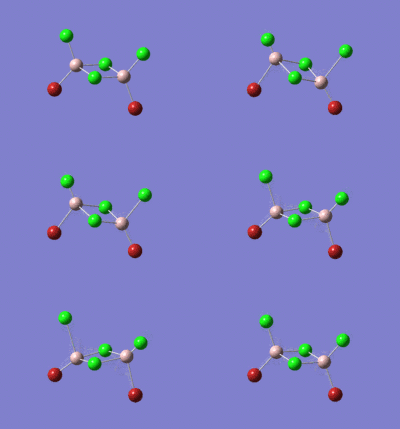 |

|
| For all isomers this vibrational mode is the antisymmetric stretching of terminal halide atoms, and for the reasons described for vibrational mode 15, Isomer 1 has the highest vibrational frequency. The trans Isomer 4 has a vibrational frequency 4 cm -1 higher than the cis Isomer 3. | ||||
| 18 | 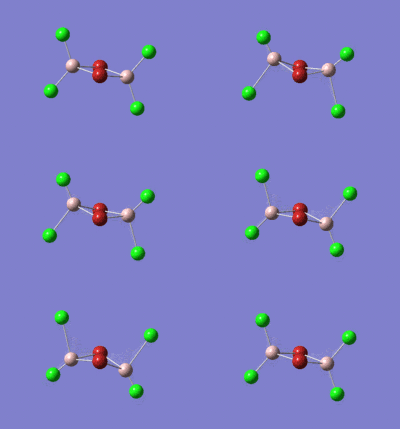 |
 |
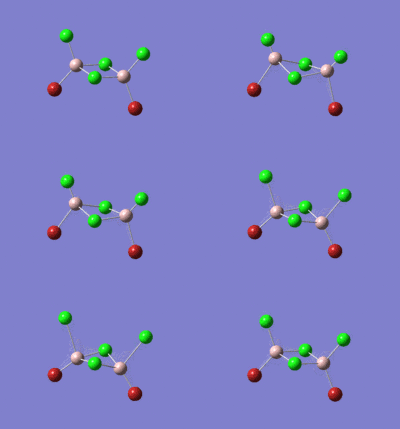 |
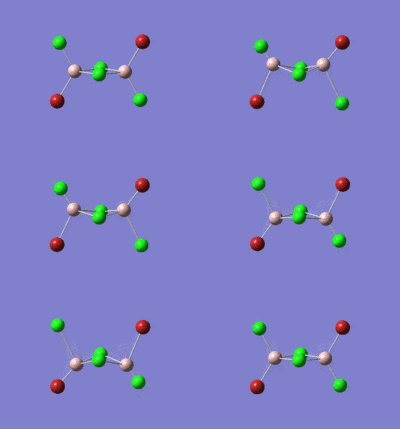
|
| For all isomers this vibrational mode is the antisymmetric stretching of terminal halide atoms, and for the reasons described for vibrational mode 15, Isomer 1 has the highest vibrational frequency. The trans Isomer 4 has a vibrational frequency 3 cm -1 lower than the cis Isomer 3. | ||||
| Isomer | Symmetry Group | Number of IR Inactive Stretches |
|---|---|---|
| 1 | D2h | 10 |
| 2 | C1 | 0 |
| 3 | C2v | 3 |
| 4 | C2h | 9 |
All isomers contain eight atoms and so there are 18 vibrational modes (3N-6, N=8) for each isomer. The D2h isomer, Isomer 1, has the spectrum with the least number of bands because ten of the vibrational modes do not have a dipole moment and so they are IR inactive and have an intensity of zero. Isomer 2 has the most peaks on the vibrational spectra because all of the vibrational modes result in a change in dipole moment and so all have an intensity greater than zero.
The overlaid IR spectra below show that despite the very similar vibrational modes between the isomers there are significant differences between the energies of the vibrational modes. Isomers 3 and 4 have very similar spectra, with Isomer 3 having a fairly intense IR stretch at 460 cm-1 not seen in Isomer 4 because this vibrational mode does not create a net dipole moment in Isomer 4.
References
- ↑ Custelcean R. et al. DOI:<302::AID-CHEM302>3.0.CO;2-K 10.1002/1521-3765(20020104)8:1<302::AID-CHEM302>3.0.CO;2-K
- ↑ Glasser J. (1979) Acta. Chem. Scand. A33, 789, T065
- ↑ Schwerdtfeger, P. and Ischtwan, S. (1993) J. Comp. Chem. 14, 8, 913-921
- ↑ Abdi, M. et al. DOI:[1]
- ↑ Iijima, K. et al., <it> Chem. Lett. </it>, 1983, 251
- ↑ Bondi (1964) J. Phys. Chem. 68, 441
- ↑ 7.0 7.1 7.2 Study of the N-H···H-B Dihydrogen Bond Including the Crystal Structure of T. L. Cottrell, The Strengths of Chemical Bonds, 2d ed., Butterworth, London, 1958
- ↑ Hoser, A. A., et al., DOI:10.1021/cg300337a
- ↑ 9.0 9.1 9.2 9.3 Alston, D. R. et al., 1985, <it> Tet </it> , 41, 2923, DOI:10.1016/S0040-4020(01)96617-7
- ↑ 10.0 10.1 10.2 Matus M. H. et al, (2009) J. Phys. Chem. 113, 16553-16560
- ↑ Shalov, Y. K. et al., Zhurnal Fizicheskoi Khimii, 1966, 122-124


