Rep:Mod:RUNAOns2
Analysis of BH3 and TIBr3
BH3
BH3 is optimized using Density Function Theory, B3LYP method and 3-21G basis set in Guassview 5.09.[1] The vibrational frequency and molecular orbitals of the molecule were also calculated.
Optimization of molecules can be described as a combination of two sets of calculations. Firstly, the Schrodinger equation is solved for the electron density when the nuclei are at specific positions and then the nuclei at a number or different positions. This is repeated for numerous nuclei positions until the lowest energy is obtained. It is clear from table 1 that Gaussview produces quiet an intuitive analysis of the molecule when it is first drawn. The bond angles of the molecules are as expected for trigonal planar molecules.
| Non-Optimized | Optimized | |
| BH Bond Length (± 0.01)/ Å | 1.18 | 1.19 |
| HBH Bond Angle (± 0.1°) / o | 120 | 120 |
| TlBr Bond Length /Å | 2.69 | 2.65 |
| BrTlBr Bond Angle /o | 120 | 120 |
| Calculation Type | Calculation Method | Basis Set | Spin | E(RB3LYP) (±10 kJ/mol) | RMS Gradient Norm | Dipole Moment (±0.01 Debye) | Point Group |
| FOPT | RB3LYP | 3-21G | Singlet | -26.46 a.u. (-69.5 kJmol-1) | 0.0 | 0.00 Debye | D3h |
It can be verified that optimization of BH3 went to completion by looking at DOI:10042/to-10827 . The final set of forces and displacements, shown below, is very close to zero, indicating that the energy and the placements have converged. Consequently small displacements in nuclei positions produce little or no change in the energy of the molecule. This section is checked after each optimization to confirm optimization of the molecule.
 Item               Value     Threshold  Converged?
 Maximum Force            0.000413     0.000450     YES
 RMS     Force            0.000271     0.000300     YES
 Maximum Displacement     0.001610     0.001800     YES
 RMS     Displacement     0.001054     0.001200     YES
 Predicted change in Energy=-1.071764D-06
 Optimization completed.
    -- Stationary point found.
                           ----------------------------
                           !   Optimized Parameters   !
                           ! (Angstroms and Degrees)  !
 --------------------------                            --------------------------
 ! Name  Definition              Value          Derivative Info.                !
 --------------------------------------------------------------------------------
 ! R1    R(1,2)                  1.1935         -DE/DX =    0.0004              !
 ! R2    R(1,3)                  1.1935         -DE/DX =    0.0004              !
 ! R3    R(1,4)                  1.1935         -DE/DX =    0.0004              !
 ! A1    A(2,1,3)              120.0            -DE/DX =    0.0                 !
 ! A2    A(2,1,4)              120.0            -DE/DX =    0.0                 !
 ! A3    A(3,1,4)              120.0            -DE/DX =    0.0                 !
 ! D1    D(2,1,4,3)            180.0            -DE/DX =    0.0                 !
 --------------------------------------------------------------------------------
 GradGradGradGradGradGradGradGradGradGradGradGradGradGradGradGradGradGrad
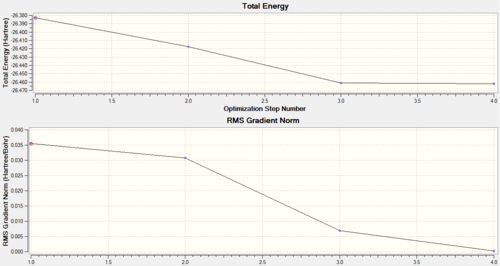
Results from the optimization of BH3 produces two graphs which inform the user of the optimization journey taken to obtained the final optimized molecule. The first graph, total energy (in Hatree) versus optimization steps, shows how the energy of the molecule decreases. Energy of the molecule decreases as more optimization steps are performed. Optimization of a molecule is similar to moving along a potential energy versus inter-nuclei distance. The Schrodinger equation is solved for the nuclei in a certain position, and then another position, if the second energy is lower the optimization method follows that path of changes. This continues until the molecules reaches an energy well, where further changes in inter-atomic distance will raise the energy of the molecule. The gradient graph gives the rate of change of the energy of the molecule with each optimization step. As the overall energy of the molecule begins to plateau, the gradient tends to zero. This signifies a completed optimization, as changes in the nuclei position results in no changes in energy.
Vibrational Analysis of BH3
Using the optimized structure of BH3, DOI:10042/to-10828 the vibrational frequency of the molecule was calculated on SCAN. The method and basis set is used for the analysis of each molecule in this project need to be consistent in order to obtain comparable information.
# freq b3lyp/3-21g geom=connectivity pop=(full,nbo)
|
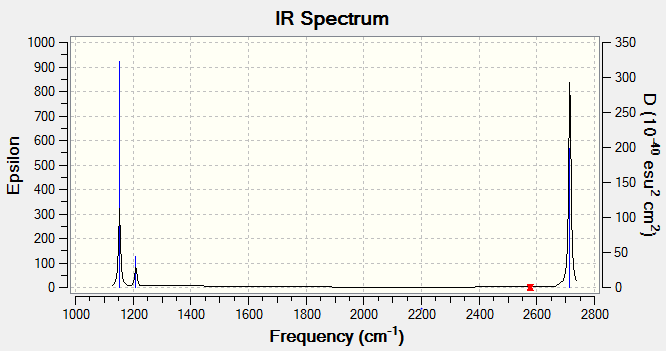
Information from table 3 suggests three will only be three peaks in the IR spectrum of BBH3. This is because one of the stretching modes is IR inactive and two pairs of vibrations are degenerate.
The symmetry labels of the vibrations were found by considering the effect of the symmetry operations in the D3h character table for the bonds and the bond angle. A reduced representation table is produced from this information and the symmetry labels can be deduced from this. The bending A"2, E' is both IR active, this can be seen in the character table by looking at the terms in the far left. Symmetries associated with the x, y and z are IR active. Similarly the stretching E' vibrations are are IR active however the A' stretch is IR inactive. As expected from the stretches the A' vibrations produce no change in dipole and consequently IR inactive. Similarly the pairs of degenerate E' vibrations must produce the same magnitude of change in the dipole and hence absorb at the same wavelength and have the same intensity.
Wet laboratory work would only have produced three bands in the IR spectrum of Bh3.Computational tools are useful in this case because the expected wavelength of the non IR active stretch can be predicted to ±10% wave-numbers and the degenerate vibrations can be easily identified.
Examining the output file for the frequency calculation, more vibrational frequencies are recorded than Gaussview reports in the results screen. The six unreported vibrational frequencies relate to the translational motion of the center of mass of the molecules. These frequencies should be minimized. They serve as a good indication of how good the basis set being used is. Generally, these "zero" frequencies should be between ±10 cm-1. As this is not the case in this situation, it can be concluded that it may be beneficial to use a smaller basis set. This frequency was repeated using 6-31g basis set and the wave-number of the low-frequencies overall get closer to zero.
Data from output file when using 3-21g basis set:
Low frequencies ---  -66.7615  -66.3592  -66.3589   -0.0020    0.0031    0.2123
 Low frequencies --- 1144.1483 1203.6414 1203.6425
Data from output file when using 6-31g basis set:
Low frequencies ---   -0.3355   -0.0330   -0.0045   28.9405   30.1703   30.1722
 Low frequencies --- 1152.7700 1209.6407 1209.6430
Molecular Orbital of BH3
The molecular orbitals of BH3 were also calculated using Gaussian, DFT, B3LYP method and 3-21g basis set. Below is the method used to calculate MOs. Log file of the MO calculation of BH3 can be found at this D-space DOI:10042/to-10829 .
# b3lyp/3-21g pop=(nbo,full) geom=connectivity
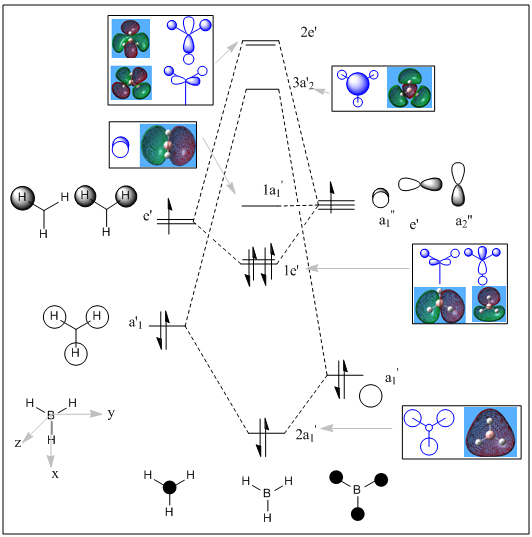
Molecular orbitals calculated by Guassian agree with the molecular orbitals predicted by Linear Combination of Atomic Orbitals. However orbital contributions of hydrogen and boron orbitals appear to be very similar. Some difference in the orbital sizes should be seen because hydrogen (2.20) is more electronegative than Boron (2.04 ). Therefore, the hydrogen fragment orbitals should contribute more to the bonding orbitals. Meanwhile, the anti-bonding orbitals should be larger on Boron atom. From the images of the MO of BH3, it is clear that the molecule is a lewis acid because the LUMO corresponds to an empty p orbital on Boron.
| Molecular Orbital | 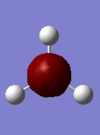 |
 |
 |
 |
 |
 |
 |

|
| Orbital | Boron 1s orbital, HOMO-3 | HOMO-2 | HOMO-1 | HOMO | LUMO | LUMO+1 | LUMO+2 | LUMO+3 |
Natural Bonding Orbitals of BH3
The Natural bonding analysis partitions the electron density of the whole molecule into atomic like orbitals which have been used to form 2e-2c bonds. Below are extracts from the log file of the molecular orbital calculation for BH3.
 Summary of Natural Population Analysis:

                                       Natural Population
                Natural  -----------------------------------------------
    Atom  No    Charge         Core      Valence    Rydberg      Total
 -----------------------------------------------------------------------
      B    1    0.27816      1.99954     2.72230    0.00000     4.72184
      H    2   -0.09272      0.00000     1.09256    0.00015     1.09272
      H    3   -0.09272      0.00000     1.09256    0.00015     1.09272
      H    4   -0.09272      0.00000     1.09256    0.00015     1.09272
 =======================================================================
   * Total *    0.00000      1.99954     6.00000    0.00046     8.00000
       (Occupancy)   Bond orbital/ Coefficients/ Hybrids
 ---------------------------------------------------------------------------------
     1. (1.99854) BD ( 1) B   1 - H   2
                ( 45.36%)   0.6735* B   1 s( 33.33%)p 2.00( 66.67%)
                                            0.0000  0.5774  0.0000  0.0000  0.0000
                                            0.8165  0.0000  0.0000  0.0000
                ( 54.64%)   0.7392* H   2 s(100.00%)
                                            1.0000  0.0001
     2. (1.99854) BD ( 1) B   1 - H   3
                ( 45.36%)   0.6735* B   1 s( 33.33%)p 2.00( 66.67%)
                                            0.0000  0.5774  0.0000  0.7071  0.0000
                                           -0.4082  0.0000  0.0000  0.0000
                ( 54.64%)   0.7392* H   3 s(100.00%)
                                            1.0000  0.0001
     3. (1.99854) BD ( 1) B   1 - H   4
                ( 45.36%)   0.6735* B   1 s( 33.33%)p 2.00( 66.67%)
                                            0.0000  0.5774  0.0000 -0.7071  0.0000
                                           -0.4082  0.0000  0.0000  0.0000
                ( 54.64%)   0.7392* H   4 s(100.00%)
                                            1.0000  0.0001
     4. (1.99954) CR ( 1) B   1           s(100.00%)
                                            1.0000  0.0000  0.0000  0.0000  0.0000
                                            0.0000  0.0000  0.0000  0.0000
     5. (0.00000) LP*( 1) B   1           s(100.00%)
...
13. (0.00147) BD*( 1) B   1 - H   2
                ( 55.52%)   0.7451* B   1 s( 33.33%)p 2.00( 66.67%)
                                            0.0000  0.5774  0.0000  0.0000  0.0000
                                            0.8165  0.0000  0.0000  0.0000
                ( 44.48%)  -0.6669* H   2 s(100.00%)
Information in the extracts above, gives the percentage contribution of electron density for each bond in the molecule. For example, line 1 shows electronic contribution and the hybridisation of the atomic orbitals in the bond is between B(atom 1) and hydrogen(atom 2. 45% of the orbital/electron density in the bond comes from an sp2 hybridized boron orbital. The hybridized orbital consists of 33% of the 1s orbital, and 67% of the 2p orbital, ergo sp2. 55% of the electron density in the bond comes from the hydrogen atom. Likewise in the anti-bonding orbitals as shown by line 13, the anti-bonding orbital orbital is larger on boron 55% compared to hydrogen 45%. This is consistent with the argument made above regarding the orbital contributions of hydrogen and boron.
Natural Bond Orbitals (Summary):

                                                            Principal Delocalizations
           NBO                        Occupancy    Energy   (geminal,vicinal,remote)
 ====================================================================================
 Molecular unit  1  (H3B)
     1. BD (   1) B   1 - H   2          1.99854    -0.43328
     2. BD (   1) B   1 - H   3          1.99854    -0.43328
     3. BD (   1) B   1 - H   4          1.99854    -0.43328
     4. CR (   1) B   1                  1.99954    -6.68393  10(v),11(v),12(v)
     5. LP*(   1) B   1                  0.00000     0.53915
     6. RY*(   1) B   1                  0.00000     0.37512
     7. RY*(   2) B   1                  0.00000     0.37512
     8. RY*(   3) B   1                  0.00000    -0.04064
     9. RY*(   4) B   1                  0.00000     0.41499
    10. RY*(   1) H   2                  0.00015     0.73308
    11. RY*(   1) H   3                  0.00015     0.73308
    12. RY*(   1) H   4                  0.00015     0.73308
    13. BD*(   1) B   1 - H   2          0.00146     0.42130
    14. BD*(   1) B   1 - H   3          0.00146     0.42130
    15. BD*(   1) B   1 - H   4          0.00146     0.42130
       -------------------------------
              Total Lewis    7.99516  ( 99.9396%)
        Valence non-Lewis    0.00437  (  0.0547%)
        Rydberg non-Lewis    0.00046  (  0.0058%)
       -------------------------------
            Total unit  1    8.00000  (100.0000%)
           Charge unit  1    0.00000
The extract above shows the occupancy of orbitals in BH3. The "number of electrons" in each orbital is less than two, illustrating the probability of finding an electron in any of the orbitals in the molecule. Also, again the LUMO here is shown to be an empty p-orbital on Boron.
Thallium Tribromide
Thallium tribromide, planar with D3h symmetry, was drawn on Guassview 5.09, then optimized using DFT, B3LYP method and LanL2DZ basis set. The log file for the optimization of TlBr3, DOI:10042/to-10831 . The calculated TlBr bond length and BrTlBr bond angle, as given in table 1 is 2.65 Å and 120o. Thallium bromide bond length in aqueous solution can be expected to be 2.52 Å according to literature.[2] Likewise, M. Atanasov, and D. Reinen, have calculated that the thallium bromide bond to be 2.55 Å, this suggests that the calculation conducted here could be improved, possibly by using a better basis set, or including d and f orbitals of bromine and thallium in the calculation.[3]
# opt b3lyp/lanl2dz geom=connectivity
| Calculation Type | Calculation Method | Basis Set | Spin | E(RB3LYP) | RMS Gradient Norm | Dipole Moment | Point Group |
|---|---|---|---|---|---|---|---|
| FOPT | RB3LYP | LANL2DZ | Singlet | -91.22 a.u. | 0.00 a.u. | 0.00 Debye | D3h |
Vibrational Analysis of TlBr3
Vibrational frequency of thallium bromide was calculated using the method given below.
# freq b3lyp/lanl2dz geom=connectivity pop=(full,nbo)
TlBr3 has the same symmetry as Bh3, D3h, consequently it would be expected that the vibrations also have the same symmetry labels. Nevertheless the vibrations are not occurring in the same order as in borane. Furthermore, the vibrations are taking place at lower wavelength as expected. If the bond is model on Hooke's Law, and frequency is inversely proportional to reduced mass, then Tl-Br should vibrations should occur at lower frequencies because bromine is much larger than hydrogen.
The vibrational modes observed for TlBr3 are the same as those observed for BH3 since the two molecules shave the same geometry and thallium and boron are in the same group. The major difference is the wave-numbers. Because of poor overlap of orbitals due to the diffuse nature of orbitals lower down the group, the bond strength of Tl-Br is weak, also larger atoms means smaller wave-number are being absorbed.
Molecular Orbital of TlBr3
The molecular orbitals of TlBr3 was calculated using a similar procedure to BH3.
# b3lyp/lanl2dz pop=(nbo,full) geom=connectivity
| Molecular Orbital |  |
 |
 |
 |
 |
 |

|
| Orbital | HOMO-2 | HOMO-1 | HOMO | LUMO | LUMO+1 | LUMO+2 | LUMO+3 |
At first the HOMO-2 to HOMO orbitals obtained for TlBr3 appear very different to those of BH3, but on short contemplation, they make very good sense. The highers occupied orbitals should obviously be the lone pairs on the bromine atoms. In addition to these the d-orbital electrons also appear in the Homo as well.
Showing the charge distribution through the colour is not very efficient because it is very qualitative and open to personal interpretation. Information from the log file of the MO calculation gives the numerical charge distribution in the molecule.
Mulliken charges with hydrogens summed into heavy atoms:
              1
     1  Tl   0.773586
     2  Br  -0.257862
     3  Br  -0.257862
     4  Br  -0.257862
Bromine is more electronegative than thallium and the partial positive charge of thallium balances the total negative charge of the bromine atoms.
Natural Bonding Orbital of TlBr3
 Summary of Natural Population Analysis:

                                       Natural Population
                Natural  -----------------------------------------------
    Atom  No    Charge         Core      Valence    Rydberg      Total
 -----------------------------------------------------------------------
     Tl    1    1.20173     77.98822     1.79945    0.01060    79.79827
     Br    2   -0.40058     28.00000     7.39995    0.00063    35.40058
     Br    3   -0.40058     28.00000     7.39995    0.00063    35.40058
     Br    4   -0.40058     28.00000     7.39995    0.00063    35.40058
 =======================================================================
   * Total *    0.00000    161.98822    23.99930    0.01248   186.00000
         (Occupancy)   Bond orbital/ Coefficients/ Hybrids
 ---------------------------------------------------------------------------------
    15. (1.94766) LP ( 3)Br   3           s(  0.00%)p 1.00(100.00%)
                                            0.0000  0.0000  0.0000  0.0000  0.0000
                                            0.0000  1.0000 -0.0052
    16. (1.97996) LP ( 1)Br   4           s( 94.75%)p 0.06(  5.25%)
                                            0.9734 -0.0002 -0.1985  0.0020 -0.1146
                                            0.0012  0.0000  0.0000
    17. (1.96993) LP ( 2)Br   4           s(  0.00%)p 1.00(100.00%)
                                            0.0000  0.0000 -0.5000  0.0019  0.8660
                                           -0.0033  0.0000  0.0000
    18. (1.94766) LP ( 3)Br   4           s(  0.00%)p 1.00(100.00%)
                                            0.0000  0.0000  0.0000  0.0000  0.0000
                                            0.0000  1.0000 -0.0052
    19. (1.50274) LP ( 4)Br   4           s(  5.25%)p18.04( 94.75%)
                                            0.2292  0.0012  0.8429  0.0111  0.4866
                                            0.0064  0.0000  0.0000
Mo(CO)4L2
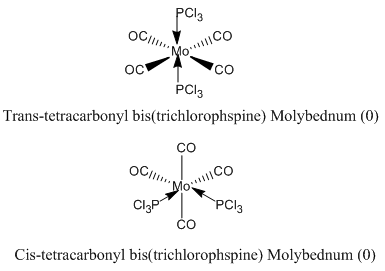
Complexes of the form MA4B2, where M is a metal and A and B are ligands, can exist as two isomers, trans and cis. This project aims to examine the spectra of the the cis and trans isomers of Mo(CO)4(PPh3)2. However, calculation of the full complex is relatively expensive, and to conserve resources the phenyl rings have been replaced with chlorine atoms as these have similar electronic contributions to the bonding as phenyl groups and are sterically quite large.
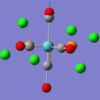
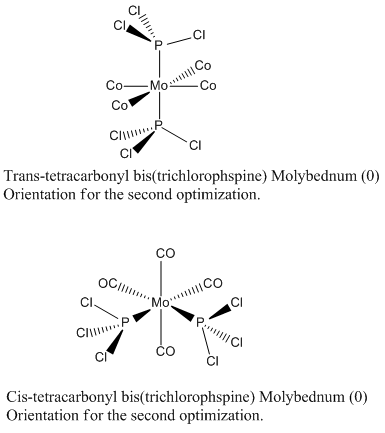
In order to calculated the spectrum of the complexes, the ground state of the two isomers are optimized using B3LYP method. At first low basis set and then pseudo-potential LANL2MB was used to find a roughly optimized structure. This pseudo-potential gives good angles and bond lengths however the orientation of the PCl3 can affect which minima is found. In order to optimize to the lowest energy minima, the PCl3 are rotated to the structures below. These structures were then optimized using B3LYP method and LAN2LDZ. To further improve the optimized structures, the cis and trans structures were optimized again, but this time with extra basis set for the phosphorus atoms, dAO functions were manually to the log file of the second optimization.
The trans isomer belongs to the D2h whilst the cis-isomer belongs to the C2v point group. These symmetries, in hindsight, should have been fixed for each of these complexes because the summary of the results gives them C1 symmetry.
 |
 |
Trans Mo(CO)4(PCl3)2
The complex in question was optimized using DFT, B3LYP method with LANL2MB basis set. The output for for the trans-complex optimization DOI:10042/to-10531 . After the molecules were made eclipsed, there were optimised again; DOI:10042/to-10911 The suggested improvement for the opimisation was also carried out; DOI:10042/to-10911 .
# opt=loose b3lyp/lanl2mb geom=connectivity
.
| No. | 43 | 42 | 41 | 40 | 39 | 33 |
| Form of Vibration | 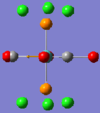 |
 |
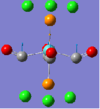 |
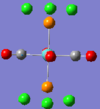 |
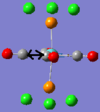 |
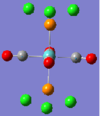
|
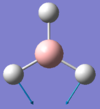
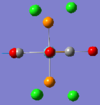
| Vibration Description | Assymetric stretches of two CO groups opposite each other. | Assymetric stretches of the other two CO groups opposite each other. | All the carbon atoms are displacing themselves up and down the σh plane of the molecule, (in the same directions as the blue arrows). | The same motion as above, but now comming out of the plane of the page. | Two of the carbon atoms are displacing themselves side to side in the direction indicated by the arrows. | The same motion as above, but now comming out of the plane of the page. |
| Frequency /cm-1 | 1952.29 | 1951.63 | 598.97 | 572.90 | 572.70 | 411.49 |
| Intensity | 1479.69 | 1486.46 | 125.53 | 89.92 | 88.49 | 102.55 |
Cis Mo(CO)4(PCl3)2
The cis-complex was optimised using the same method and basis set mentioned above, DOI:10042/to-10914 . The D-space for optimization of the eclipsed cis-isomer: DOI:10042/to-10913 . Optimization of the cis-isomer with extra basis set for the phosphorus can be seen here: DOI:10042/to-10908 .
Discussion
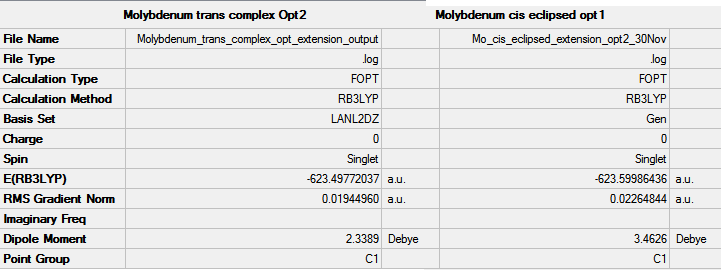
The energy of the trans isomer is -1637.99 MJmol-1 which is 268 KJmol-1 larger than the cis-isomer (-1637.26 MJmol-1). Consequently the cis-isomer is the most stable complex. This difference is larger than the error in the calculation of the energy therefore, it can be asserted that the cis-isomer is the more thermodynamically favored conformation.
Increasing the steric size of the ligands can make the trans isomer more thermodynamically favored because large groups would prefer to be trans and avoid repulsions. Also, being trans would degrees torsional strain with the complex.
In both complexes the vibrations at low wave-numbers refer to movements of many groups of atoms in the molecule. Some of these vibrations have been described in the table 8. The low en
Four carbonyl stretches are observed for the cis-isomer and two for the trans-isoer, these conform to expectation and literature.[4]
Mini Project
This mini project is investigating the reaction of fluoronium ion with hydrogen fluoric acid, fluoride (1:1).
H2F+ + HF2- → 3HF
To find out whether this is a thermodynamically favorable reaction, the bonding within the molecules and the effect of hydrogen bonding in the stability of the system.
Each of the species in the reaction above was optimized using Density Function Theory, B3LYP method, 6-31g basis set, and then the frequency and molecular orbitals calculated. The table below gives all the information obtained on these molecules.
| H2F+ | HF2- | HF | |
|---|---|---|---|
| Optimization | DOI:10042/to-10684 | DOI:10042/to-10687 | DOI:10042/to-10692 |
| Energy /a.u. (MJmol-1) | -100.60 (-264.13) | -200.27 (-525.81) | -100.40 (-263.60) |
| H-F Bond Length/ Å | 0.99 | 1.17 | 0.95 |
| Gradient / a.u. | 0.00017 | 0.0000048 | 0.000093 |
| Point Group | C2v | D∞h | C∞v |
| Frequency | DOI:10042/to-10685 | DOI:10042/to-10688 | DOI:10042/to-10693 |
| Spectra |  |
 |
|
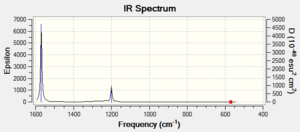
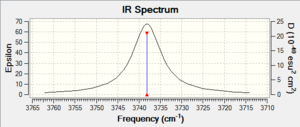
| Peaks /cm-1, intensity | 1287.65, 386.57 | 569.93cm, 0.00 | 3738.15, 19.60 |
| 3214.96, 153.35 | 1199.90, 196.42 | - | |
| 3247.50, 946.00 | 1190.90, 196.42 | - | |
| 1569, 1859.94 | - | ||
| Molecular Orbitals | DOI:10042/to-10686 | DOI:10042/to-10691 | DOI:10042/to-10725 |
| Orbitals | |||
| 3214.96, 153.35 | 1199.90, 196.42 | - | |
| 3247.50, 946.00 | 1190.90, 196.42 | - | |
| 1569, 1859.94 | - |
| Molecular Orbital |  |
 |
 |
 |
 |

|
| Orbital | 2a1 | 3a1 | 1b1 | 1b2 | 4a1 | 2b1 |
| Molecular Orbital |  |
 |
 |
| Molecular Orbital |  |
 |
 |
 |
File:MO10 HF2 minus.PNG | |
| Orbital | 2a1 | 3a1 | 1b1 | 1b2 | 4a1 | 2b1 |
| Molecular Orbital |  |
 |
File:Aa.PNG |
Discussion
Determining the the structure of H2F+ is the first obstacle to tackle in this project. Computational calculations have made this much easier compared to experimental methods. The calculated spectra is neat, without solvent effects, hydrogen bonding would have made the peaks broad for exampl in the HF spectrum. Futhermore, there are no counter ions bands to consider. Couzi et. al., explained that the hypothesis of a liner fluoronium ion was rejected, after the two peaks near 3000 cm-1 were said not be caused by crystal splitting.[5] In the above literature the difference in the wavenumbers of these peaks are much greater than (~100 cm-1) than in the calculated. Nevertheless, fluoronium ion would be said to conform to the 3N-6 vibrational modes for a non-linear molecule. Furthermore the ions similarity to water allows good comparison for the expected number of absorption bands. The bands obtained here, is in agreement with the experimental data of Couzi (weak shoulder, 3200 cm-1, 3080, 2970, 1680 cm-1. Meanwhile HF2-1 is linear with Dh, and produces four IR absorption bands.
Considering just the energies of the species in the reaction, it appears the reaction is thermodynamically favored. The free energy of the system decreases by -860 kJmol-1on moving from reacts to product. Also, taking hydrogen bonding into consideration DOI:10042/to-10974 the there is little difference in the energy compared to three HF molecules.
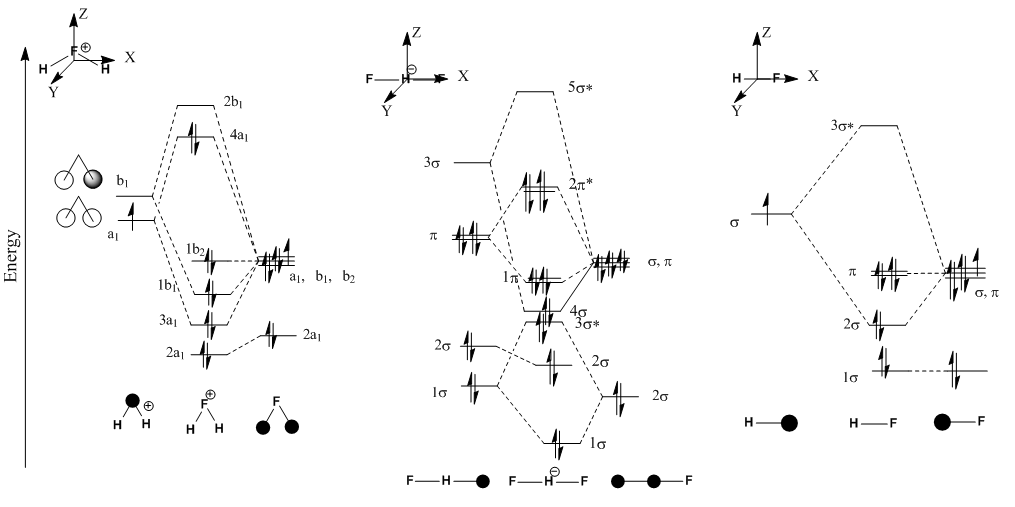
The LCAO don't a correspond to the MO given my guassian, for example the LUMOs where there are internal nodes and orbitals with orbitals.
Conclusion
On the whole this project has been an eye opener for the use of computational chemistry. For example, the information on vibrational frequency is very valuable when compared to the information obtained from IR spectra along. The number of peaks in the IR spectra don't always correspond to the bands reported by Gaussian. Working with IR alone can be miss leading especially for degenerate stretches and overlapping bands.
- ↑ J. U. Reveles, A. M. Köster, J. Comput. Chem., 2004, 25, 9, pages 1109–1116. Template:DOI: 10.1002/jcc.20034
- ↑ J. Blixt, J. Glaser,J. J. Mink, I.Persson,P. Perssondl and M. Sandstrom;J. Am. Chem. SOC. 1995,117, pages 5089-5104
- ↑ M. Atanasov, and D. Reinen,J. Am. Chem. SOC. 2001, 105, pages 5450-5467
- ↑ J. M. JENKINS AND J. G. VERKADE,Inorg. Chem.1967, 6 (12), pp 2250–225. DOI:10.1021/ic50058a026
- ↑ Michel Couzi, JeanClaude Cornut, and Pham Van Huong, J. Chem. Phys., 1972 56, 426; Template:DOI: 10.1063/1.1676884


