Rep:Mod:RS7913
Introduction To Molecular Modelling 2
NH3
An optimisation was run on an NH3 molecule created using GaussView, with modified bond lengths of 1.3 Å, using Gaussian.
Calculation method: RB3LYP                       Basis set: 6-31G(d,p)
Final energy E(RB3LYP): -56.55776873 a.u.        RMS gradient: 0.00000485 a.u.
Point group: C3v                                 Optimised N-H bond distance: 1.01798 Å
Optimised N-H-N bond angle: 105.741 °


         Item               Value     Threshold  Converged?
 Maximum Force            0.000004     0.000450     YES
 RMS     Force            0.000004     0.000300     YES
 Maximum Displacement     0.000072     0.001800     YES
 RMS     Displacement     0.000035     0.001200     YES
We can see that the force values have converged, hence we have reached a minimum in the potential energy surface, indicating the most stable conformation of the molecule has been found i.e. the optimisation has been successful.
Visualisation Of The Optimised NH3 Molecule
Ammonia |
"Display Vibrations"
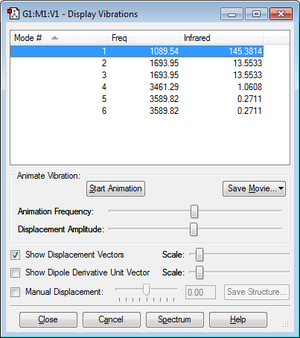
From the 3N - 6 rule, 3(4) - 6 = 6 vibrational modes would be expected, as we can see in the "Display Vibrations" window above. Vibrations 2 and 3, and 5 and 6 as shown in the table above are degenerate. Modes 1, 2 and 3 are "bending" vibrations, whilst modes 4, 5 and 6 are "stretching" vibrations. Mode 4 is highly symmetric. Mode 1 is known as the "umbrella" mode. In an experimental IR spectrum of gaseous ammonia, I would expect to see 2 bands - one corresponding to mode 1, and the other corresponding to modes 2 and 3, since they are degenerate. The stretching modes are accompanied by a change in dipole moment that is very small, meaning that the intensity of IR absorption due to these modes are very small, and I would not expect to see peaks corresponding to them in the IR spectrum. This is reflected by the very small values of infared intensity for modes 4, 5 and 6 in the "Display Vibrations" table above.
Charge Analysis
Charge on N-atom: -1.125 a.u. Charge on H-atoms: +0.375 a.u.
I would expect nitrogen to be negatively charged and hydrogen to be positively charged, as can be seen above, since nitrogen is more electronegative than hydrogen. This agrees with the calculated charges shown above.
Investigating The Haber-Bosch Process
Optimisation Of An N2 Molecule
Nitrogen |
Optimisation Log File Nitrogen
Calculation method: RB3LYP                           Basis set: 6-31G(d,p)
Final energy E(RB3LYP): -109.52412868 a.u.           RMS gradient: 0.00000060 a.u.
Point group: D∞h                                     Optimised N-N bond distanceː 1.10550 Å


         Item               Value     Threshold  Converged?
 Maximum Force            0.000001     0.000450     YES
 RMS     Force            0.000001     0.000300     YES
 Maximum Displacement     0.000000     0.001800     YES
 RMS     Displacement     0.000000     0.001200     YES
It was found that the N2 molecule has one stretch of frequency 2457.33 that is not IR active, since it is not accompanied by any change in dipole moment because N2 is a homonuclear diatomic molecule. This is what we would expect, since linear molecules are predicted to have 3N - 5 vibrational modes, which corresponds to 1 mode for a linear diatomic.
Optimisation Of A H2 Molecule
Hydrogen |
Optimisation Log File Hydrogen
Calculation method: RB3LYP                         Basis set: 6-31G(d,p)
Final energy E(RB3LYP): -1.17853936 a.u.           RMS gradient: 0.00000017 a.u.
Point group: D∞h                                   Optimised H-H bond distanceː 0.74297 Å

         Item               Value     Threshold  Converged?
 Maximum Force            0.000000     0.000450     YES
 RMS     Force            0.000000     0.000300     YES
 Maximum Displacement     0.000000     0.001800     YES
 RMS     Displacement     0.000001     0.001200     YES
It was found that the H2 molecule has one stretch of frequency 4465.68 that is also not IR active, because H2 is also a homonuclear diatomic molecule, hence this vibration is not accompanied by any change in dipole moment. This is what we would expect, since linear molecules are predicted to have 3N - 5 vibrational modes, which corresponds to 1 mode for a linear diatomic.
Reaction Energy Of The Harber-Bosch Process
E(NH3)= -56.55776873 a.u.
2*E(NH3)= -113.11553746 a.u.
E(N2)= -109.52412868 a.u.
E(H2)= -1.17853936 a.u.
3*E(H2)= -3.53561808 a.u.
ΔE=2*E(NH3)-[E(N2)+3*E(H2)]= -0.0557907 a.u. = -146.48 kJ/mol
Since the energy associated with this reaction is highly negative, it suggests that the ammonia product is more stable than the reactant gases, nitrogen and hydrogen.
Investigation Of SiH4
Optimisation Of A SiH4 Molecule
Calculation method: RB3LYP                           Basis set: 6-31G(d,p)
Final energy E(RB3LYP): -291.88802760 a.u.           RMS gradient: 0.00000002 a.u.
Point group: Td                                      Optimised Si-H bond distance: 1.48485 Å
Optimised H-Si-H bond angle: 109.471 °


         Item               Value     Threshold  Converged?
 Maximum Force            0.000000     0.000450     YES
 RMS     Force            0.000000     0.000300     YES
 Maximum Displacement     0.000000     0.001800     YES
 RMS     Displacement     0.000000     0.001200     YES
Visualisation Of The Optimised SiH4 Molecule
Silane |
Frequency Analysis
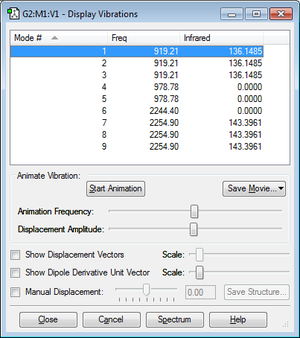
From the 3N - 6 rule, 3(5) - 6 = 9 vibrational modes would be expected, as we can see in the "Display Vibrations" window above. Vibrations 2 and 3, and 5 and 6 as shown in the table above are degenerate. In an experimental IR spectrum of gaseous ammonia, I would expect to see 2 bands - one corresponding to modes 1, 2 and 3, and the other corresponding to modes 7, 8, and 9, since these sets are degenerate. The bending modes 4 and 5 are symmetric and not accompanied by a change in dipole moment, hence they are not IR active and the infared intensity in the "Display Vibrations" table above is 0.
Charge Analysis
Charge on Si-atom: 0.629 a.u. Charge on H-atoms: -0.157 a.u.
I would expect silicon to be positively charged and hydrogen to be negatively charged, as can be seen above, since hydrogen is more electronegative than silicon. This agrees with the calculated charges shown above.
Molecular Orbitals
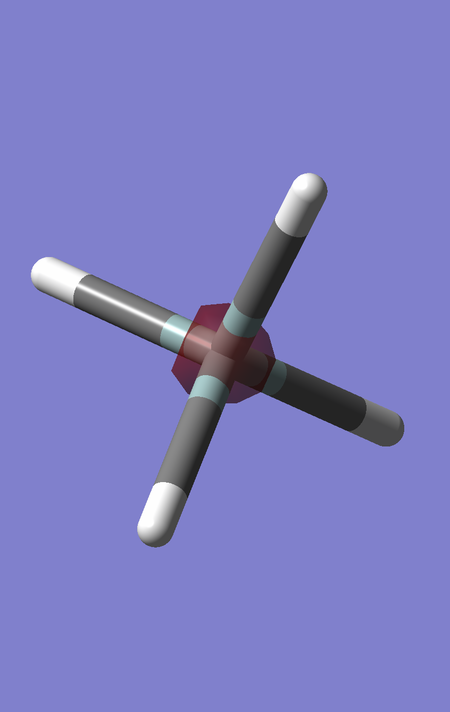
MO1 is of energy -66.12596 a.u., and corresponds to the 1s orbital of Si, which is not involved in any significant bonding since it is so low in energy. It can be seen that the electron density is localised on the Si atom and that this MO is small, due to the strong effective nuclear charge experienced by these electrons, since silicon has 14 protons in its nucleus. By contrast, hydrogen has only 1 proton in its nucleus, therefore the nuclear charge experienced by its electron in a 1s orbital is much smaller, hence this orbital is a lot higher in energy than the 1s of silicon.
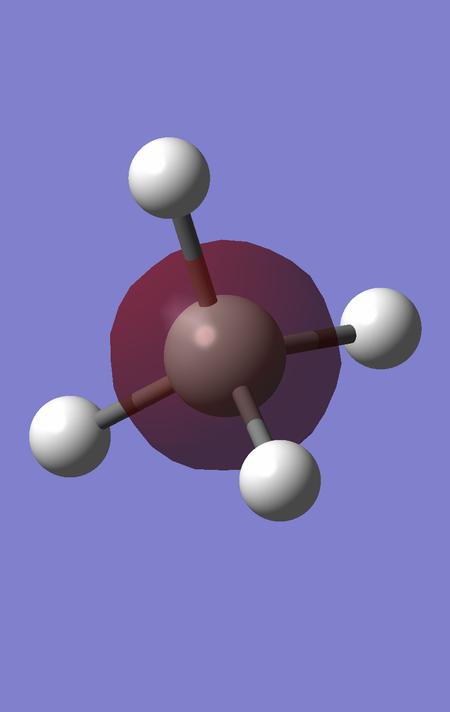
MO2 is of energy -5.28056 a.u., and corresponds to the 2s orbital of Si, which is also not involved in any significant bonding since it is also much lower in energy than the H 1s AOs. The electron density is more diffuse than the MO1, since the 2 electrons occupying this orbital are shielded from the nuclear charge of Si by the electrons in MO1, hence they experience a smaller effective nuclear charge.
MOs 3, 4 and 5 are degenerate MOs of energy -3.63858 a.u., corresponding to the 3 2p orbitals of Si, which are also too low in energy to be involved in bonding.
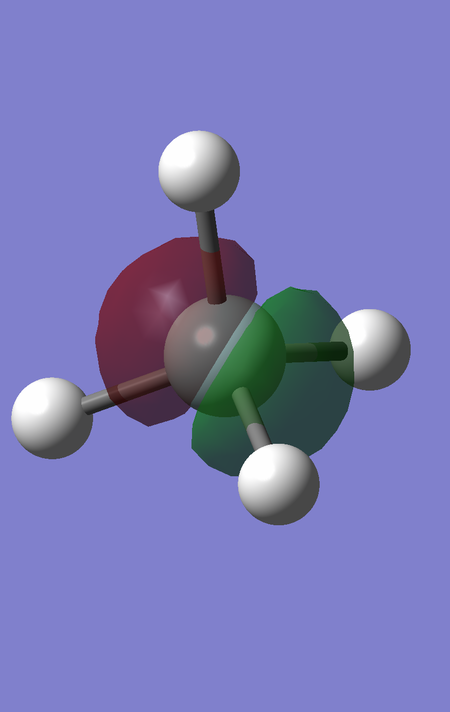
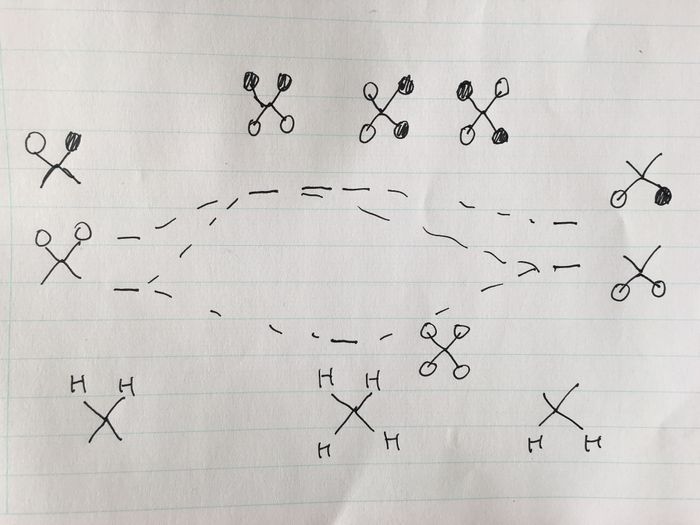
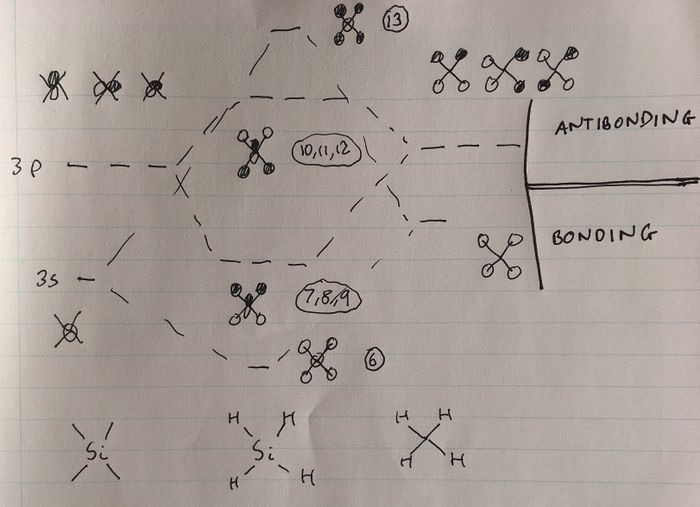
Atomic orbitals in the third, valence shell of Si are of similar energy to the hydrogen 1s orbitals, hence they can interact. MOs higher in energy can be rationalised by considering linear combinations of the valence orbitals of Si with the ligand group orbitals of a 'H4' fragment. A MO diagram can be constructed to determine these orbitals for the H4 fragment, as shown below (the lab demonstrator Becky assisted me in constructing this diagram).
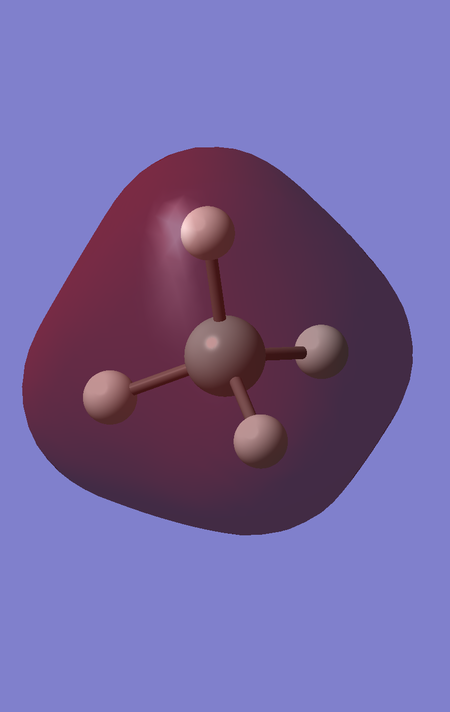
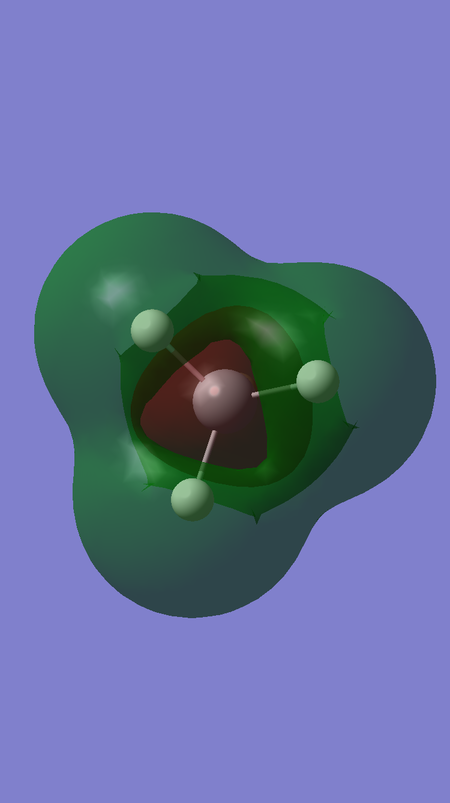
MO6 corresponds to the favourable, bonding interaction between the fully bonding fragment orbital for H4 and the 3s orbital of Si, and is of energy -0.54726 a.u.
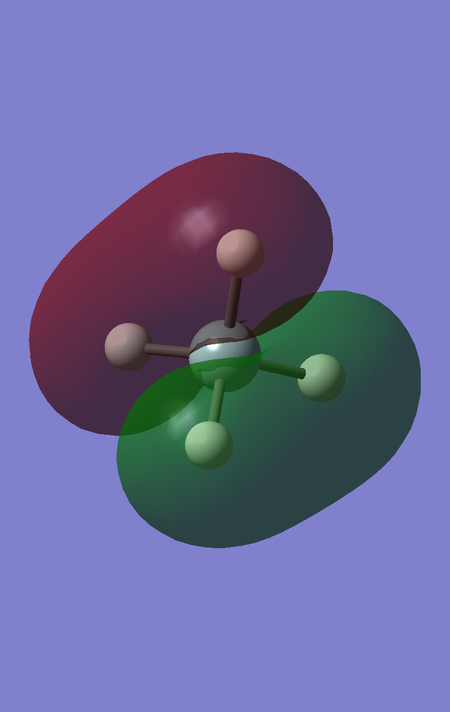
MOs 7,8 and 9 are degenerate, and correspond to the bonding interaction between the triply degenerate fragment orbitals of H4 with the 3 3p orbitals of Si. They are of energy -0.35184 a.u.
MOs 10, 11 and 12 are also degenerate; they correspond to the antibonding interaction between the triply degenerate fragment orbitals of H4 and the 3 3p orbitals of Si, and are hence higher in energy. These orbitals are the LUMOs of the SiH4 molecule, and the fact that there are 3 degenerate LUMOs spanning over the whole molecule reflects the fact that this tetrahedral molecule can be attacked by a nucleophile from almost any direction. The energy of these orbitals is 0.05053 a.u. The fact that this energy is greater than 0 reflects that these orbitals are antibonding, and that filling these orbitals would destabilise the SiH4 molecule.
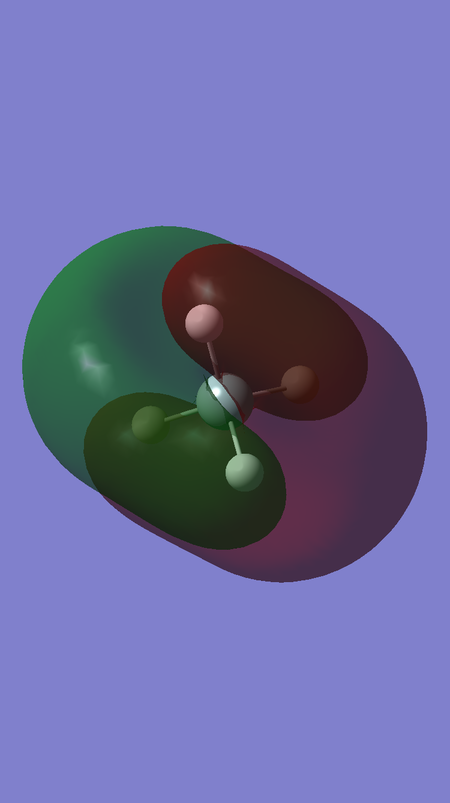
MO 13 corresponds to the antibonding interaction between the fully bonding fragment orbital for H4 and the 3s orbital of Si, and is of energy 0.12286 a.u.
The energies of MOs 6-13 can be rationalised by constructing a MO diagram modelling the interaction between the H4 fragment orbitals and the 3s and 3p orbitals of Si, as shown below (once again, the lab demonstrator Becky assisted me in constructing this diagram). Better overlap occurs between the fully bonding fragment of H4 and the 3s orbital of Si than between the triply degenerate fragment orbitals of H4 and the Si 3p orbitals. This will lead to stronger bonding and antibonding interactions, and therefore a greater difference in energy between the bonding and antibonding interaction, as can be seen in the MO diagram below.
The fact that MOs 6 and 13 are more bonding and antibonding than MOs 7-9 and 10-12, respectively, can also be rationalised by looking at the distribution of electron density in the visualisations of these MOs. It can be seen that that there is greater electron density between the Si and H nuclei for MOs 6 and 13, compared to MOs 7-12.
