Rep:Mod:RMT MGO
The main aim of this experiment is to investigate of MgO and other similar solids expand when heated and calculate their thermal expansion coefficients. This requires the understanding of phonon dispersion in MgO and the calculation of the vibrational density of states. The vibrational energy levels which make up the dispersion curves and density of states can be used to calculate the free energy of the crystal, which can in turn be used to predict how the crystal will expand when heated. A molecular dynamics calculation, which simulates the vibrations in the lattice as random motion of the atoms around their equilibrium position, will also be compared to the quasi-harmonic approximation in terms of thermal expansion of the solid.
Introduction
Crystal Structure
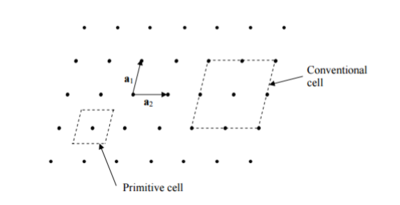
To understand the thermal expansion of a crystal, we must first understand its structure. The structure of a solid crystal is a combination of a motif and a lattice; a lattice is an infinite array of points (lattice points), all of which are in the same environment, and its motif is the unit in the crystal which is associated with each of these lattice points. The repetition in the crystal is created by placing one motif on each of the lattice points. The unit cell describes the structure of the repeating unit in the crystal and is made up of one or more atoms. Its structure is described by a set of lattice parameters: for a 3D lattice, a, b and c are the lattice vectors which define the length of the three dimensions of the unit cell (length, width and height), and α, β and γ which define the angles between the three vectors. The number of lattice parameters decreases with the number of dimensions of the lattice.
A unit cell can be represented as a primitive cell or a conventional cell, which are demonstrated on a 2D hexagonal lattice in Figure 1. Translation of a primitive cell results in no sharing of atoms with neighbouring cells and it contains the minimum number of atoms needed to describe the repetition of the lattice. Another name for the primitive cell in real space is the Wigner-Seitz cell and the lattice vectors in this cell are called the primitive vectors. A non-primitive or conventional unit cell is a primitive cell with a basis. A basis is the group of atoms which infinitely repeat in the lattice. A super cell is several conventional cells put together. The conventional unit cell is used to define the volume of the crystal from the conventional lattice vectors.
There are 7 possible symmetries the crystal could take and they are defined by the lattice parameters. As the symmetry increases, the lattice parameters become more defined and there are less variations that the symmetry of the system could take.
There are two types of packing which can describe the crystal structure: cubic packing and hexagonal packing, and each type of packing has different variations, such as body centered cubic and hexagonal close packed. When there is more than one type of atom in the lattice, the lattice can usually be described by a structure charaterised by a particular compound. eg. NaCl or fluorite (CaF2).
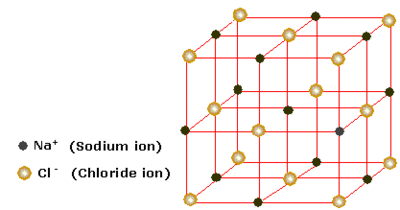
The most important lattice structure considered in this experiment is the NaCl (or rocksalt) structure. This is an AB type structure, shown in Figure 2., which takes the form of an interpenetrating face centered cubic lattice, meaning that atom type A's lattice fills in the 'holes' in atom type B's lattice. Each individual lattice is face centered cubic. Each atom of type A is coordinated to 6 of atom type B and vice versa. The lattice parameters for this structure are a=b=c and α=β=γ=90°.
Vibrational Structure of Solids

From the structure of the crystal, we can then explain the vibrational structure of the crystal and describe its energy level structure. In a rigid crystal lattice, the electronic and atomic number density is assumed to be invariant with translation across the lattice. This is ideal behaviour for a Fourier transform, which changes the lattice structure in real space to a reciprocal space or 'k' space structure, which makes calculations of physical properties across the lattice much easier. In this experiment, we are considering the vibrational energy levels, but we can use the theory behind the derivation of the electronic energy levels to explain vibrational structure. The crystal in this experiment is considered as an infinite lattice and all vibrations within the crystal are assumed to be coupled. These coupled vibrations are called phonons; discrete packets of vibrational energy.
Considering a 1D lattice of repeating identical atoms, we can define the lattice parameter (the distance between two atoms) as a. In ‘k’ space, under the Fourier transform, this parameter becomes 2π/a. In reciprocal space, the unit cell or Wigner-Seitz cell is called the Brillouin zone. The Fourier transform also changes the structure of the crystal packing; face centered cubic in real space because body centered cubic in reciprocal space and vice versa. Each point in the Brillouin zone is called a 'k' point; the new axis system which defines the crystal is (kx, ky, kz) where the separation between each of the points is 2π/a.
Using the linear combination of atomic orbitals (LCAO) in real space, the vibrational molecular valence orbitals and their symmetry can be understood by modelling their vibrational ‘phase’ in terms of waves, where every change in phase of orbital is a node on the wave. 'k' is defined as the ‘wave vector’ of the molecular orbitals across the lattice. Each atom in the lattice vibrates around its equilibrium position and is either in phase with its neighbouring atoms out phase (all vibrations are coupled); this is applied to all three dimensions of the crystal, which creates bonding combinations, where the atoms are vibrating completely in phase, and antibonding combinations, where the atoms are vibrating completely out of phase. For the highest bonding combination; when the atoms are all vibrating completely in phase, there is no 'node' as there is no change in phase across the lattice and so for an infinite lattice, the wavelength would also be infinite. As k = 2π/λ, the 'k' value for this configuration would be 0. For the highest antibonding combinations; when the atoms are all vibrating completely out of phase, there is a node every 'a' and so the wavelength is 2a (there are two nodes in a complete wave). The 'k' value for this configuration is therefore π/a.
A vibrational dispersion curve is plotted as the frequency of the vibrations in the lattice, ω(k), against the 'k' values. An infinite number of vibrations in one of the molecular orbital configurations from an infinite lattice gives one branch on the dispersion curve. The dispersion curve is plotted because the energy levels of the crystal have a band structure. These bands arise because the large number of orbitals contributing energy levels (LCAO) gives rise to a large number of energy levels over a small energy range. Therefore, the spacing between the energy levels becomes negligible compared to the energy gap containing the many energy levels and so the the energy levels can be estimated as a continuum. The density of states is the number of energy levels in a given energy gap. The free energy can be calculated by summing the energy of all the vibrational states of the crystal.
The Quasi-Harmonic Approximation
In a regular lattice, such as MgO, computations of thermodynamic properties apply the approximation of the harmonic phonon model, which assumes all vibrations of atoms in the lattice to be harmonic. This predicts that the atoms in a rigid lattice must be exerting forces on one another in order to keep its shape and keep all the atoms around the equilibrium position. These forces can be characterised by a potential energy and the total potential energy of the lattice is the sum of all the potential energies between pairs of atoms. The potential used to model this system is a Morse-like classical potential and has a short range repulsion term, with harmonic character around the equilibrium point.
The quasi-harmonic approximation is an expansion of this and is based on the assumption that all phonons are volume dependent, and therefore the distance between the lattice points is dependent on temperature allowing for thermal expansion in a solid.
The Helmholtz Free energy of the crystal is under the quasi-harmonic approximation and the zero point energy is defined by the lowest energy vibrational mode.
The thermal expansion of a solid comes from calculation of the lattice parameters as temperature and free energy of the solid increase. Thermal expansion of a solid is when the volume of the solid increases with temperature. The thermal expansion coefficient is described by the equation: and can be derived from the Helmholtz energy term at constant pressure.
Computational Methods
The program used to compute the lattices under the classical approximation for this experiment is called the General Utility Lattice Program or GULP. The program generally models condensed phase problems and solves problems based on force field methods[3]. Both the classical simulation and the quantum-mechanical simulation use a simple interatomic potential, for example the Morse potential. These potentials are harmonic around the equilibrium position and assume that the interatomic distance or lattice parameters remain constant with increasing temperature. Therefore, this approximation is not suitable for modelling the thermal expansion of the solid; this is done by molecular dynamics.
Calculating the Internal Energy of an MgO Crystal
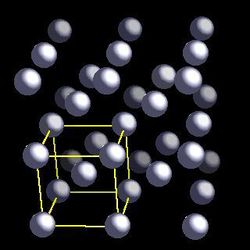
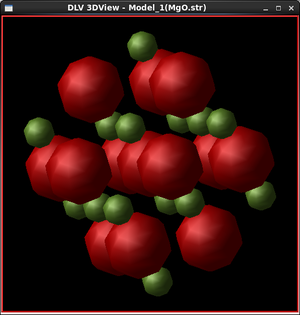
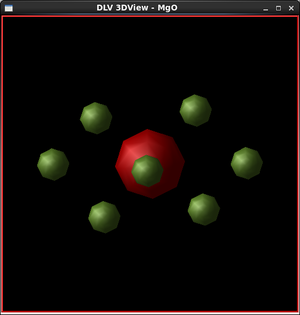
The solid structure primarily considered in this experiment is magnesium oxide: MgO, the primitive unit cell of which comprises of one Mg2+ and one O2- ion. The packing structure of the crystal is face centered cubic (fcc) close packed, therefore the conventional unit cell is cubic. The shape of the primitive unit cell is a rhombohedron, where all internal angles (α, β and γ) are 60°. Most computational studies refer to the conventional cell of MgO, but the output files for this experiment give the geometry as the primitive cell.
| Figure 4. Cubic conventional cell of MgO | Figure 5. Rhombohedral primitive cell of MgO |
|---|---|
|
|
| Lattice parameters:
a=b=c = 4.212 Å α=β=γ=90° |
Lattice parameters:
a=b=c = 2.10597 Å α=β=γ=60° |
A single point calculation on the MgO structure was run to calculate the internal energy of the crystal. This does not an optimise the structure, just calculates the single point energy at the point where the original structure sits on the potential energy surface. An ionic potential mode was used, and the ionic shells were not considered in the calculation. No phonons were calculated. This experiment uses the ionic shield potential and neglects the consideration of shells in the calculations. This potential assumes that the ions have hard shells (also known as the 'hard shell' model) and that there is a very short range repulsion when the ions come into contact.
The binding energy of the crystal is the energy required to pull the atoms apart to infinite separation per unit cell. It was reported in the log file to be: - 41.07531759 eV or -3963.1403 kJ/(moles of unit cell).
Calculating the Phonon Modes of MgO
Phonon Dispersion Curve
Phonon modes are the different vibrational states which the MgO crystal can take. In reciprocal space, they can be plotted as ω(k) (vibrational/phonon) dispersion curves, which show the band structure of the solid. They can also be plotted as the density of states, which is the number of vibrational states in a certain energy gap.
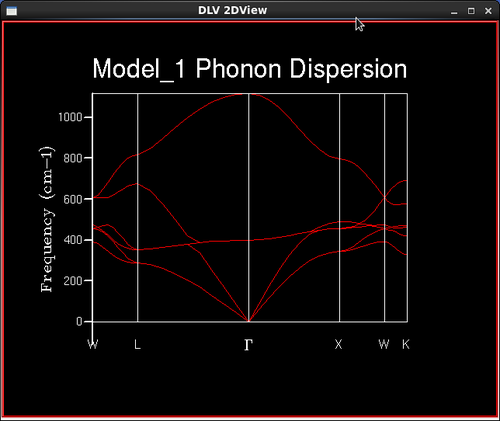
A GULP calculation was run to plot the phonon dispersion curve for MgO by calculating the phonon eigenvectors and sampling 50 'k' points. Figure 6. shows the calculated phonon or vibrational dispersion curve in reciprocal space. It is plotted as frequency of vibration, ω(k) as a function of 'k'. Γ is the origin in reciprocal space (0,0,0).
The x axis on the graph in Figure 6. is defined by symmetry points in the lattice; each letter describes a different symmetry point. Each of the points defined represent a different vibrational state of the lattice, and there are the same number of 'k' points as there are vibrational states. In the input lines, each of the symmetry points are defined by a particular 'k' point:
As the crystal is has two atoms in its primitive cell, only two types of phonon are exhibited in the dispersion curve; acoustic and optic phonons. The lowest branches which tend to zero at the origin, Γ, are the acoustic branches, which contain more bonding character as they move coherently away from their equilibrium position, and the higher branches are called the optic branches and have a greater antibonding character as they move out of phase with each other away from the equilibrium position. The curve is made up of 6 lines; each of the crystal's 3 dimensions contributes two phonon modes, and the lines which split represent degenerate states. Because of the high symmetry in the crystal at the origin, the acoustic branches will tend to zero.
Density of States Curves
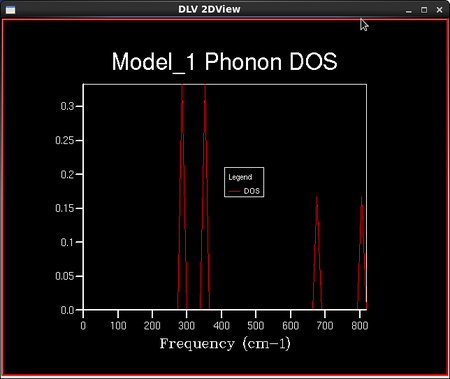
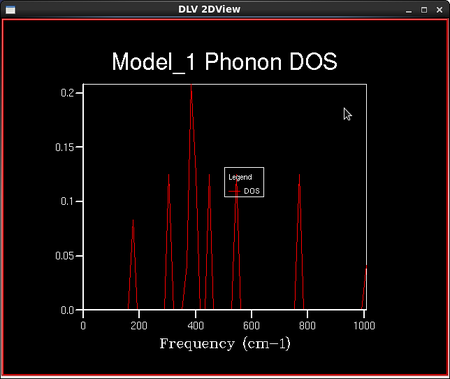
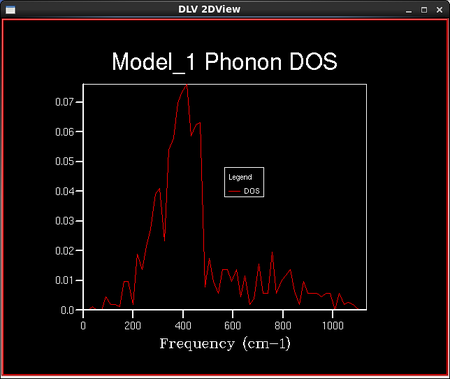
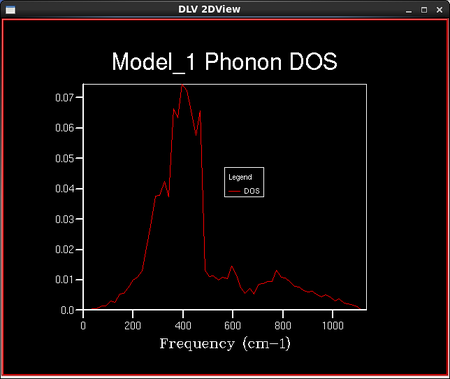
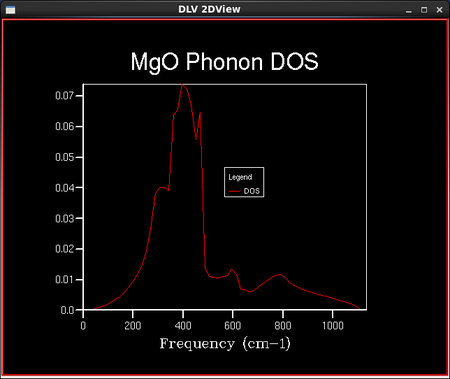
To calculate the density of vibrational states, a sample of the lattice is taken and the number of 'k' points in this lattice is defined by the shrinking factor. Dividing the lattice vector in reciprocal space by the shrinking factor increases the number of 'k' points in the sampled lattice. For example, a shrinking factor of 1x1x1 samples a grid of 1 'k' point and a shrinking factor of 2x2x2 samples a grid of 4 'k' points etc. The number of 'k' points sampled is reduced with increased symmetry of the lattice. This is because the program assumes a regular infinite lattice with no defects and so can assume that points with the same symmetry have the same properties. The shape of the 3D lattice sampled is cubic; the MgO lattice is face centred cubic. A set of density of vibrational states calculations were then run keeping the lattice shrinking factors at 1x1x1, but the temperature and the pressure remained undefined. This particular lattice shrinking factor means that there are only 2 'k' points in the lattice sampled: one at each of the 8 corners of a cube. A smoother density of states curve is obtained by increasing the density of the k point grid. This is done in the programme by increasing the shrinking factors from 1x1x1 to 2x2x2 or larger. The density of states curves and the phonon distribution curve are related through the frequency axis which they both have; the y axis for the DOS curves and the x axis for the phonon distribution curves.
The grid sizes were chosen as they have appropriate scaling factors for comparison. The jumps between the sizes are necessary to reach the required accuracy.
As the grid size increases, the number of 'k' points sampled increases and the density of states curves becomes more continuous with less singularities, but the rough shape of the distribution remains the same. As the grid size reaches 16x16x16, the difference between the graphs as the lattice size increases becomes negligible, and so it is a reasonable approximation to use the 16x16x16 grid size for the approximation of the density of states and further calculations in the experiment. This is confirmed in the next section when the Helmholtz free energies are calculated and the 16x16x16 grid size gives energies converged to 7 significant figures in both eV and kJ mol-1. The peak on the density of states curves are all around the 400 cm-1 point. From the phonon dispersion curve in Figure 6., we can see that the maximum density of branches occurs at this point and so this agrees with the density of states curves that this point is the maximum 'density of states'.
Computing the Free Energy - The Harmonic Approximation
The following calculations are under the harmonic phonon approximation; this assumes the distance between atoms to be invariant and so would not increase with temperature. The minimisation of Gibbs free energy allows for the calculation of equilibrium volume. A set of GULP calculations were run at different lattice shrinking factors and the Helmholtz free energy was recorded. All calculations were run at 300 K and the phonon density of states curves were recalculated.
| Grid | No. of 'k' Points Sampled | Helmholtz Free Energy/ eV | Helmholtz Free Energy/ kJ mol-1 |
|---|---|---|---|
| 1x1x1 | 1 | -40.930301 | -3949.148006 |
| 2x2x2 | 4 | -40.926609 | -3948.791810 |
| 4x4x4 | 32 | -40.926450 | -3948.776419 |
| 8x8x8 | 256 | -40.926478 | -3948.779123 |
| 16x16x16 | 2,048 | -40.926482 | -3948.779580 |
| 32x32x32 | 16,384 | -40.926483 | -3948.779641 |
| 64x64x64 | 131,072 | -40.926483 | -3948.779648 |
As grid size increases and the number of 'k' points sampled increases, the free energy tends to a certain value, around -40.9264 eV to 6 significant figures.
To investigate an appropriate grid size, a graph was plotted of number of 'k' points vs Helmholtz free energy using just the first three points. Error bars added the size of the accuracy being investigated: 1 meV, 0.5 meV and 0.1 meV. The values in the table above have tended to the value of -40.926483, and so a horizontal line was plotted on the same graph at this value. The appropriate grid size was determined from the inclusion of the horizontal line in the error bars for each of the data points. If the line was included for the first time, this means this particular data point is the smallest grid size appropriate to use for the levels of accuracy.
| Accuracy | Appropriate grid size |
|---|---|
| 1 meV | 2x2x2 |
| 0.5 meV | 2x2x2 |
| 0.1 meV | 4x4x4 |
A shrinking factor of 8x8x8 was chosen as this is accurate enough for both the energy and density of states calculations. Allowing for the fact there may be some error in the calculations, a higher than necessary shrinking factor was chosen; 16x16x16.
Testing the Grid Size of Different Crystals
The model used in this experiment differs from other crystal structures, and therefore the grid size may not be accurate for similar calculations due to the crystal structure being different. Below are some examples.
The Thermal Expansion of MgO
The following calculations follow the quasi-harmonic approximation, which assumes the phonon vibrations are volume dependent, and therefore allows for thermal expansion, something which the harmonic phonon approximation doesn't do. The effect of temperature on lattice size was then investigated. Thermal expansion comes from the increase of a solid's volume with temperature do to increasing kinetic and therefore vibrational energy of the molecules.
This was done by running by running GULP optimisation calculations of the Gibbs free energy and recalculating the phonon density of states. A shrinking factor of 16x16x16 was chosen as the previous two sections confirmed how this is an accurate size to calculate both energy and density of states. The calculations were run at different temperatures starting at 0 K and increasing in steps of 100 K up to 1000 K. The reported results for these calculations and the log files are shown in the table below. Vibrational states produce a zero point energy which is also reported for each temperature in the table below.
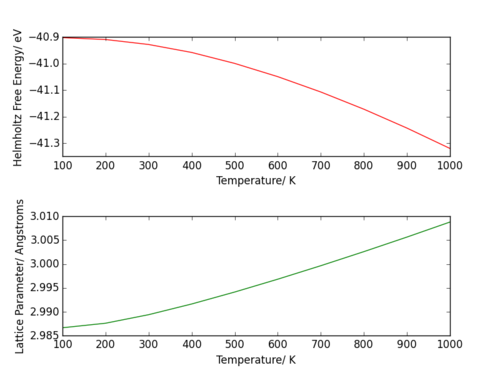
Both curves in Figure 17. are parabolic; the Helmholtz free energy has a -T2 dependence on temperature, whereas the lattice parameter has a T2 dependence. The plots exclude the values for the energy and lattice parameter at 0 K, as there is no translational energy at 0 K. The plot became skewed, no longer showing the parabolic character.
As said in the introduction, the thermal expansion coefficient is described by the equation: .
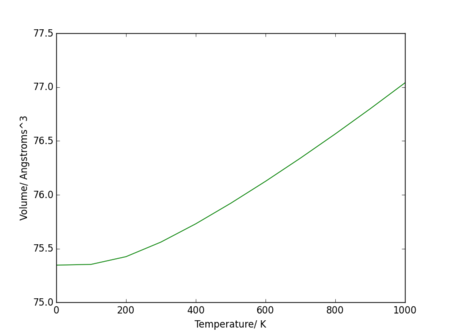
For calculating the coefficient of thermal expansion, calculation of the volume of the unit cell of the lattice is required. The lattice parameters recorded are for the rhombohedral unit cell, which is one quarter of the volume of the conventional unit cell; either can be used to calculate the thermal expansion coefficient. In Figure 18., the data from the conventional unit cell has been plotted. The volume of a rhobohedran is calculated using the primitive lattice vectors and the internal angles, and is reported in the output file. The data for the volumes are shown in the table below. As the coefficient is the derivative of the volume at constant pressure, it is found from fitting the volume curve to a line of best fit and calculating the derivative of this fit to give the relationship between the coefficient and temperature.
The thermal expansion coefficient is the derivative of the curve in Figure 18, a relationship seen in the equation for the thermal expansion coefficient, shown earlier in the section. The volume of the conventional unit cell at 0 K is 75.345971 Å3.
Between 0 K and 400 K, the curve of volume vs temperature can be estimated as parabolic: volume has a T2 dependence (plotted in Figure 19.a)). A fit was estimated to be with an value of . Therefore, the thermal expansion coefficient is temperature dependent in this region.
As the temperature rises above 400 K, the dependence up to 1000 K can be estimated as linear (plotted in Figure 19.b)). A fit was estimated to be with an value of . As the gradient in this section does not change, the derivative term in the equation for the coefficient is equal to the gradient of the line: . Dividing this by the intercept (the volume at 0K based on this fit) gives the thermal expansion coefficient between 400 K and 1000 K; .
This linearity is in agreement with literature which gives a value of [4], which is in high agreement with the computational value obtained. This literature confirms that the change in volume with respect to temperature is linear between 300 K and 1250 K.
LITERATURE VALUE.
The melting point of MgO is 2825 °C[5] or 3098 K. As this temperature is so much larger than 300 K, it can be predicted at the melting point the phonon modes no longer represent the real motion of the atoms in the crystal using the quasi-harmonic approximation. Further calculations were run at 2700 K, 2800 K and 2900 K, close to the melting point, to investigate the relationship between change in volume with temperature at high temperatures.
| Temperature/ K | Volume of conventional cell/ Å3 | Volume of primitive cell (volume per formula unit)/ Å3 | Figure 20. Volume vs Temperature for all values |
|---|---|---|---|
| 2800 | 83.4084 | 20.8518 | 
|
| 2900 | 84.2046 | 21.0501 |
The curve from Figure 20., which includes the data from 100 K to 1000 K, was given a fourth order polynomial fit: , with an value of . The expression for the thermal expansion coefficient over this large range of temperatures would be the derivative of this equation: .
This can only be confirmed by plotting the data between 1000 K and 2500 K. The deviation from linearity near the melting point is due to anharmonicity in the phonon modes, so therefore the quasi-harmonic approximation breaks down.
Molecular Dynamics
Molecular dynamics is derived from the motion of atoms under force due to Newton's second law. This means that these calculations are approximated classically and that there is a linear dependence on the change in volume with respect to temperature. Molecular dynamics considers the movement and properties of individual atoms or molecules.
For these calculations, a cell size of containing 32 'k' points (a 4x4x4 grid size) is used; this is a compromise between how time efficient the calculation is and the accuracy of the calculation. The calculations produced instantaneous and averaged values for all properties; the averaged values are calculated by the ensemble average from statistical thermodynamics. An ensemble is a sample of states of a system and when a large enough sample is used, this average is an accurate approximation of the time average properties of a single state of the system. An ensemble also has three constrains; in these calculations, the number of molecules (N), the pressure of the system (P) and the temperature (T) is kept constant throughout the time the molecular dynamics is calculated over.These three constrains mean that volume is allowed to change over the time period. Molecular dynamics calculations were run between 100 K and 1000 K at 100 K intervals; the data cannot be calculated at 0 K as there needs to be kinetic energy (translational degrees of freedom) for the molecules to accelerate from their starting position. The data obtained is shown in the table below.
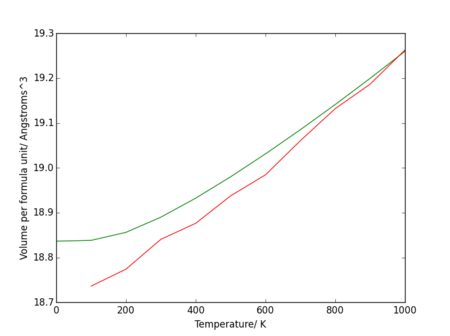
The molecular dynamics expansion predicts a linear dependence of volume on temperature, whereas the quasi-harmonic approximation has a quadratic dependence at low temperatures (and therefore a linear thermal expansion coefficient). They both become approximately linear between 400 K and 1000 K. The molecular dynamics approximation is defined by classical mechanics and so assumes a linear dependence on temperature. It also fails as the temperature approaches zero because it assumes all the particles in the lattice are classical and neglects quantum effects on the lattice, something which the quasi-harmonic approximation includes. The computer program failed to calculate this point and so it is not plotted.
From the investigation using the free energy calculations, a 4x4x4 cell is large enough to give results accurate to 0.1 meV.
Further molecular dynamics calculations were run at higher temperatures closer to the melting point of MgO, a graph of which is plotted below.
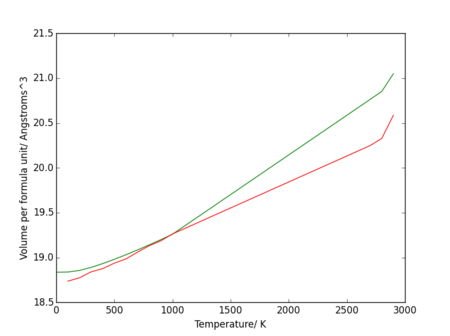
Figure 21. shows a divergence as the temperature rises to the melting point, suggesting a sharper change in volume as the solid becomes a liquid (a possible soft mode[6]). The change in volume with temperature data from the quasi-harmonic approximation deviates from linearity at a lower temperature than the data from the molecular dynamics calculations.
Conclusion
This experiment was an investigation into the phonon properties and thermal expansion of the solid crystal MgO. Calculations under the harmonic phonon model were run to calculate the phonon dispersion curve, the density of states curve and the Helmholtz free energy at different grid sizes. These results were used to estime the appropriate grid size to use for the thermal expansion calculations by assessing the size of the error in the results. A 16x16x16 grid size was determined to be suitable. Calculations were then run using the molecular dynamics simulation and the quasi-harmonic simulations. It was found that the quasi-harmonic model is more accurate at lower temperatures as there is no anharmonicitiy at this limit, whereas the molecular dynamics model is more accurate at higher temperatures as it retains its linearity for longer as it approaches the melting point.
Both methods, however, break down at the melting point, as neither consider what happens at the phase transition to the volume. We would expect to see a sharp change in volume in this range, but instead, the molecular dynamics calculations continue their linearity close to the melting point as the calculations are derived from randomised motion, and the quasi-harmonic calculations show no sharp change as the data is approximately parabolic. This discontinuity at the phase transition can be explained by the constant pressure heat capacity tending to infinity at this point.
References
- ↑ http://www.pa.uky.edu/~kwng/phy525/lec/lecture_1.pdf
- ↑ http://image.wistatutor.com/content/chemical-bonding/crystal-lattice-of-nacl.gif
- ↑ https://nanochemistry.curtin.edu.au/gulp/
- ↑ A. S. Madhusudhan Rao and K. Narender, “Studies on Thermophysical Properties of CaO and MgO by Gamme-Ray Attenuation,” Journal of Thermodynamics, vol. 2014, Article ID 123478, 8 pages, 2014. doi:10.1155/2014/123478
- ↑ Haynes, W.M. (ed.) CRC Handbook of Chemistry and Physics. 91st ed. Boca Raton, FL: CRC Press Inc., 2010-2011, p. 4-74
- ↑ Hook JR, Hall HE, Solid State Physics, 2nd Ed, Wiley-Blackwell;1995

