Rep:Mod:RLJ15TS
Transition States and Reactivity Computational Lab 2017

Introduction:
In this experiment, Gaussian was used to locate the stationary points on the potential energy surfaces of three pericyclic reactions. These stationary points were then characterised as minima or transition states through frequency calculations in order to obtain an understanding of each experiments reaction profile. In certain cases, these calculations also allowed the determination of the most thermodynamically stable stereoisomer (i.e. exo vs endo in a Diels Alder cycloaddition).
What is meant by a minimum and transition state in the context of a potential energy surface and what is the gradient at each of these points?
A Potential Energy Surface (PES) is a multi-dimensional surface plot which depicts the variation of potential energy across two or more reaction coordinates. The number of dimensions of this plot correlates to the number of degrees of freedom the molecule possesses (e.g. in the case of non-linear molecules: 3N-6).
In theory, a transition state corresponds to the highest energy point along a reaction coordinate between reagents and products. On a PES, this corresponds to a stationary (saddle) point with a gradient of zero. The second derivative of this point is negative and corresponds to the force constant. This value is useful when it comes to confirming the structure has reached the transition state; this will be discussed in more detail later. A minimum on a PES resembles a well of low potential energy where the gradient of the surface is also zero. Here, the second derivate (which still resembles the force constant) will be positive, unlike the transition state. There may be more than one minima on a PES; the one which resides with the lowest energy is known as the ‘global’ minima and all the rest are ‘local’ minima.
Nf710 (talk) 09:35, 17 November 2017 (UTC) This is correct for 1 dimension but in higher caeses. Minimum -All dimensions second derivatives are postive. TS - All dimensions second derivatives are postive, except the reaction coord, hence why this it is called a saddle point.
How would a frequency calculation confirm a structure is at either of these points?

In Gaussian, frequency calculations use the equation on the right to calculate the force constants (‘k’) between the bonds. The force constant is a measure of the second derivative of the potential energy surface at that specific point and is related to the vibrational frequency of the molecule. Consequently, the results of a frequency calculation depict the vibrations that the molecule undergoes in its optimised geometry. These vibrations are the consequence of all the normal modes of the molecule being mixed up together.
Nf710 (talk) A vibration is a normal mode moving along and back on its dimensional axis. A normal mode is a linear combination of all the bends/stretches (degrees of freedom int he molecule) changing one does not change the energy of another and hence they are normal to each other.
The transition state is defined as having one imaginary vibration; this is the result of the second derivative at such a point being negative with respect to the reaction coordinate. Thus, running a frequency calculation is a good way of confirming if your structure is at a transition state. If the outcome shows more than one negative frequency, this indicates the molecule is located on a higher order saddle point on the PES. This is often the result of a molecule have very high levels of symmetry.
The second derivative at a minimum point is positive and thus a way in which you can confirm you have a molecule optimised to a minimum is to check if all the vibrations the molecule experiences are positive (i.e. no imaginary frequencies).
Types of reactions being analysed in this lab:
In this lab, there are two different classes of pericyclic reactions under investigation. These are:
[4+2] Diels-Alder Cycloadditions
All the exercises encountered involve at least one form of Diels Alder Cycloaddition. These examples provide evidence to depict how this reaction can proceed with both normal and inverse electron demand. This is discussed in more detail later.
Cheletropic Reactions
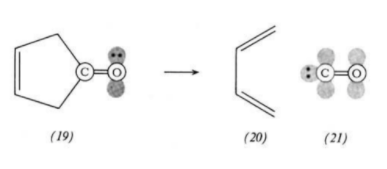
A cheletropic reaction is a class of concerted pericyclic reaction in which the two sigma bonds that are formed/broken terminate at the same atom [3].
Within this lab, the kinetics and thermodynamics of these different reactions is assessed and compared.
Computational Methods used in this lab:
Locating Transition States:
Three different methods were used within this lab to locate the transition state experienced by a molecule; these were.
- Using chemical intuition to guess the approximate geometry and optimise from there.
- Similar to method one, however the interacting atoms were frozen prior to optimisation.
- The product was initially optimised. This was then broken apart into the constitutional reactants and optimised.
Geometry Optimisation Calculations:
In this lab, there are several methods which were used in order to calculate the optimised geometry of the transition states to varying degrees of freedom. These geometry optimisation calculations were carried out by the computer in a step-wise fashion; first, a single point energy calculation was carried out in order to solve the Hamiltonian matrix for the molecule in that specific orientation. Then, the geometry of the molecule was varied and the single point energy calculation was run again. This cycle repeated until the geometry of the molecule with the lowest energy structure was found.
PM6 was the first method used; it is a semi-empirical method in which some of the Hamiltonian matrix is pre-set. As a result of making these approximation, the accuracy of such calculations is limited. The more accurate optimisation method used was B3LYP with a 6-31G(d) basis set. This is a DFT-hybrid technique through which the Hamiltonian matrix was solved as a function of electron density and with no integral approximations. In addition, this method also encompasses a Hartree-Fock calculation which accounts for the electron correlation exchange energy by computing the Hamiltonian as a function of individual electron positions. As a result, this hybrid process is more computationally expensive yet produces results which are more comparable to literature.
The energies computed from the PM6 and B3LYP methods were not compared as the approximations made varied between the techniques and thus the theory involved also differed.
Nf710 (talk) 09:44, 17 November 2017 (UTC) Nice understanding of B3LYP and PM6! This is correct. Good intro, you really tried hard to understand the theory, way more than most people. If you want to know more about this stuff. This book is a really nice intro http://pubs.rsc.org/en/Content/eBook/978-1-84973-608-4 its in the library but also you can downloads as pdf
Exercise 1: Reaction of Butadiene with Ethylene
(Fv611 (talk) Very well done! Everything was correct, and the discussion around the MOs and the MO diagram was thorough.)


In this exercise, the Diels Alder cycloaddition of butadiene with ethylene was investigated. This reaction involves a π4s and a π2s component and thus is thermally allowed by the Woodward-Hoffman rules [3].
The transition state of this reaction was located using method one and was optimised to a PM6 level. The molecule was confirmed to be at the transition state by having only one imaginary frequency (approximately -948 cm-1). Prior to guessing the transition state geometry, the reactants were optimised to a minimum (again using PM6); this was confirmed by the results of the frequency analysis showing no imaginary frequencies. This calculation was also repeated on the final product to ensure it was also at a minimum on the PES.
The location of the reactant/product minima and the transition state was further confirmed by running an Intrinsic Reaction Coordinate (IRC) calculation; the results of which can be seen on the right. This clearly shows the gradient at each of these three points is zero.
MO Analysis:
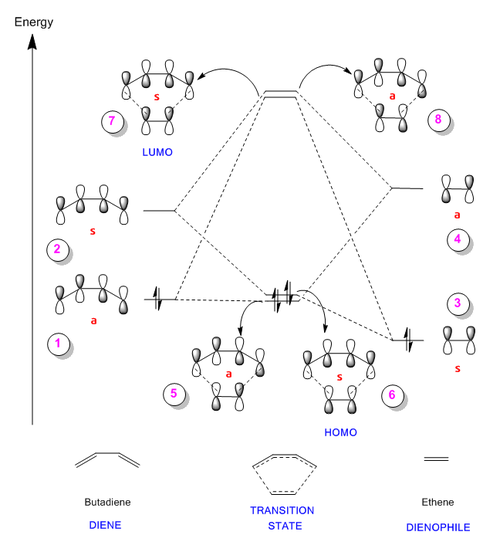
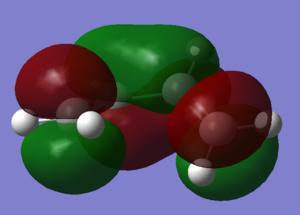
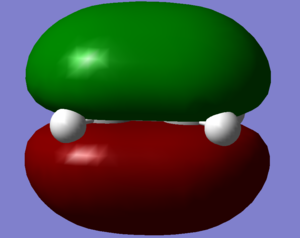
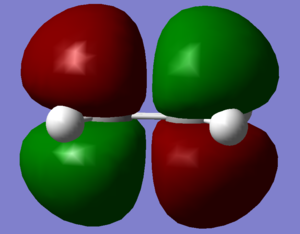
The figures below show the HOMO and LUMO of Butadiene and Ethene as well as the four MOs produced for the transition state . These molecular orbitals were analysed thus allowing the diagram above (Figure 6) to be generated (in the descriptions of the figures, the real MOs are correlated to the one they represent in Figure 6).
Initially, the energy levels of the fragment orbitals were determined by running a single point energy calculation on the result of the transition state IRC. These fragment orbitals involve the HOMO of Butadiene and LUMO of Ethene which can be described as having antisymmetric (ungerade) symmetry because the molecular orbitals are antisymmetric with respect to inversion. The opposite can be said for the LUMO of Butadiene and the HOMO of Ethene (they are symmetric / gerade).
From the diagram it is clear to see that it is in fact these pairs of orbitals which mix; therefore, it can be concluded that only MOs of the same symmetry can interact to form a new bonding / anti-bonding pair. This is because the overlap between molecular orbitals of the same symmetry (s-s; as-as) results in a non-zero overlap integral. On the other hand, the overlap integral for orbitals of different symmetry (s-as; as-s) is zero, thus they don’t mix.
Moreover, ‘Frontier Molecular Orbital theory’ suggests the chemistry of such Diels-Alder reactions is controlled by the interaction of the HOMOs and LUMOs of the reagents [3]. This confirmed that the MO diagram drawn above was correct. In the case of this specific reaction, the antisymmetric pair of fragment atomic orbitals have the largest splitting (confirmed by calculations – AS: 0.35821; S: 0.34266). Thus the major interaction is formed by the HOMO of the diene and the LUMO of the dienophile; hence this reaction can be classified as proceeding with ‘normal electron demand’. In addition, the varying contributions of the different fragment atomic orbitals to the transition state MOs can also be seen in the figures below. In Figures 11 and 12 below, it can be seen that there is a larger contribution from the butadiene fragment to the bonding transition state MOs as it is deeper in energy. In addition, the dienophile contributes more to the anti-bonding transition state MOs (see Figures 13 and 14).
One final note to point out about the MO diagram is that the energy levels of the transition state MOs are higher than that of the reactant FOs. This is because the transition state corresponds to the highest energy point along a reaction coordinate.
Bond Length Analysis:
The table below shows how the bond lengths between the atoms vary as the reaction proceeds. The numbering of the carbons can be found in the reaction scheme above.
(Fv611 (talk) It would have been better to reproduce the scheme with the numbered carbons down here too.)
| C-C bonds | Bond Length (Å) | ||
|---|---|---|---|
| Reactants | Transition State | Products | |
| C1-C2 | 1.333 | 1.380 | 1.501 |
| C2-C3 | 1.471 | 1.411 | 1.337 |
| C3-C4 | 1.333 | 1.380 | 1.501 |
| C4-C5 | - | 2.115 | 1.537 |
| C5-C6 | 1.327 | 1.382 | 1.535 |
| C6-C1 | - | 2.115 | 1.5437 |
| Lit [4]: Butadiene C-C: 1.454 ; Butadiene C=C: 1.338 ; Ethene C=C: 1.331 | |||
From the table above, it is clear to see that as the reaction progresses through the transition state, the three double bonds present in the reactants elongate. This represents the breaking of the π-bonds thus causing a change in hybridisation from sp2 to sp3. This results in these three bonds becoming single C-C bonds in the final product. This is confirmed by these three experimental bond lengths in cyclohexene being comparable to literature values for carbon single bonds [4].
On the other hand, the initial single bond of butadiene undergoes the reverse process and ends up as a double bond. This is depicted by the reduction in its bond length to 1.337 Å which is similar to literature values of C=C bonds [4].
The two new bonds forming have a length of 2.11 Å in the transition state. This value is less than twice the carbon atom’s Van der Waals’ radius (1.7 Å [5]) thus indicating the reacting pairs of atoms (C4 & C5, C6 & C1) are significantly interacting at this point along the reaction coordinate and that they will go on to eventually form two new σ bonds. This is confirmed by these bonds have lengths comparable to C-C bonds in cyclohexene.
Vibrational Analysis:
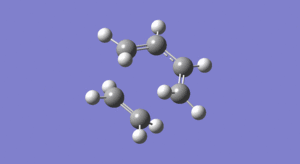
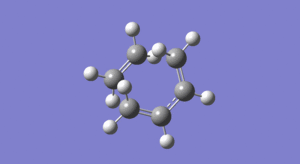
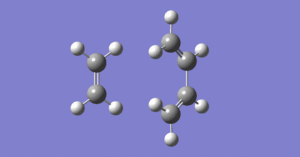
The animations below depict the 'imaginary' vibration at the transition state and also the first 'real' frequency. In addition, Figure 17 is the visualisation of the entire reaction taken from the IRC calculation (click on the icon and then the bigger picture to see the actual movement of the bonds!)...
 |
 |
 |
|---|
The imaginary frequency shown above in Figure 15 depicts the terminal butadiene carbons stretching towards/ away from the carbons of ethylene. Symmetry is maintained throughout this vibration and so the two pairs of reacting atoms should be moving closer at the same rate. Thus you can conclude that the bond forming process is ‘synchronous’; this can be confirmed using Figure 17. This agrees with the theory that all Diels-Alder cycloadditions are concerted [6].
The first real frequency portrayed in Figure 16 shows a twisting motion of the reactants. As a result of this, the reagents aren’t brought closer together, (like in the bond forming vibration in Figure 15) thus this movement cannot correspond to the reaction path at the transition state.
Useful links:
The links below direct you to the results of the optimisations up to the PM6 level...
Exercise 2: Reaction of Cyclohexadiene and 1,3-Dioxole
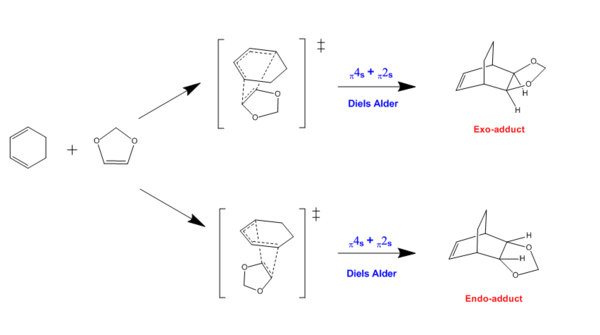
In this exercise, the Diels Alder cycloaddition of cyclohexadiene with 1,3-dioxole was investigated. Again, this reaction involves a π4s and a π2s component and thus is thermally allowed by the Woodward-Hoffman rules [3]. However, with this reaction there are two trajectories of approach in the transition state: ENDO and EXO. These varying orientations also result in different products which can be seen in the reaction scheme above.
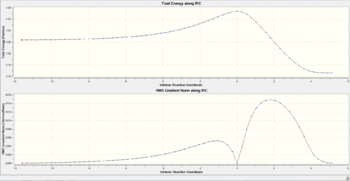
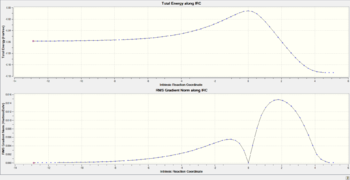
The transition states of this reaction were located using method three and were optimised to the more advanced B3LYP 6-31G(d) level. The molecules were confirmed to be at their respective transition state by having only one imaginary frequency (approximately -520 cm-1 for ENDO and -528 cm-1 for EXO). Prior to forming the transition state geometries, the final products were optimised to a minimum (again using B3LYP 6-31G(d)); this was confirmed by the results of the frequency analysis showing no imaginary frequencies. This calculation was also repeated on the reactants to ensure they were also at a minimum on the PES.
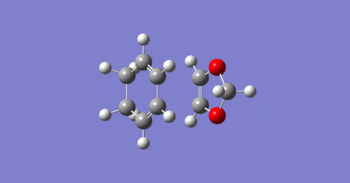
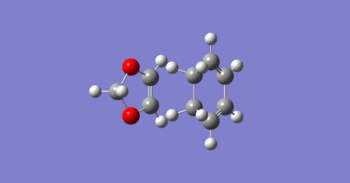
The location of the reactant/product minima and the transition state was further confirmed for each reaction by running an Intrinsic Reaction Coordinate (IRC) calculation; the results of which can be seen on below. These plots clearly show the gradient at each of these three points is zero. Alongside the plots are the visualisation animations for each of the reactions; click on the icon and then on the bigger picture to see the bond movements.
 |
 |
 |
 |
|---|
MO Analysis:
(You are neglecting the possible interaction of the antisymmetric orbitals Tam10 (talk) 16:08, 12 November 2017 (UTC))
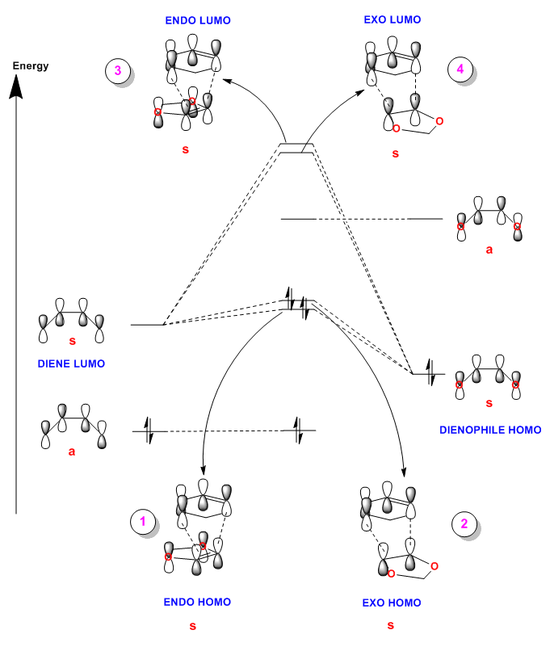
The figures below show the HOMO and LUMO transition state MOs produced for both of the different trajectories (in the description of the figures below, they are correlated with the MO they represent in the diagram above). These molecular orbitals were analysed thus allowing the diagram above (Figure 23) to be generated showing the (un)occupied orbitals involved in forming the transition state.
Unlike the reaction in exercise one, this reaction proceeds via ‘inverse electron demand’ and this is how it was confirmed.
Again, the energy levels of the fragment orbitals (which are the same as in exercise one) were determined by running a single point energy calculation on the result of the transition state IRCs. This showed that for this specific reaction, the HOMO and LUMO of the dienophile have raised energy levels (this was taken into account when constructing Figure 23). This is most likely due to the donation of electron density from the oxygen atoms into the double bond of the 1,3-dioxole.
The raising of these energy levels means that the symmetric-symmetric interaction of the diene HOMO and dienophile LUMO no longer takes place as the fragment orbitals are too far apart in energy. In addition, the LUMO of the diene and HOMO of the dienophile have now become closer in energy and thus combine with a greater splitting and overlap; this is what renders the reaction ‘inverse electron demand’. As a result of the endo transition state being more stabilised, the endo transition state MOs are separated by a greater splitting; this is also represented on the diagram above.
Again, the varying contributions of the different fragment atomic orbitals to the different transition state MOs can also be seen in the figures below. In Figures 24 and 26 below, it can be seen that there is a larger contribution from the 1,3-dioxole fragment to the bonding transition state MOs (for both ENDO and EXO) as it is deeper in energy. In addition, cyclohexadiene contributes more to the anti-bonding transition state MOs (see Figures 25 and 27).
And finally, again the energy levels of the transition state MOs are higher than that of the reactant AOs because the transition state corresponds to the highest energy point along a reaction coordinate.
|
|
|
|
|---|
Nf710 (talk) 09:55, 17 November 2017 (UTC)The point about the non bonding orbitals is not true, If you look the HOMO -1 in your Jmol you can clearly see that the AS are interacting.
Thermochemistry Analysis:
The table below shows the values of the reaction barrier and the reaction energies for both geometries in kJ mol-1; these values were calculated using a B3LYP optimisation with a 6-31G(d) basis set and were extracted from the results file under the heading 'Sum of electronic and thermal Free Energies'.


| TS Geometry | Reaction Barrier / kJ mol-1 | Reaction Energy / kJ mol-1 |
|---|---|---|
| ENDO | 157.78 | -66.76 |
| EXO | 166.01 | -63.19 |
| Conversion: 1 Hartree = 2600 kJ mol-1 | ||
From this table, it is clear to see that the endo reaction pathway has the lowest energy transition state as it has the smallest reaction barrier. This therefore means that the endo product will be formed more rapidly and thus is the kinetically favoured product [6]. And so if this reaction were irreversible, it would be stereo selective towards the endo adduct; this agrees with literature [6].
The activation energy for the endo trajectory is smaller as a result of stabilising secondary orbital overlap which can be seen in Figures 28/9 and also in the ENDO HOMO above (Figure 24). In the endo transition state, the lone pairs located in the oxygen p-orbitals are able to overlap and interact with the orbitals situated at the back of the diene. This is not possible in the exo orientation because the p-orbitals are positioned too far away from the back of the diene.
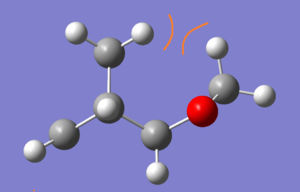
In terms of thermodynamic favourability, literature states that the exo-adduct should predominate due to less steric hindrance [6]. However, in the case of this experiment, the exo product lies higher in energy (has a lower reaction energy) than the endo thus contradicting the literature. This is the result of unusually increased steric hindrance between the 1,3-dioxole ring and the bridging carbons as depicted in Figure 30.
And so for this specific reaction, the endo adduct is both the kinetically and thermodynamically favoured product.
Prior to optimising the transition states to a B3LYP level, they were first optimised to a PM6 level. There was an outstanding difference in the resulting energies from the different computational methods of optimisation thus meaning these results were not comparable. As the B3LYP method is more advanced, it was used especially in this exercise in order to gain the best quantitative analysis of the thermodynamics involved.
Useful Links:
The links below direct you to the results of the optimisations up to the B3LYP 6-31G(d) level...
Endo Transition State Log file
Nf710 (talk) 09:58, 17 November 2017 (UTC) This section was done well apart from the mistake with the orbitals. your energies are correct and you have made the correct conclusions about them.
Exercise 3: Diels-Alder vs Cheletropic
(The bonding structure structure and planarity are wrong in various parts of this diagram Tam10 (talk) 16:19, 12 November 2017 (UTC))
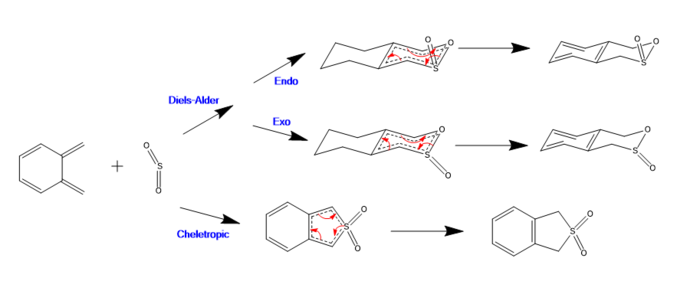
In this exercise, the reaction between Xylene and SO2 was investigated. It was found that these reactants could react in one of three ways as shown above in the reaction scheme.
As with exercise two, both the endo and exo Diels Alder cycloadditions involve π4s and π2s components and thus are thermally allowed by the Woodward-Hoffman rules [3].
The cheletropic reaction also passes through a cyclic transition state (thus is also classified as a pericyclic reaction) however the two new σ bonds formed terminate at the same single atom to form a five membered ring. This is how this reaction differs from the Diels-Alder cycloadditions.
The transition states for the three different reactions were located using method three and were optimised to a PM6 level. The molecules were confirmed to be at their respective transition state by having only one imaginary frequency (approximately -333 cm-1 for the ENDO Diels Alder, -351 cm-1 for the EXO Diels Alder and -486 cm-1 for the Cheletropic reaction). Prior to forming the transition state geometry, the reactants and products were optimised to a minimum (again using PM6); this was confirmed by the results of the frequency analysis showing no imaginary frequencies.
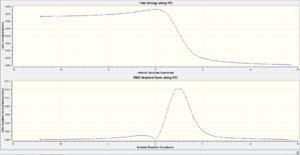
The location of the reactant/product minima and the transition states were further confirmed by running Intrinsic Reaction Coordinate (IRC) calculations; the resultant plots (which can be seen in the next section) clearly show the gradient at each of these three points is zero.
Reaction Coordinate Analysis:
 |
 |
 |
|---|---|---|
 |
 |
 |
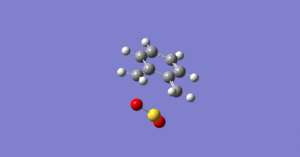
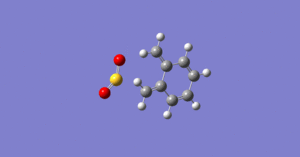
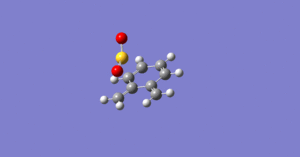
The animations above (click on the icon and then the bigger picture to see the bonds actually move) depict the results of the Intrinsic Reaction Coordinates for the three different reactions. From these videos, it is clear to see that in both Diels Alder reactions (exo and endo), the two new sigma bonds are not formed at the same time; thus these cycloadditions can be described as asynchronous.
Conversely, the cheletropic reaction in synchronous in nature as a result of the new bonds forming simultaneously.
Thermochemistry Analysis:
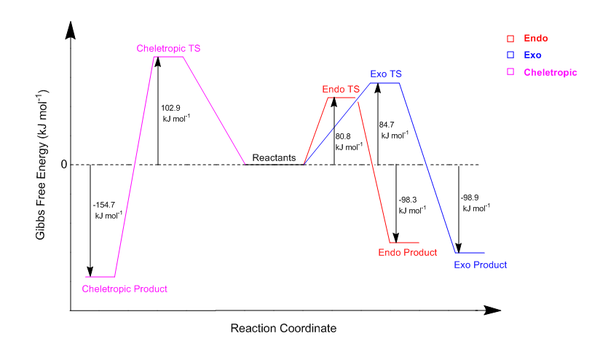
The table below shows the values of the reaction barrier and the reaction energies for both geometries in kJ mol-1; these values were calculated using a PM6 optimisation and were extracted from the results file under the heading 'Sum of electronic and thermal Free Energies'.
| TS Geometry | Reaction Barrier / kJ mol-1 | Reaction Energy / kJ mol-1 |
|---|---|---|
| ENDO | 80.77 | -98.25 |
| EXO | 84.71 | -98.90 |
| CHELETROPIC | 102.87 | -154.67 |
| Conversion: 1 Hartree = 2600 kJ mol-1 | ||
From this table, it is clear to see that the endo reaction pathway has the lowest energy transition state as it has the smallest reaction barrier. This therefore means that the endo product will be formed more rapidly than the others and thus is the kinetically favoured product [6]. The activation energy for the endo trajectory is smaller as a result of stabilising secondary orbital overlap of the π systems in the transition state.
The relative difference between the values of the endo and exo reaction barriers is small; this is the result of the secondary overlap having a lesser effect in the case of this reaction as a consequence of sulphur dioxide being a much smaller dienophile. For more quantitative proof of this effect, a B3LYP optimisation could be run on the transition state to compute energies which are then comparable to those in exercise two.
Even though the cheletropic reaction has the highest activation energy, it results in the lowest energy adduct and so can be deemed as the most thermodynamically favoured product. The reaction barrier is highest for this reaction due to the formation of the five membered ring being more unfavourable (increased strain caused by smaller bond angles) than the formation of the six membered ring in the Diels Alder cycloadditions. However, the resulting product is lowest in energy because of the enthalpic stabilisation of the extra S=O bond.
Overall, all the reactions result in products of very low energy, thus to some extent they can all be deemed favourable. This may be due to the driving force of the reactions being the same, i.e. stabilisation of the unstable Xylene reactant by making it aromatic.
The results of this thermochemistry analysis are clearly summarised in the reaction energy profiles drawn below (Figure 37). This diagram depicts the relative heights of the energy levels within each reaction and as only the relative heights were needed, a PM6 level optimisation was sufficient.
(Unfortunately it's likely that PM6 is not sufficient. It would require very fortuitous cancellations of errors to get the correct deltas. This is mostly an exercise of geometry optimisations and playing with numbers, but those numbers are probably inaccurate Tam10 (talk) 17:01, 12 November 2017 (UTC))
(Neat and clear reaction profile Tam10 (talk) 16:19, 12 November 2017 (UTC))
Xylene Instability Analysis:
Xylene is a very unstable reagent thus it readily undergoes rearrangements in order to become more stable. In terms of these reactions, this doesn’t occur because the stabilisation comes from the fact the xylene ring becomes aromatic in the product. This is the driving force of all three reactions and is confirmed by looking at the results of the IRCs. In Figures 31,32 and 33 above it can be seen that as the molecules pass through their respective transition states, the original Xylene double bonds lengthen and the original Xylene single bonds decreases in length. As a result all the bonds become the same length in the product and have bond order of 1.5 which is indicative of aromatisation.
The alternative Diels Alder reaction...

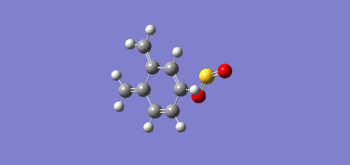
Xylene has within its structure a second cis-butadiene fragment which is also able to undergo Diels Alder cyloadditions with sulfur dioxide. These reactions (with the different trajectories: exo/endo) are depicted in the scheme above and can be visualised using the IRC animations below (click on the icon and then the bigger picture to see the bonds actually move). Both of these reaction trajectories are asynchronous in nature because the two new sigma bonds are are not made at the same time. The resultant IRC plots again prove the reactants/products and transition states were found correctly by showing the gradient to be zero at all three of these points.
 |
 |
 |
 |
|---|
The table below shows the values of the reaction barrier and the reaction energies for both reaction trajectories in kJ mol-1; these values were calculated using a PM6 optimisation and were extracted from the results file under the heading 'Sum of electronic and thermal Free Energies'.
| TS Geometry | Reaction Barrier / kJ mol-1 | Reaction Energy / kJ mol-1 |
|---|---|---|
| ENDO | 110.69 | +15.90 |
| EXO | 118.46 | +20.30 |
| Conversion: 1 Hartree = 2600 kJ mol-1 | ||
From the table above, it is clear to see that the [4+2] cycloadditions are much more unlikely to occur at this second site. This is because the reaction barriers are much larger than for the previous reactions, thus these cycloadditions will occur much slower if at all. In addition, the Gibbs Free Energy for these particular reaction trajectories are both positive thus indicating there isn’t a thermodynamic driving force for the reactions to take place. This could possibly be the result of the products not gaining aromatic stabilisation to lower their energy.
Useful Links:
The links below direct you to the results of the optimisations up to the PM6 level...
Cheletropic Transition State Log file
Endo Transition State Log file
Alternative Endo Transition State Log file
Alternative Endo Product Log file
Alternative Exo Transition State Log file
Alternative Exo Product Log file
Conclusion:
In conclusion, these experiments have proved that the endo reaction barrier is usually lower than the exo as a result of stabilising secondary orbital overlap between p-orbitals on the dienophile and the orbitals at the back of the diene. In addition, the exo adduct is usually the more thermodynamically favourable of the two as a result of less steric hindrance. However, exercise two proves that the difference in reaction energies for the two orientations is so small that sterics can easily cause an increase in the energy of the exo product rendering it no longer the thermodynamically favourable adduct.
Moreover, from this lab I have been able to conclude that a PM6 calculation is not sufficient level of theory to use when performing a detailed quantitative analysis. This is because many approximations are used in the calculations using PM6 and so the resultant values are relative rather than absolute.
References:
- ↑ HARE, S.R., and TANTILLO, D. J., 2017. Post-transition state bifurcations gain momentum – current state of the field. Pure Appl. Chem. 89(6), pp. 679–698
- ↑ REICHENBACHER, M., and POPP, J., 2012. Challenges in Molecular Structure Determination. Springer-Verlag Berlin Heidelberg, pp. 64. DOI 10.1007/978-3-642-24390-5_1
- ↑ 3.0 3.1 3.2 3.3 3.4 3.5 WOODWARD, R.B., and HOFFMAN, R., 1969. Angew. Chem. Int. Ed. Engl. 8, pp.781–853
- ↑ 4.0 4.1 4.2 CRAIG, N. C., GRONER, P., and MCKEAN, D. C., 2006. Equilibrium Structures for Butadiene and Ethylene: Compelling Evidence for Π-Electron Delocalization in Butadiene. J. Phys. Chem. A, 110(23), pp. 7461–7469. DOI: 10.1021/jp060695b
- ↑ BATSANOV, S. S., 2001. Van der Waals Radii of Elements. Inorganic Materials, 37(9), pp. 871–885
- ↑ 6.0 6.1 6.2 6.3 6.4 CLAYDEN, J., GREEVES, N. and WARREN, S., 2012. Organic chemistry. Oxford: Oxford University Press, pp. 884-887


