Rep:Mod:Qsmzhl1
Computational Chemistry Inorganic module Lab
Optimising a Molecule of BH3
Create a BH3 molecule, set one B-H bond to 1.53 angstrom, one B-H bond to 1.54 angstrom, and the third B-H bond to 1.55 angstrom.
BH3 3-21G optimisation
         Item               Value     Threshold  Converged?
 Maximum Force            0.000220     0.000450     YES
 RMS     Force            0.000106     0.000300     YES
 Maximum Displacement     0.000709     0.001800     YES
 RMS     Displacement     0.000447     0.001200     YES
 Predicted change in Energy=-1.672478D-07
 Optimization completed.
Full BH3 3-21G optimisation log file is liked to here.
Table 1. BH3 3-21G Optimised bond distance and angle
| optimised B-H bond distance | optimisd H-B-H bond angle |
| 1.94Å | 120.00° |
BH3 3-21G optimisation summary
BH<sub>3</sub> optimisation
File Name = yiyun_bh3_opt2
File Type = .log
Calculation Type = FOPT
Calculation Method = RB3LYP
Basis Set = 3-21G
Charge = 0
Spin = Singlet
E(RB3LYP) = -26.46226429 a.u.
RMS Gradient Norm = 0.00008851 a.u.
Imaginary Freq =
Dipole Moment = 0.0003 Debye
Point Group = CS
Job cpu time:       0 days  0 hours  1 minutes 38.0 seconds.
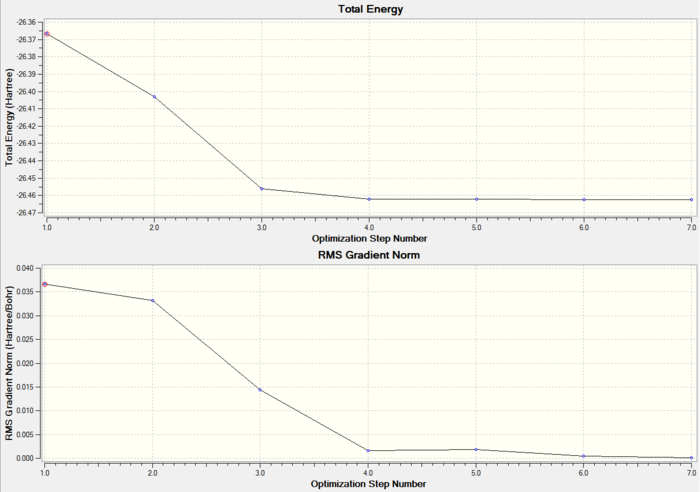
These two graphs illustrate the process of BH3 3-21G optimisation, while the first shows the energy of the molecule at each step and the second gives the gradient of optimisation of each step of optimisation. When the gradient shows a value which is very close to zero, it means the optimisation is completed.
Using a better basis set
Now we will use the optimised geometry to start a new optimisation using a higher level basis set: 6-31G(d,p)
BH3 6-31G(d,p) optimisation
         Item               Value     Threshold  Converged?
 Maximum Force            0.000012     0.000450     YES
 RMS     Force            0.000008     0.000300     YES
 Maximum Displacement     0.000061     0.001800     YES
 RMS     Displacement     0.000038     0.001200     YES
 Predicted change in Energy=-1.069855D-09
 Optimization completed.
Full BH3 6-31G(d,p) optimisation log file is liked to here.
Table 2. BH3 6-31G(d,p) Optimised bond distance and angle
| optimised B-H bond distance | lit. B-H bond distance | optimisd H-B-H bond angle |
| 1.19Å | 1.196Å[1] | 120.00° |
BH3 6-31G(d,p) optimisation summary
BH3 optimisation 631g
File Name = yiyun_bh3_opt2_631gdp
File Type = .log
Calculation Type = FOPT
Calculation Method = RB3LYP
Basis Set = 6-31G(d,p)
Charge = 0
Spin = Singlet
E(RB3LYP) = -26.61532360 a.u.
RMS Gradient Norm = 0.00000707 a.u.
Imaginary Freq =
Dipole Moment = 0.0001 Debye
Point Group = CS
Job cpu time:       0 days  0 hours  0 minutes 41.0 seconds.
Table 3. Total energy comparison
| BH3 3-21G | BH3 6-31G(d,p) |
| -26.46226429 a.u. | -26.61532360 a.u. |
Using pseudo-potentials and larger basis sets
GaBr3 optimisation
         Item               Value     Threshold  Converged?
 Maximum Force            0.000000     0.000450     YES
 RMS     Force            0.000000     0.000300     YES
 Maximum Displacement     0.000003     0.001800     YES
 RMS     Displacement     0.000002     0.001200     YES
 Predicted change in Energy=-1.282692D-12
 Optimization completed.
Full GaBr3 LanL2DZ optimisation log file is liked to here.
GaBr3 LanL2DZ optimisation summary(HPC)
GaBr3 optimisation
File Name = GaBr3_opt_lan
File Type = .log
Calculation Type = FOPT
Calculation Method = RB3LYP
Basis Set = LANL2DZ
Charge = 0
Spin = Singlet
E(RB3LYP) = -41.70082783 a.u.
RMS Gradient Norm = 0.00000016 a.u.
Imaginary Freq =
Dipole Moment = 0.0000 Debye
Point Group = D3H
Job cpu time:       0 days  0 hours  0 minutes 21.6 seconds.
"D-space" link : DOI:10042/26121
Table 4. GaBr3 optimised bond distance and angle
| optimised Ga-Br bond distance | lit. Ga-Br bond distance | optimisd Br-Ga-Br bond angle |
| 2.35Å | 2.239±0.007Å (at 357K)[2] | 120.00° |
The Gaussian calculated Ga-Br bond distance 2.35 Å is longer than the literature value 2.239±0.007 Å. The gaussian optimised structure is based on gas-phase hypothesis, while the literature value might be figured out through experiment. Therefore, interactions like solid state forces or crystal packing forces will distort the molecule by shrinking the Ga-Br bond distance.
Using a mixture of basis-sets and psuedo-potentials
BBr3 Gen optimisation
Reference
         Item               Value     Threshold  Converged?
 Maximum Force            0.000018     0.000450     YES
 RMS     Force            0.000010     0.000300     YES
 Maximum Displacement     0.000106     0.001800     YES
 RMS     Displacement     0.000061     0.001200     YES
 Predicted change in Energy=-2.171373D-09
 Optimization completed.
Full BBr3 Gen optimisation log file is liked to here.
BBr3 Gen optimisation summary
BBr3 optimisation 631g
File Name = BBr3_opt
File Type = .log
Calculation Type = FOPT
Calculation Method = RB3LYP
Basis Set = Gen
Charge = 0
Spin = Singlet
E(RB3LYP) = -64.43644900 a.u.
RMS Gradient Norm = 0.00000974 a.u.
Imaginary Freq =
Dipole Moment = 0.0003 Debye
Point Group = CS
Job cpu time:       0 days  0 hours  0 minutes 36.4 seconds.
"D-space" link : DOI:10042/26129
Table 5. BBr3 Gen Optimised bond distance and angle
| optimised B-Br bond distance | lit. B-Br bond distance | optimisd Br-B-Br bond angle |
| 1.93Å | 1.8985Å[3] | 120.00° |
Structure Comparison
Analysing results
Table. Bond distance comparison
| BH3 | BBr3 | GaBr3 | |
| Bond distance | 1.19Å | 1.93Å | 2.35Å |
| Lit. Bond distance | 1.196Å | 1.8985Å | 2.239Å |
By comparing the molecule with same central element and different ligands, take BH3 and BBr3 as an example. The Bond distance is much longer for Boron bond with larger ligand Br compared with Boron bond with H, with 1.196Å and 1.8985Å respectively. The reason to cause such a difference is due to that B-Br has larger electronegativity difference than B-H . Therefore, the polarity bewteen Boron and Br is much strong than the one between Boron and H. This can cause unequal sharing of electrons between atoms, which weaken the bond. (Electronegativity: B=2.04 H=2.20 Br=2.96) Br has an atomic number 17, which is larger compared with H with 1 atomic number. This leads to that Br has a large atomic radius and low positive charge density, therefore poor orbital overlap. The valence shell of Br [[Ar] 4s2 3d10 4p5] is p orbital, while the valence shell of H is s orbital.
By comparing BBr3 with GaBr3, the bond distance of GaBr3 is slightly larger than BBr3. The same reason to cause such a differece is due to the electronegativity difference for Ga-Br is larger than B-Br, therefore leads to a more unequal sharing of electrons, which weaken the bond.(Electronegativity: B=2.04 Ga=1.81 Br=2.96) Meanwhile, Gallium has a larger atomic number 31[[Ar] 3d10 4s2 4p1], compared with boron with atomic number 5[[He] 2s2 2p1]. Therefore, Gallium has a larger atomic radius and poor positive charge density, leads to the poorer orbital overlap with Br and longer the bond.
Yes, the bond does exist! The reason why in some structures don't have any bonds is because that the distance exceeds the pre-defined value set in gaussview. The gaussview draws bonds based on a distance critera!
There are three types of bonds, which are covalent bond(formed by sharing electrons), ionic bond(formed by transferring the electrons) and metallic bond(formed by the delocalised electrons gathering at the positive charged metal ion surface).
Frequency Analysis
frequency analysis for BH3
 Low frequencies ---   -0.9382   -0.8426   -0.0054    5.8717   11.7883   11.8256
 Low frequencies --- 1162.9968 1213.1829 1213.1856
         Item               Value     Threshold  Converged?
 Maximum Force            0.000006     0.000450     YES
 RMS     Force            0.000003     0.000300     YES
 Maximum Displacement     0.000022     0.001800     YES
 RMS     Displacement     0.000011     0.001200     YES
 Predicted change in Energy=-1.909158D-10
 Optimization completed.
Full BH3 6-31G(d,p) frequency log file is liked to here.
BH3 6-31G(d,p) frequency summary
BH3 freq
File Name = YIYUN_BH3_freq
File Type = .log
Calculation Type = FREQ
Calculation Method = RB3LYP
Basis Set = 6-31G(d,p)
Charge = 0
Spin = Singlet
E(RB3LYP) = -26.61532363 a.u.
RMS Gradient Norm = 0.00000284 a.u.
Imaginary Freq = 0
Dipole Moment = 0.0000 Debye
Point Group = D3H
Job cpu time:       0 days  0 hours  0 minutes 23.0 seconds.
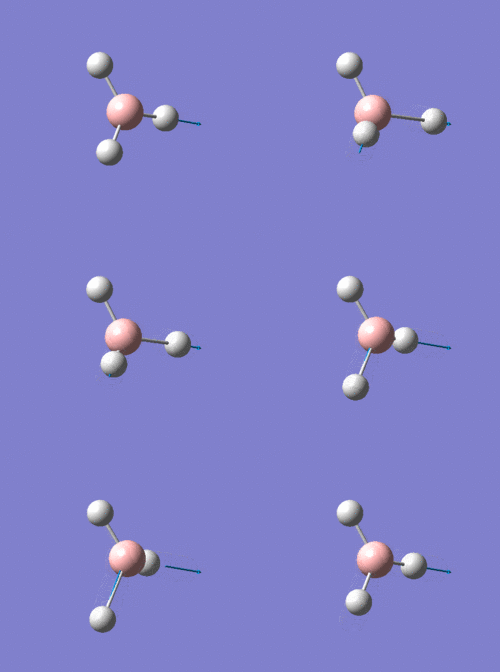
Animating the vibrations
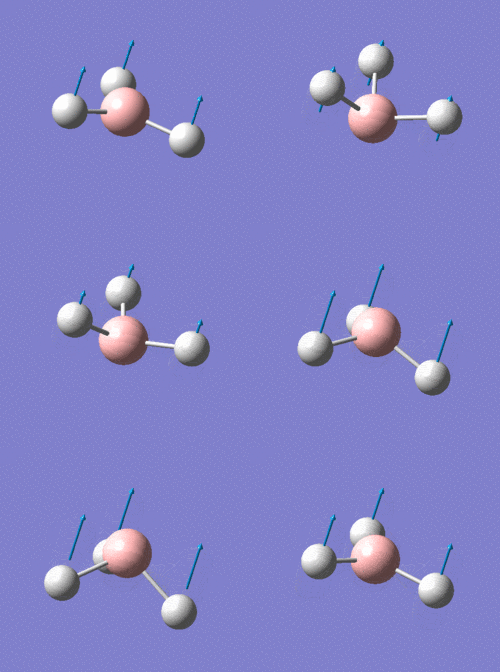
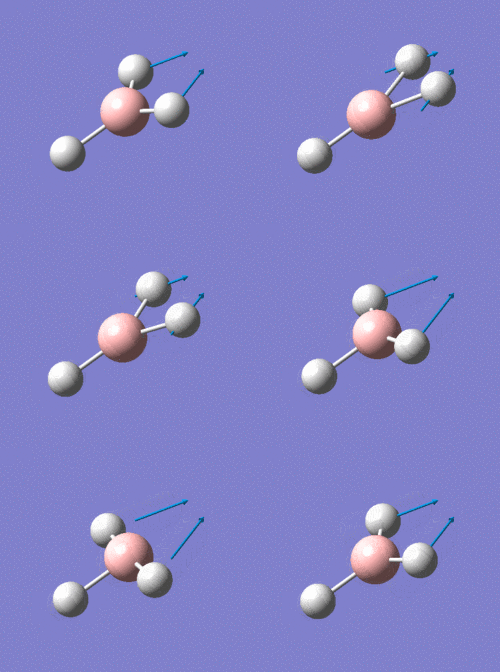
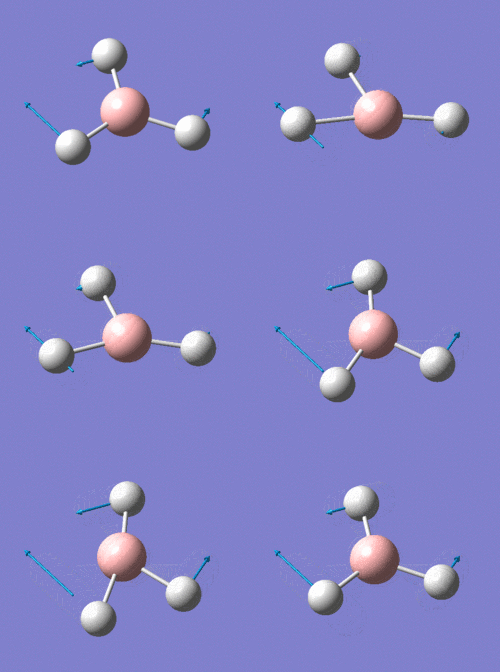
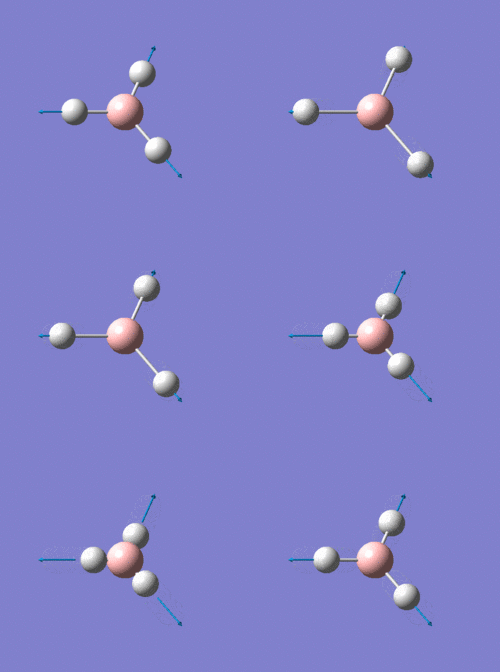
Table
BH3 IR spectrum
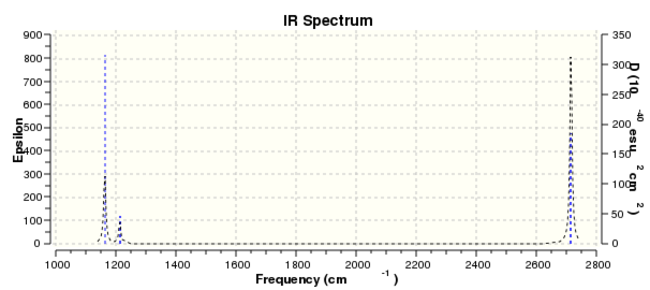
From the spectra, it only shows three peaks. However, in the table above, there are six vibration frequencies come out. The reason is that there are two pairs of degenerated energy levels which give the same frequency, with 1213 cm-1 and 2715 cm-1 separately. What's more, the total symmetric energy level A'1 is IR inactive. Therefore, there are only there peaks come out.
GaBr3 Analysis
frequency analysis for GaBr3
 Low frequencies ---   -0.5252   -0.5247   -0.0024   -0.0010    0.0235    1.2010
 Low frequencies ---   76.3744   76.3753   99.6982
         Item               Value     Threshold  Converged?
 Maximum Force            0.000000     0.000450     YES
 RMS     Force            0.000000     0.000300     YES
 Maximum Displacement     0.000002     0.001800     YES
 RMS     Displacement     0.000001     0.001200     YES
 Predicted change in Energy=-6.142862D-13
 Optimization completed.
Full GaBr3 LanL2DZ frequency log file is liked to here.
GaBr3 LanL2DZ frequency summary
GaBr3 freq
File Name = GaBr3freqHPC
File Type = .log
Calculation Type = FREQ
Calculation Method = RB3LYP
Basis Set = LANL2DZ
Charge = 0
Spin = Singlet
E(RB3LYP) = -41.70082783 a.u.
RMS Gradient Norm = 0.00000011 a.u.
Imaginary Freq = 0
Dipole Moment = 0.0000 Debye
Point Group = D3H
Job cpu time:       0 days  0 hours  0 minutes 14.2 seconds.
"D-space" link : DOI:10042/26130
GaBr3 IR spectrum
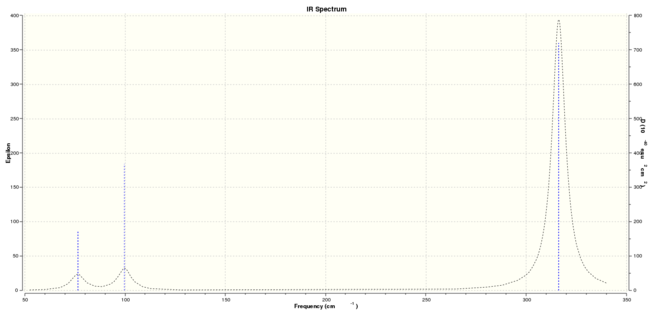
Table. BH3 and GaBr3 vibrational frequency comparison
| No. | BH3 Frequency /cm-1 | Intensity | BH3 symmetry D3h point group | GaBr3 Frequency/cm-1 | Intensity | GaBr3 symmetry D3h point group |
| 1 | 1163 | 92.55 | A2" | 76.37 | 3.34 | E' |
| 2 | 1213.18 | 14.06 | E' | 76.38 | 3.34 | E' |
| 3 | 1213.19 | 14.06 | E' | 99.7 | 9.22 | A2" |
| 4 | 2582.27 | 0 | A'1 | 197.34 | 0 | A1' |
| 5 | 2715.44 | 126.33 | E' | 316.18 | 57.07 | E' |
| 6 | 2715.45 | 126.32 | E' | 316.19 | 57.07 | E' |
Both BH3 and GaBr3 molecule has a D3h point group. That is why they both show six vibration frequencies with two pairs of degenerated e' energy levels, one totally symmetric a1' energy level and one a2" energy level. It also explains why only three peaks shows in IR spectrum. The obvious difference is that GaBr3 has a larger frequency value in general compared with BH3. The reason is that BH bond is more rigid compared with GaBr bond. It is also due to the shorter bond length which refers to larger force constant for BH bond. Therefore, more vibrational energy required to cause a stretch or bent to the structure, result in high vibrational frequency.
Within each molecule, six vibrational frequencies could be allocated into two groups. One is bent structure and the other is stretch structure. Take BH3 as an example, according to the MO diagram shown above, frequencies with value 1163 cm-1; 1213.18 cm-1; 1213.19 cm-1 are recognised as bent structure while the other three left are stretch structure. The stretch structure shows higher vibrational frequency than bent structure. The reason might be that changing bond length requires a higher vibrational energy than changing the bond angle does.
It is meaningless to compare the energies with different basis set (or pseudo-potentials) due to that total energy calculation is highly depend on the quality of basis set. The energy difference would be quite large if we using the different basis set to compare, due to that the energy is in unit a.u. (1 a.u.= 2625kJ/mol)
By carrying out a frequency analysis, we could make sure that we find out the optimised structure with minimal energy through the vibrational frequency and the IR correlated spectrum.
"Low frequency" refers to the motions of the center of mass of the molecule. Take BH3 as an example, low frequencies here represent -6 by using the formula 3N-6 , where N is the number of atoms.
"Real frequency" refers to the first value of the second row within the 'low frequency table', which is the first visible frequency within IR spectra.
Molecular Orbital of BH3
BH3 energy summary
BH3 energy
File Name = BH3_631g_energyHPC
File Type = .log
Calculation Type = SP
Calculation Method = RB3LYP
Basis Set = 6-31G(d,p)
Charge = 0
Spin = Singlet
E(RB3LYP) = -26.61532363 a.u.
RMS Gradient Norm =  a.u.
Imaginary Freq =
Dipole Moment = 0.0000 Debye
Point Group = D3H
Job cpu time:       0 days  0 hours  0 minutes 15.9 seconds.
"D-space" link : DOI:10042/26135
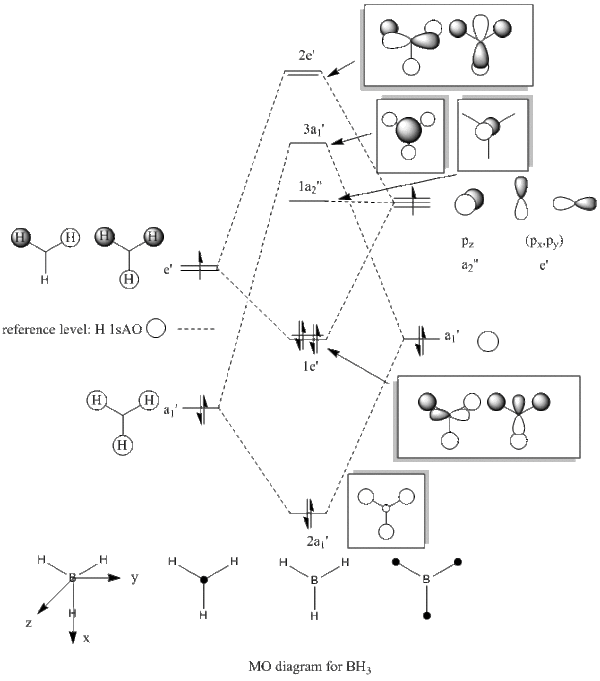
Table. MO diagrams
| Energy level | MO diagram |
| degenerated antibonding 2e' | 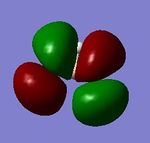 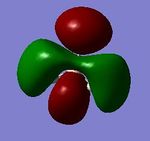 |
| antibonding 3a1'(LUMO orbital) | 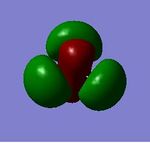 |
| non-bonding 1a2 | 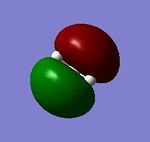 |
| degenerated bonding 1e' | 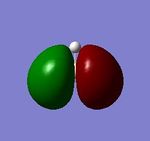 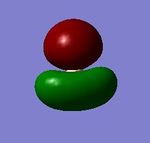 |
| bonding 2a1' |  |
Real MOs include the consideration of the electronic density distribution which makes it more diffuse compared with the LCAO MOs as we can see from the diagrams above. The LCAO MOs only shows the clear atomic orbital interactions.
NBO Analysis
NH3 6-31G(d,p) optimisation
         Item               Value     Threshold  Converged?
 Maximum Force            0.000024     0.000450     YES
 RMS     Force            0.000012     0.000300     YES
 Maximum Displacement     0.000079     0.001800     YES
 RMS     Displacement     0.000053     0.001200     YES
 Predicted change in Energy=-1.629718D-09
 Optimization completed.
Full NH3 6-31G(d,p) optimisation log file is liked to here.
NH3 6-31G(d,p) optimisation summary
NH3 optimisation
File Name = YIYUN_NH3_OPT_631G
File Type = .log
Calculation Type = FOPT
Calculation Method = RB3LYP
Basis Set = 6-31G(d,p)
Charge = 0
Spin = Singlet
E(RB3LYP) = -56.55776856 a.u.
RMS Gradient Norm = 0.00000885 a.u.
Imaginary Freq =
Dipole Moment = 1.8464 Debye
Point Group = C1
Job cpu time:       0 days  0 hours  1 minutes  6.0 seconds.
NH3 6-31G(d,p) frequency
 Low frequencies ---   -7.2856   -7.2001   -7.1997   -0.0020    0.0018    0.0124
 Low frequencies --- 1089.2799 1693.9186 1693.9186
         Item               Value     Threshold  Converged?
 Maximum Force            0.000007     0.000450     YES
 RMS     Force            0.000002     0.000300     YES
 Maximum Displacement     0.000034     0.001800     YES
 RMS     Displacement     0.000012     0.001200     YES
 Predicted change in Energy=-1.315803D-10
 Optimization completed.
Full NH3 6-31G(d,p) frequency log file is liked to here.
NH3 6-31G(d,p) frequency summary
NH3 frequency
File Name = NH3_freq3
File Type = .log
Calculation Type = FREQ
Calculation Method = RB3LYP
Basis Set = 6-31G(d,p)
Charge = 0
Spin = Singlet
E(RB3LYP) = -56.55776873 a.u.
RMS Gradient Norm = 0.00000237 a.u.
Imaginary Freq = 0
Dipole Moment = 1.8464 Debye
Point Group = C3V
Job cpu time:       0 days  0 hours  0 minutes 22.5 seconds.
"D-space" link : DOI:10042/26151
NH3 IR spectrum
NH3 IR energy summary
NH3 energy
File Name = NH3_energy
File Type = .log
Calculation Type = SP
Calculation Method = RB3LYP
Basis Set = 6-31G(d,p)
Charge = 0
Spin = Singlet
E(RB3LYP) = -56.55776856 a.u.
RMS Gradient Norm =  a.u.
Imaginary Freq =
Dipole Moment = 1.8464 Debye
Point Group = C1
Job cpu time:       0 days  0 hours  0 minutes 32.2 seconds.
'NH3 charge distribution diagrams
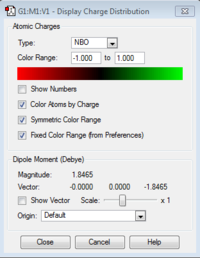
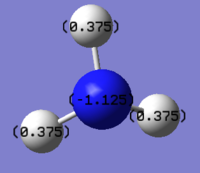
Red color means highly electronegative, while green color refers to electropositive. The nitrogen has a negative charge of -1.125 and the hydrogen has a positive charge of 0.375. The molecule is neutral due to that the negative charge and the sum of the three positive charges are cancelled out.
Association energies: Ammonia-Borane
NH3BH3 6-31G(d,p) optimisation
         Item               Value     Threshold  Converged?
 Maximum Force            0.000002     0.000015     YES
 RMS     Force            0.000001     0.000010     YES
 Maximum Displacement     0.000024     0.000060     YES
 RMS     Displacement     0.000010     0.000040     YES
 Predicted change in Energy=-8.746365D-11
 Optimization completed.
Full NH3BH3 6-31G(d,p) optimisation log file is liked to here.
NH3BH3 6-31G(d,p) optimisation summary
NH3BH3 opt
File Name = NH3BH3_OPT_631G_2
File Type = .log
Calculation Type = FOPT
Calculation Method = RB3LYP
Basis Set = 6-31G(d,p)
Charge = 0
Spin = Singlet
E(RB3LYP) = -83.22468911 a.u.
RMS Gradient Norm = 0.00000122 a.u.
Imaginary Freq =
Dipole Moment = 5.5647 Debye
Point Group = C1
Job cpu time:       0 days  0 hours  0 minutes 48.0 seconds.
NH3BH3 6-31G(d,p) frequency
 Low frequencies ---   -5.3030   -0.3083   -0.0451   -0.0011    1.2000    1.2747
 Low frequencies ---  263.2955  632.9608  638.4638
         Item               Value     Threshold  Converged?
 Maximum Force            0.000004     0.000450     YES
 RMS     Force            0.000001     0.000300     YES
 Maximum Displacement     0.000024     0.001800     YES
 RMS     Displacement     0.000009     0.001200     YES
 Predicted change in Energy=-1.117730D-10
 Optimization completed.
Full NH3BH3 6-31G(d,p) frequency log file is liked to here.
NH3BH3 6-31G(d,p) frequency summary
NH3BH3 freq
File Name = NH3BH3_FREQ
File Type = .log
Calculation Type = FREQ
Calculation Method = RB3LYP
Basis Set = 6-31G(d,p)
Charge = 0
Spin = Singlet
E(RB3LYP) = -83.22468909 a.u.
RMS Gradient Norm = 0.00000139 a.u.
Imaginary Freq = 0
Dipole Moment = 5.5646 Debye
Point Group = C3V
Job cpu time:       0 days  0 hours  0 minutes 16.0 seconds.
Table. Frequency energy comparison( Basis set = 6-31G (d,p) )
| E(NH3) | E(BH3) | E(NH3BH3) |
| -56.55776873 a.u. | -26.61532363 a.u. | -83.22468909 a.u. |
Association energy
ΔE=E(NH<sub>3</sub>BH<sub>3</sub>)-[E(NH<sub>3</sub>)+E(BH<sub>3</sub>)]
  = -83.22468909 - [-56.55776873 + (-26.61532363)]
  = -0.05159673 a.u.
  = -135.47 kJ/mol

(1 a.u. ≜ 2625.499 62 kJ/mol)
Dissociation energy = 135.47 kJ/mol The dissociation energy is positive, therefore it is an endothermic process. It indicates that Ammonia-Borane is more stable.
Mini Projcet : Lewis acid and base
4 possible isomers of Al2Cl4Br2 Optimisation
| Isomer 1 | Isomer 2 | Isomer 3 | Isomer 4 | |||||||||||||
| Structure |
|
|
|
| ||||||||||||
| File Name | 2br inmid_opt | 1BR INMID_OPT_gen | br up down opt | 2br at top_opt | ||||||||||||
| File Type | .log | .log | .log | .log | ||||||||||||
| Calculation type | FOPT | FOPT | FOPT | FOPT | ||||||||||||
| Calculation Method | RB3LYP | RB3LYP | RB3LYP | RB3LYP | ||||||||||||
| Basis Set | Gen | Gen | Gen | Gen | ||||||||||||
| Charge | 0 | 0 | 0 | 0 | ||||||||||||
| Spin | Singlet | Singlet | Singlet | Singlet | ||||||||||||
| E(RB3LYP) | -2352.40630798 | -2352.41109948 | -2352.41631610 | -2352.41626680 | ||||||||||||
| RMS Gradient Norm | 0.00000188 | 0.00001352 | 0.00001372 | 0.00000660 | ||||||||||||
| Imaginary Freq | ||||||||||||||||
| Dipole Moment | 0 | 0.1390 | 0.0013 | 0.1690 | ||||||||||||
| Point Group | D2H | C1 | CS | C2V | ||||||||||||
| Job cpu time | 0 days 0 hours 7 minutes 23.6 seconds. | 0 days 0 hours 1 minutes 39.0 seconds. | 0 days 0 hours 5 minutes 42.7 seconds. | 0 days 0 hours 8 minutes 37.5 seconds. | ||||||||||||
| D-space link | DOI:10042/26227 | DOI:10042/26261 | DOI:10042/26343 | DOI:10042/26231 | ||||||||||||
| full opt. log file | Isomer 1 | Isomer 2 | Isomer 3 | Isomer 4 |
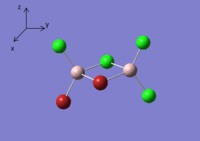
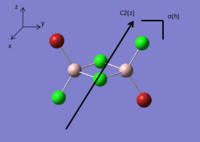
Base on the knowledge we learnt before, the real point group base on the isomer structure shows below:
Table. Real point group and symmetry elements of four isomers
| Isomer 1 | Isomer 2 | Isomer 3 | Isomer 4 | |
| Structure | 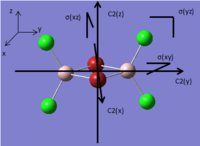 |
 |
 |
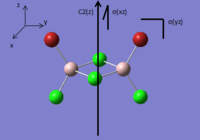 |
| symmetry elements | E,C2(z),C2 (y),C2(x,)i,σ(xy),σ(xz),σ(yz) | E | E,C2(z),i,σh | E,C2(z),σv(xz),σv(yz) |
| Real point group | D2h | C1 | C2h | C2v |
Isomer 1 optimisation
         Item               Value     Threshold  Converged?
 Maximum Force            0.000003     0.000450     YES
 RMS     Force            0.000001     0.000300     YES
 Maximum Displacement     0.000057     0.001800     YES
 RMS     Displacement     0.000015     0.001200     YES
 Predicted change in Energy=-2.944095D-10
 Optimization completed.
Isomer 2 optimisation
         Item               Value     Threshold  Converged?
 Maximum Force            0.000027     0.000450     YES
 RMS     Force            0.000012     0.000300     YES
 Maximum Displacement     0.000548     0.001800     YES
 RMS     Displacement     0.000196     0.001200     YES
 Predicted change in Energy=-2.150173D-08
 Optimization completed.
Isomer 3 optimisation
         Item               Value     Threshold  Converged?
 Maximum Force            0.000022     0.000450     YES
 RMS     Force            0.000008     0.000300     YES
 Maximum Displacement     0.001062     0.001800     YES
 RMS     Displacement     0.000483     0.001200     YES
 Predicted change in Energy=-1.142040D-08
 Optimization completed.
Isomer 4 optimisation
         Item               Value     Threshold  Converged?
 Maximum Force            0.000022     0.000450     YES
 RMS     Force            0.000012     0.000300     YES
 Maximum Displacement     0.000833     0.001800     YES
 RMS     Displacement     0.000305     0.001200     YES
 Predicted change in Energy=-2.399764D-08
 Optimization completed.
AlCl2Br monomer optimisation
Alcl2br freq.mol2 |
         Item               Value     Threshold  Converged?
 Maximum Force            0.000136     0.000450     YES
 RMS     Force            0.000073     0.000300     YES
 Maximum Displacement     0.000760     0.001800     YES
 RMS     Displacement     0.000497     0.001200     YES
 Predicted change in Energy=-7.984520D-08
 Optimization completed.
Full AlCl2Br monomer gen optimisation log file is liked to here.
AlCl2Br monomer gen optimisation summary
AlCl2Br opt
File Name = AlCl2Br opt_gen
File Type = .log
Calculation Type = FOPT
Calculation Method = RB3LYP
Basis Set = Gen
Charge = 0
Spin = Singlet
E(RB3LYP) = -1176.19013679 a.u.
RMS Gradient Norm = 0.00004196 a.u.
Imaginary Freq =
Dipole Moment = 0.1075 Debye
Point Group = CS
Job cpu time:       0 days  0 hours  1 minutes 17.3 seconds.
AlCl2Br monomer frequency analysis
Low frequencies ---    0.0029    0.0030    0.0044    1.3628    3.6408    4.2614
 Low frequencies ---  120.5042  133.9180  185.8952
         Item               Value     Threshold  Converged?
 Maximum Force            0.000082     0.000450     YES
 RMS     Force            0.000042     0.000300     YES
 Maximum Displacement     0.001588     0.001800     YES
 RMS     Displacement     0.000975     0.001200     YES
 Predicted change in Energy=-1.813492D-07
 Optimization completed.
Full AlCl2Br monomer frequency log file is liked to here.
AlCl2Br monomer gen frequency summary
AlCl2Br freq
File Name = Alcl2br freq
File Type = .log
Calculation Type = FREQ
Calculation Method = RB3LYP
Basis Set = Gen
Charge = 0
Spin = Singlet
E(RB3LYP) = -1176.19013679 a.u.
RMS Gradient Norm = 0.00004201 a.u.
Imaginary Freq = 0
Dipole Moment = 0.1075 Debye
Point Group = C2V
Job cpu time:       0 days  0 hours  0 minutes 37.4 seconds.
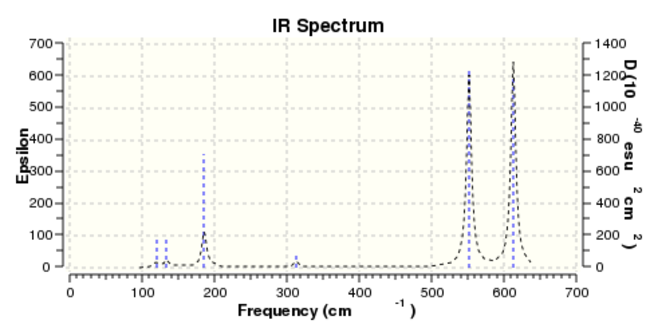
Table. Opt Energy comparison of for isomers
| Freq E(RB3LYP)/ a.u. | Freq E(RB3LYP)/kJ/mol | related | Energy difference compared to the lowest one/kJ/mol | |
| Isomer 1 | -2352.40630798 | -6176240.41 | highest | 26.28 |
| Isomer 2 | -2352.41109948 | -6176252.99 | 13.70 | |
| Isomer 3 | -2352.41631610 | -6176266.69 | lowsest | 0 |
| Isomer 4 | -2352.41626680 | -6176266.56 | 0.13 |
Isomer 3, with two terminal Br at diagonal position, has the lowest energy, indicating the most stable conformer. Isomer 4, with two terminal Br at symmetric position, has the second lowest energy. However, the energy difference is quite small with a value of 0.13kJ/mol only. For those isomers with at least one Br connected at bridged position, by comparing to the most stable conformer(non-Br bridged isomer), it shows a quite large energy gap between them. Isomer 1, with two bridged Br in mid, has the highest energy, indicating the least stable conformer. Isomer 2, with only one Br at bridged position, shows a half value of the difference between the two-Br bridged isomer and non-Br bridged conformer.
The reason to cause such a energy gap can be explained by the difference in overlap between orbitals. Al, Cl and Br have electronic configurations with [[Ne] 3s2 3p1], [[Ne] 3s2 3p5] and [[Ar] 4s2 3d10 4p5] respectively. The 3p-3p (Al-Cl bridged bond)orbital overlap is more stable than 3p-4p(Al-Br bridge bond)orbital overlap, therefore isomer 3 is most stable, with two terminal Br at diagonal position. Meanwhile, the steric effect would also be a factor to be considered why Cl is more stable at bridged position other than Br.
Dissociation energy for the lowest energy conformer(Isomer 3)
Opt energy comparison
| AlCl2Br | Isomer 3 |
| -2352.41631610 a.u. | -1176.19013679 a.u. |
ΔE= [(E(AlCl2Br)*2)-E(Al2Cl4Br2)]
  = [(-1176.19013679*2) - (-2352.41631610)]
  = 0.03604252a.u.
  = 94.63kJ/mol

(1 a.u. ≜ 2625.499 62 kJ/mol)
The dissociation energy computed above is a positive value which indicates it is an endothermic process. Therefore, the product is more favourable than the monomer.
By comparing the monomer with the product dimer, the later one is more stable. It can be explained by that the monomer has only 6 bonded electron in the center Al, which shows a higher electron deficiency than the bridged dimer with 8 electrons in each Al center.
4 possible isomers of Al2Cl4Br2 Frequency analysis
| Isomer 1 | Isomer 2 | Isomer 3 | Isomer 4 | |||||||||||||
| Structure |
|
|
|
| ||||||||||||
| File Type | .log | .log | .log | .log | ||||||||||||
| Calculation type | FREQ | FREQ | FREQ | FREQ | ||||||||||||
| Calculation Method | RB3LYP | RB3LYP | RB3LYP | RB3LYP | ||||||||||||
| Basis Set | Gen | Gen | Gen | Gen | ||||||||||||
| Charge | 0 | 0 | 0 | 0 | ||||||||||||
| Spin | Singlet | Singlet | Singlet | Singlet | ||||||||||||
| E(RB3LYP)/ a.u. | -2352.40630798 | -2352.41109948 | -2352.41631610 | -2352.41626680 | ||||||||||||
| RMS Gradient Norm/ a.u. | 0.00000188 | 0.00001354 | 0.00001368 | 0.00000657 | ||||||||||||
| Imaginary Freq | ||||||||||||||||
| Dipole Moment/Debye | 0 | 0.1390 | 0.0013 | 0.1690 | ||||||||||||
| Point Group | D2H | C1 | CS | C2V | ||||||||||||
| Job cpu time | 0 days 0 hours 1 minutes 11.9 seconds. | 0 days 0 hours 3 minutes 31.5 seconds. | 0 days 0 hours 2 minutes 30.3 seconds. | 0 days 0 hours 1 minutes 40.9 seconds. | ||||||||||||
| D-space link | DOI:10042/26347 | DOI:10042/26348 | DOI:10042/26349 | DOI:10042/26230 | ||||||||||||
| full freq. log file | Isomer 1 | Isomer 2 | Isomer 3 | Isomer 4 |
Isomer 1 frequnency
 Low frequencies ---   -5.1748   -5.0353   -3.1463   -0.0055   -0.0053   -0.0051
 Low frequencies ---   14.8261   63.2702   86.0770
         Item               Value     Threshold  Converged?
 Maximum Force            0.000006     0.000450     YES
 RMS     Force            0.000002     0.000300     YES
 Maximum Displacement     0.000066     0.001800     YES
 RMS     Displacement     0.000021     0.001200     YES
 Predicted change in Energy=-3.736206D-10
 Optimization completed.
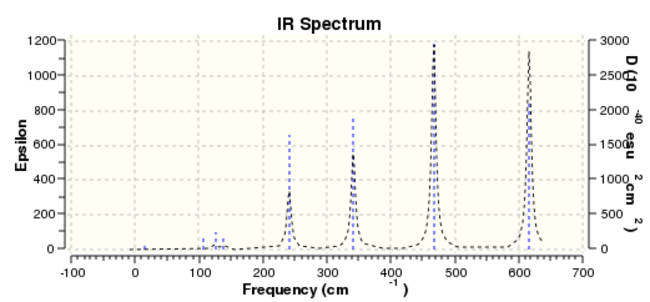
Isomer 2 frequnency
 Low frequencies ---   -2.3182   -0.0011    0.0024    0.0034    1.0656    3.0876
 Low frequencies ---   17.1031   55.9263   80.0668
         Item               Value     Threshold  Converged?
 Maximum Force            0.000035     0.000450     YES
 RMS     Force            0.000014     0.000300     YES
 Maximum Displacement     0.000887     0.001800     YES
 RMS     Displacement     0.000381     0.001200     YES
 Predicted change in Energy=-3.842255D-08
 Optimization completed.
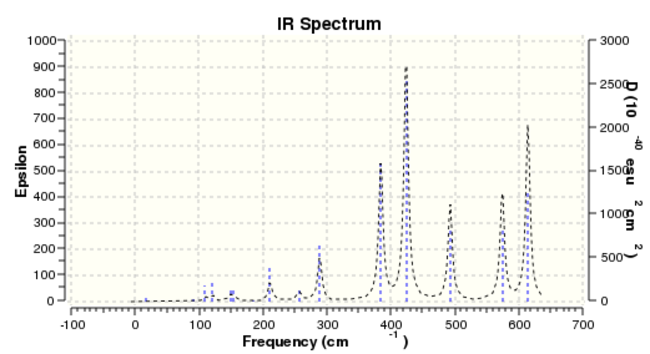
Isomer 3 frequnency
 Low frequencies ---    0.0034    0.0034    0.0035    1.8920    1.9704    3.9624
 Low frequencies ---   18.0988   49.0858   72.9223
         Item               Value     Threshold  Converged?
 Maximum Force            0.000040     0.000450     YES
 RMS     Force            0.000014     0.000300     YES
 Maximum Displacement     0.001356     0.001800     YES
 RMS     Displacement     0.000593     0.001200     YES
 Predicted change in Energy=-1.805357D-08
 Optimization completed.

Isomer 4 frequnency
 Low frequencies ---   -4.2528   -2.3928   -0.0052   -0.0050   -0.0043    1.2845
 Low frequencies ---   17.1623   50.9093   78.5490
         Item               Value     Threshold  Converged?
 Maximum Force            0.000018     0.000450     YES
 RMS     Force            0.000007     0.000300     YES
 Maximum Displacement     0.001428     0.001800     YES
 RMS     Displacement     0.000636     0.001200     YES
 Predicted change in Energy=-1.036447D-08
 Optimization completed.
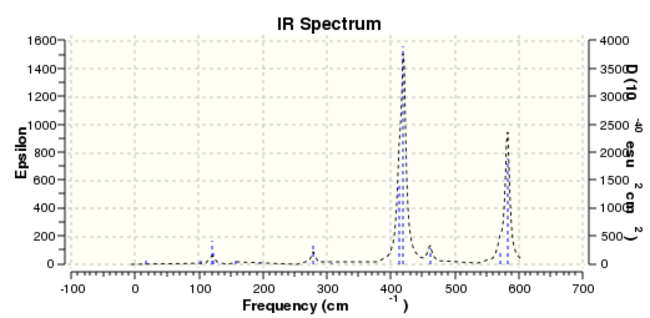
Based on the data collected, due to that the atoms are all the same, therefore the four IR spectra show the same 18 vibrational frequencies, which is calculated by the formula Vibrational Mod = 3N-6. Whenever there is a change in dipole moment, an IR active peak will be generated.
According to four IR spectra diagrams, it can be seen that isomer 2 (Point Group C1)has a largest number of bands in its' IR spectra. The reason is that it is the most non-symmetric conformer. What's more, all the vibrational frequencies are IR active and it can be explained by that all intensity are non-zero value. D2h is considered to be the most symmetric conformer. The other isomers with symmetric element shows some IR inactive peaks with intensity equals to 0.
Table. Number of IR active vibrational frequency of each isomer
| Isomer 1(D2h) | Isomer 2(C1 ) | Isomer 3(C2h) | Isomer 4(C2v) | |
| Number of IR active. | 8 | 18 | 10 | 15 |
Number of IR active refers to exact the number of bands would show in the IR spectra. All the vibrational frequency values are different, therefore there are no degenerated energy levels.
Al-Br stretch analysis
Table. Vibrational frequency Mode 15 Al-Br stretch comparison
Table. Isomer 2 Al-Br stretch comparison at different vibrational frequency
Molecular Orbital of Al2Cl4Br2
In the section, the MO Calculation of the lowest energy conformer is carried out, which is isomer 3 with two terminal Br at diagonal position.
opt-br-up-down energy
File Name = br up and down energy
File Type = .log
Calculation Type = SP
Calculation Method = RB3LYP
Basis Set = Gen
Charge = 0
Spin = Singlet
E(RB3LYP) = -2352.41631610 a.u.
RMS Gradient Norm =  a.u.
Imaginary Freq =
Dipole Moment = 0.0013 Debye
Point Group = CS
Job cpu time:       0 days  0 hours  0 minutes 31.2 seconds.
Full Isomer 3 (lowest energy conformer) energy log file is liked to here.
"D-space" link : DOI:10042/26396
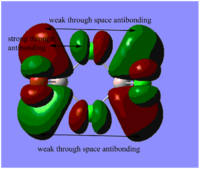
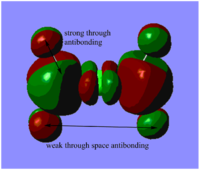
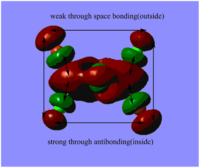
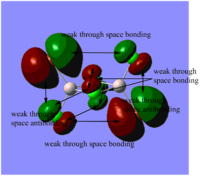
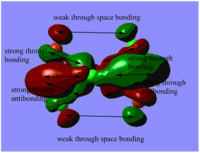
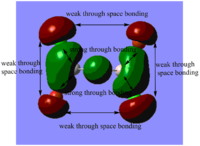
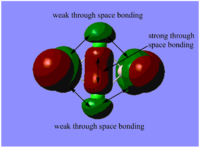
Table. Five MOs ranging from highly antibonding to highly bonding
NB.An angular node is a flat plane. A radial node is a circular ring.
Further Study
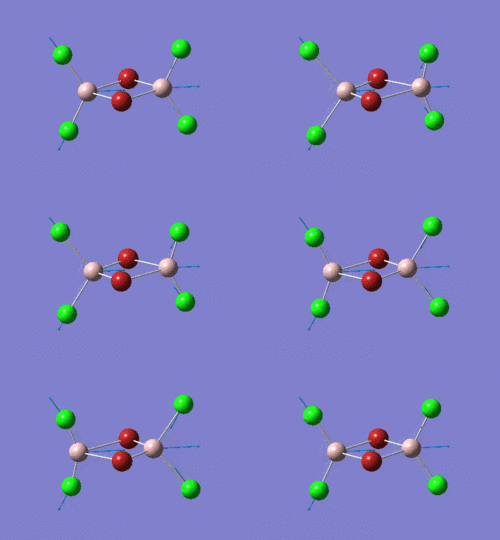
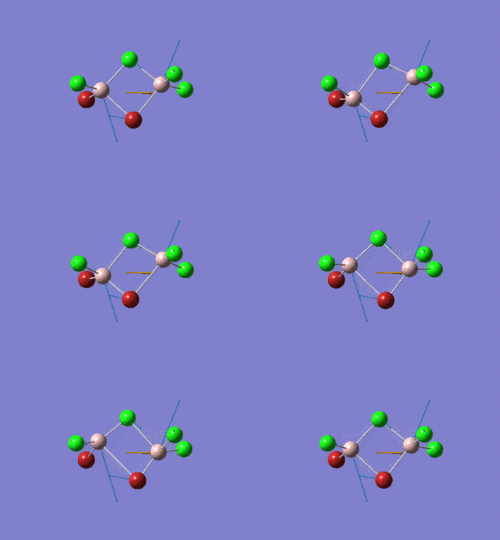
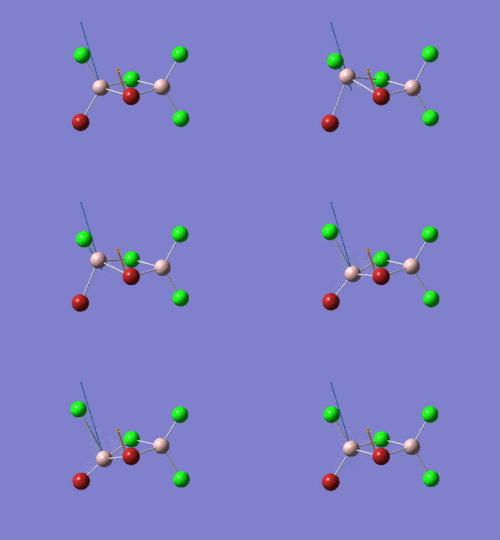
The part which interested me a lot is the Al-Br Stretch Analysis. Within this part, I found that terminal stretches would likely to show a high vibrational frequency , while the bridged stretches are more favorable to show a low vibrational frequency. The following diagrams clearly illustrate the concept.
| at mode 11 | vibrational frequency/cm-1 | at mode 18 | vibrational frequency/cm-1 | |
| Isomer 1 | 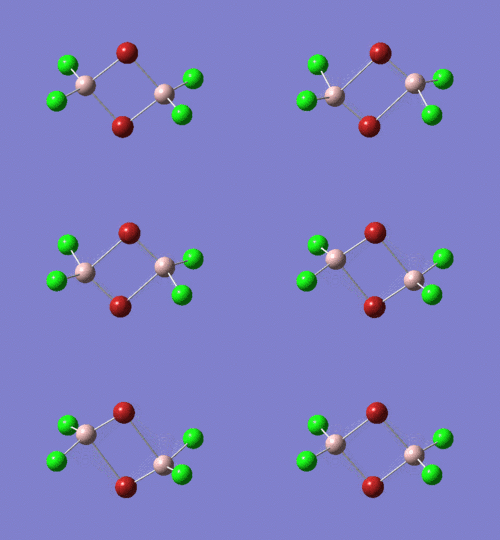 |
196.88 |  |
616.34 |
| Isomer 3 | 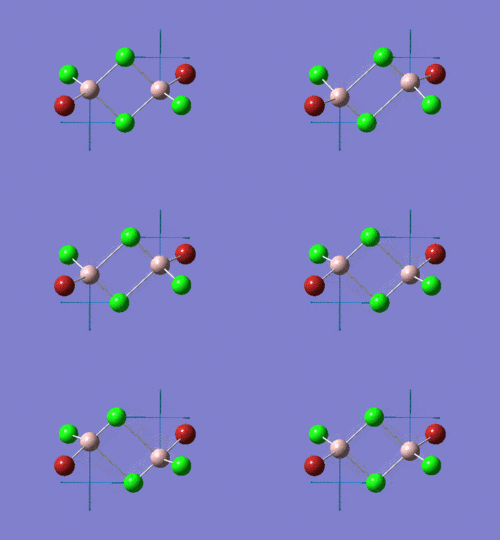 |
263.43 | 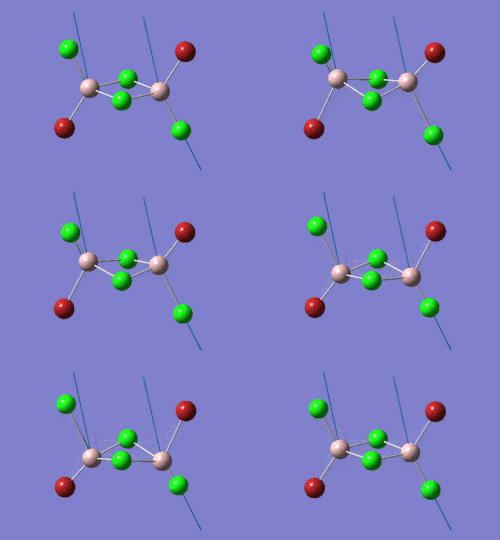 |
579.15 |
By comparing the diagrams in horizontal direction, both isomers show terminal stretches at high vibrational frequency and bridged stretches at low frequency. The other two isomers also shows a agreement. The reason could be explained by that terminal Al-Cl bond is stronger than the bridged Al-Br bond, with bond length 2.09 Å and 2.49 Å respectively. Therefore, the weak Al-Br bond requires less vibrational energy than the strong Al-Cl bond does, leading to a lower vibrational frequency.
By comparing the diagram in a vertical direction, the bridged Al-Cl bond isomer 3 shows a higher vibrational frequency than the bridged Al-Br bond isomer 1 does. The same reason could be used to explain it due to the higher vibrational energy required to stretch the stronger Al-Cl bonds, leading to a higher vibrational frequency.
NB. mode 1-10 are all bent, therefore have even lower vibrational frequency.
Reference
- ↑ Peng, Bin; Li, Qian-Shu; Xie, Yaoming; Bruce King, R.; Schaefer, Henry F. III Chemical Physics, 2009 , vol. 356, p. 171 - 176;DOI:10.1016/j.chemphys.2008.10.050
- ↑ Reffy, Balazs; Kolonits, Maria; Hargittai, Magdolna Journal of Molecular Structure, 1998 , vol. 445, # 1-3 p. 139 - 148; DOI:10.1016/S0022-2860(97)00420-1
- ↑ Santiso-Quinnones, Gustavo; Krossing, Ingo Zeitschrift fuer Anorganische und Allgemeine Chemie, 2008 , vol. 634, p. 704 - 707; DOI:10.1002/zaac.200700510

