Rep:Mod:PTH115CMPMONTECARLO
CMP Compulsory Experiment: Monte Carlo Simulation
Introduction to the Ising Model
Task 1
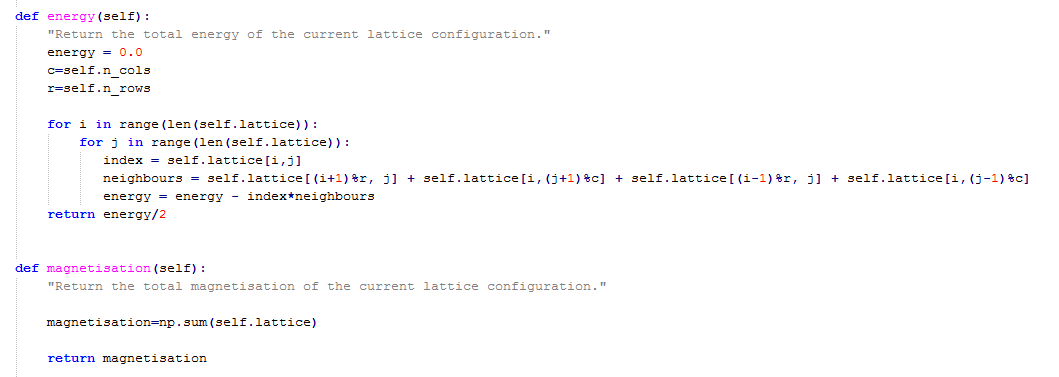
The total energy of an Ising model can be determined by considering the sum of the interaction energies between adjacent spins in the lattice, and is given by the following equation: [1]. The lowest possible energy in this model is found when all of the spins in the lattice are the same (i.e. either the case when all spins point up, or when they point all down). In that configuration, the product of two adjacent spins will always equal to 1 (1x1=1 or (-1)x(-1)=1). Therefore, all that needs to be considered in the groud state scenario is the number of interactions (NxD), not their magnitudes. The energy of the ground state of the model can hence be calculated by the equation [1].
Since there are two possible configurations for the ground state (all spins up or all spins down), the multiplicity of that state is equal to 2 (Ω = 2). The entropy of a system is given by the equation [2], so the entropy of the ground state is calculated to be 9.57x10⁻²⁴ J/K mol.
Task 2
The energy of the ground state a system where D = 3 and N =1000 is computed as E0 = - 3000J. However when a single spin is flipped, the energy of the system becomes E1 = 3x(-999 + 1) J = - 2994J, since in the new configuration there are 999 spins in one direction and 1 spin in the opposite direction, in 3 dimensions. Consequently, the change in energy due to the spin-flipping equates to ΔE = E1 - E0 = -2994J - (-3000J) = +6J.
As calculated above, the ground state has an entropy S0 = 9.57x10⁻²⁴ J/K mol. The system containing one flipped spin will have an entropy equal to S1 = 2100, so the change in entropy equals to ΔS = 2100 - 9.57x10-24 = 1.27x1030 J/K mol.
Task 3
The magnetisation of a lattice is given by . For the 1D lattice, there are 3 up-spins (si = +1) and 2 down-spins (si = -1), so the magnetisation is M = 3x(+1) + 2x(-1) = +1.
For the 2D lattice, there are 13 up-spins (si = +1) and 12 down-spins (si = -1), so the magnetisation is M = 13x(+1) + 12x(-1) = +1.
In the scenario of an Ising lattice with parameters D = 3 and N =1000, the magnetisation is either equal to M = +1000 or M = -1000.
Calculating the Energy and the Magnetisation
Task 4
Task 5
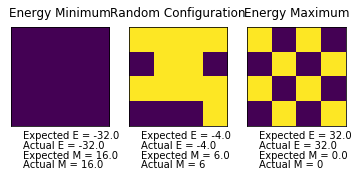
Evidently, the expected values agree with the actual values (see Fig. 2), so the Python code for the energy() and the magnetisation() functions as given in Task 4 works!
Introduction to the Monte Carlo Model
Task 6
A system with 100 spins will have a multiplicity of Ω = 2100. At a rate of analysis of 109 configurations per second, it would take the system about 1.27x10²¹ seconds to compute the average magnetisation. This is an equivalent of roughly 4x10¹³ years!
Task 7
Task 8
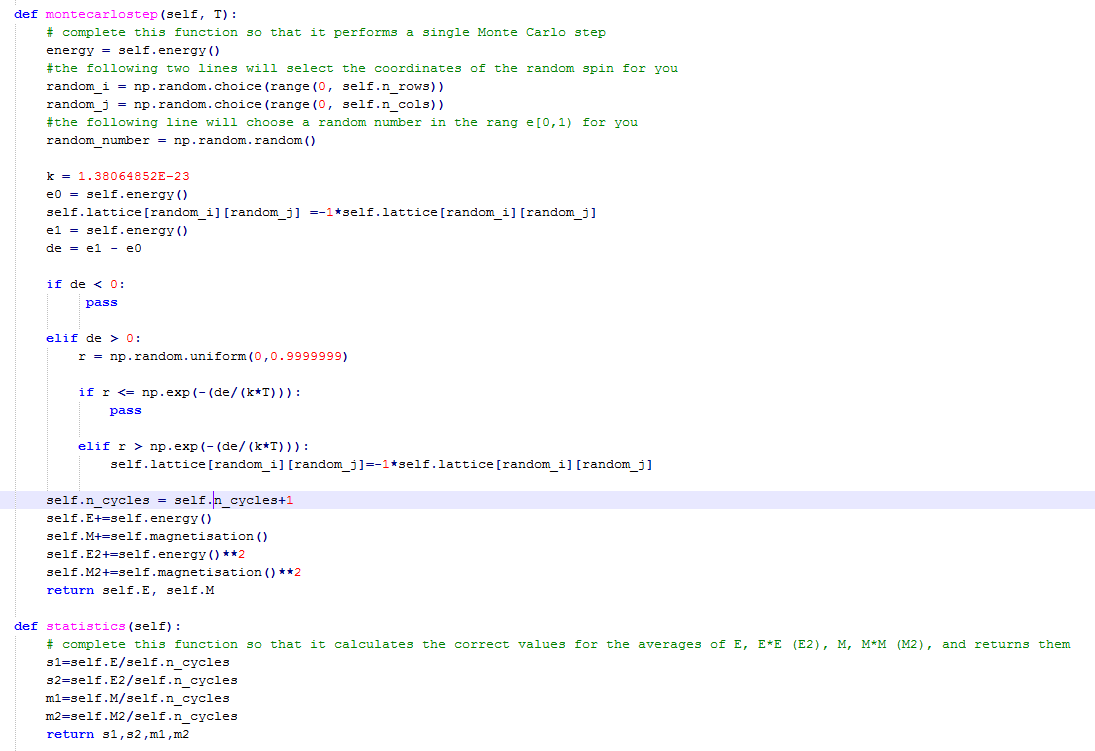
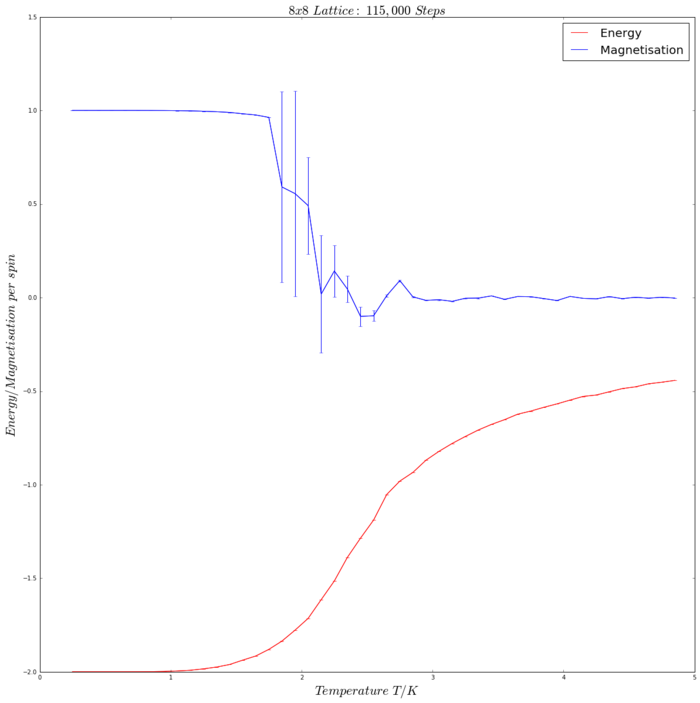
The Curie temperature, TC, is a critical temperature above which a ferromagnetic material (all its spins have parallel alignment) either becomes paramagnetic or completely loses its magnetic properties[3]. This is due to thermal excitement of the spins, which consequently lose their order. When below the Curie temperature (T<TC), it is expected that spontaneous magnetisation occurs. This is confirmed by the simulation (see Fig. 4), as when equilibrium is reached, the spins are ordered and they all point either up or down (indicating that <M> does not equal 0).


Accelerating the Code
Task 9
| Trial 1 | Trial 2 | Trial 3 | Trial 4 | Trial 5 | Mean ± Standard Error |
|---|---|---|---|---|---|
| 7.454561535266503 s | 7.582155388501434 s | 7.5489354727315 s | 7.614397590943327 s | 7.591419667523155 s | 7.558293933 s ± 0.12159129344 |
Task 10
For the magnetisation function, the code was not further modified, as the sum function was already implemented (see Python code above in Task 4).
The energy function, however, was modified as depicted in the Python code below:
def energy(self):
   energy = 0
   x1=np.roll(self.lattice,-1,axis=1)
   x=np.multiply(self.lattice,x1)
   y1=np.roll(self.lattice,-1,axis=0)
   y=np.multiply(self.lattice,y1)
   energy = (np.sum(x)+np.sum(y))*-1
return energy
Task 11
| Trial 1 | Trial 2 | Trial 3 | Trial 4 | Trial 5 | Mean ± Standard Error |
|---|---|---|---|---|---|
| 0.36104763954676794s | 0.3906630992717055s | 0.4049838996833728s | 0.376201180547298s | 0.370880877613331s | 0.3807553393249506s ± 0.03337396643527603 |
One can see how the code was accelerated by approximately 95%!
The Effect of Temperature
Task 12
The Python code below ignores a given number of initial steps, until equilibrium is reached.
def montecarlostep(self, T):
   # complete this function so that it performs a single Monte Carlo step
   #the following two lines will select the coordinates of the random spin for you
   random_i = np.random.choice(range(0, self.n_rows))
   random_j = np.random.choice(range(0, self.n_cols))
   #the following line will choose a random number in the rang e[0,1) for you

   e0 = self.energy()
   self.lattice[random_i,random_j] =-1*self.lattice[random_i,random_j]
   e1 = self.energy()
   de = e1 - e0

   if de < 0:
       self.lattice[random_i,random_j] =1*self.lattice[random_i,random_j]
       elif de > 0:
           r = np.random.random()
   if r <= math.exp(-(de/T)):
       self.lattice[random_i,random_j] =1*self.lattice[random_i,random_j]
       elif r > math.exp(-(de/(T))):
           self.lattice[random_i,random_j]=-1*self.lattice[random_i,random_j]
   self.n_cycles+= 1

   if self.n_cycles > #no. steps ignored:
       self.E+=self.energy()
       self.M+=self.magnetisation()
       self.E2+=self.energy()**2
       self.M2+=self.magnetisation()**2
   return self.energy(), self.magnetisation()
def statistics(self):
   s1=self.E/(self.n_cycles- #no. steps ignored)
   s2=self.E2/(self.n_cycles- #no. steps ignored)
   m1=self.M/(self.n_cycles- #no. steps ignored)
   m2=self.M2/(self.n_cycles- #no. steps ignored)
   return s1,s2,m1,m2,self.n_cycles
| 4x4 | 10x10 | 25x25 |
|---|---|---|
 |
 |
 |
| No. Steps to ignore: 40 | No. Steps to ignore: 1,000 | No. Steps to ignore: 100,000 |
| 30x30 | 50x50 |
|---|---|
 |
 |
| No. Steps to ignore: 110,000 | No. Steps to ignore: 200,000 |
From the data above, it is possible to deduce an approximate relationship between the dimensions of the lattice and the number of steps until equilibration occurs, whilst baring in mind that an overestimation is favoured over an underestimation. A suitable relation is: No. Steps until Equilibration ≈ NxNx250, where N = length/width of the lattice.
Task 13
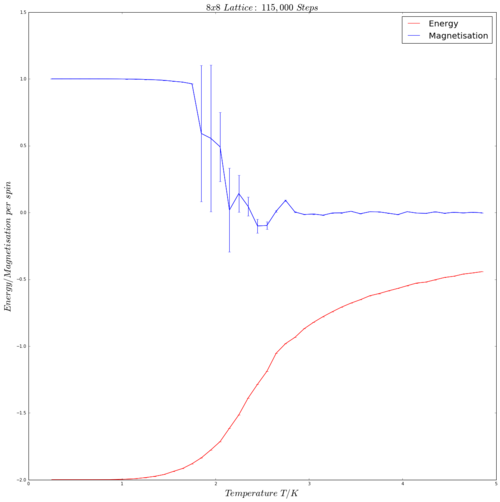
The Python code used to produce this graph is given and discussed extensively below in Task 14. The error bars on the plot represent the variance between the 5 repeat runs. A temperature range between 0.25 K and 4.95 K in increments of 0.1, corresponding to 47 temperature points. The number of steps needed for the system to equilibrate (i.e. the number of steps that can be ignored) was estimated using the logic discussed above (N=8, so No. Steps to equilibrium ≈16,000)
The Effect of System Size
Task 14
The Python code given here was written to produce Energy/Magnetisation per Spin against Temperature graphs for 2x2, 4x4, 8x8, 16x16 and 32x32 lattices. 5 repeat runs were performed for each lattice size.The code below is specific for the case of the 2x2 lattice and the same template of code was used for the larger lattice size. A temperature range between 0.25 K and 4.95 K in increments of 0.1, corresponding to 47 temperature points.
The number of initial steps ignored to reach equilibrium and the runtime for each lattice size is summarised the table below. The number of initial steps ignored was determined with the logic elaborated upon above in Task 12 (No. Steps until Equilibration ≈ NxNx250). The runtime was selected in such a way, so that the difference between the runtime and the no. initial steps ignored equals to roughly 100,000 net steps.
| Spin Lattice Size | 2x2 | 4x4 | 8x8 | 16x16 | 32x32 |
|---|---|---|---|---|---|
| No. initial steps ignored | 1,000 | 3,500 | 15,000 | 60,000 | 210,000 |
| Runtime | 100,000 | 105,000 | 115,000 | 160,000 | 310,000 |
import numpy as np
%pylab inline
#Importing data, where 'data21' is the data of the 1st repeat (out of 5 in total) of a 2x2 lattice:
data21=np.loadtxt('2x2_1.dat')
data22=np.loadtxt('2x2_2.dat')
data23=np.loadtxt('2x2_3.dat')
data24=np.loadtxt('2x2_4.dat')
data25=np.loadtxt('2x2_5.dat')
#Extracting Temperature values from data, 'T':
k=0
T=[]
for i in data21:
    T=T+[data21[k][0]]
    k=k+1
#Extracting the Energies per spin from data:
#'E21' is the list of all the energies per spin from the 1st repeat for a 2x2 lattice:
n=0
E21=[]
for i in data21:
    E21=E21+[data21[n][1]/4]
    n=n+1
m=0
E22=[]
for i in data22:
    E22=E22+[data22[m][1]/4]
    m=m+1
l=0
E23=[]
for i in data23:
    E23=E23+[data23[l][1]/4]
    l=l+1
p=0
E24=[]
for i in data24:
    E24=E24+[data24[p][1]/4]
    p=p+1
q=0
E25=[]
for i in data25:
    E25=E25+[data25[q][1]/4]
    q=q+1
#Creating a list with the mean energies per spin, 'dat1'
#'l1' is an array containing all of the energies per spin for all 5 repeats:
#'x1': mean value of all the 1st energy per spin terms across the 5 repeats
l1=np.array([E21,E22,E23,E24,E25])
x1=np.sum(l1[:,0])/5
x2=np.sum(l1[:,1])/5
x3=np.sum(l1[:,2])/5
x4=np.sum(l1[:,3])/5
x5=np.sum(l1[:,4])/5
x6=np.sum(l1[:,5])/5
x7=np.sum(l1[:,6])/5
x8=np.sum(l1[:,7])/5
x9=np.sum(l1[:,8])/5
x10=np.sum(l1[:,9])/5
x11=np.sum(l1[:,10])/5
x12=np.sum(l1[:,11])/5
x13=np.sum(l1[:,12])/5
x14=np.sum(l1[:,13])/5
x15=np.sum(l1[:,14])/5
x16=np.sum(l1[:,15])/5
x17=np.sum(l1[:,16])/5
x18=np.sum(l1[:,17])/5
x19=np.sum(l1[:,18])/5
x20=np.sum(l1[:,19])/5
x21=np.sum(l1[:,20])/5
x22=np.sum(l1[:,21])/5
x23=np.sum(l1[:,22])/5
x24=np.sum(l1[:,23])/5
x25=np.sum(l1[:,24])/5
x26=np.sum(l1[:,25])/5
x27=np.sum(l1[:,26])/5
x28=np.sum(l1[:,27])/5
x29=np.sum(l1[:,28])/5
x30=np.sum(l1[:,29])/5
x31=np.sum(l1[:,30])/5
x32=np.sum(l1[:,31])/5
x33=np.sum(l1[:,32])/5
x34=np.sum(l1[:,33])/5
x35=np.sum(l1[:,34])/5
x36=np.sum(l1[:,35])/5
x37=np.sum(l1[:,36])/5
x38=np.sum(l1[:,37])/5
x39=np.sum(l1[:,38])/5
x40=np.sum(l1[:,39])/5
x41=np.sum(l1[:,40])/5
x42=np.sum(l1[:,41])/5
x43=np.sum(l1[:,42])/5
x44=np.sum(l1[:,43])/5
x45=np.sum(l1[:,44])/5
x46=np.sum(l1[:,45])/5
x47=np.sum(l1[:,46])/5
dat1=[x1,x2,x3,x4,x5,x6,x7,x8,x9,x10,x11,x12,x13,x14,x15,x16,x17,x18,x19,x20,x21,x22,x23,x24,x25,x26,x27,x28,x29,x30,x31,x32,x33,x34,x35,x36,x37,x38,x39,x40,x41,x42,x43,x44,x45,x46,x47]
#Extracting magnetisation per spin from data:
#M21 is a list containing all of the magnetisations per spin of a 2x2 lattice, for the 1st repeat:
n=0
M21=[]
for i in data21:
    M21=M21+[data21[n][3]/4]
    n=n+1
m=0
M22=[]
for i in data21:
    M22=M22+[data22[m][3]/4]
    m=m+1
l=0
M23=[]
for i in data23:
    M23=M23+[data23[l][3]/4]
    l=l+1
p=0
M24=[]
for i in data24:
    M24=M24+[data24[p][3]/4]
    p=p+1
q=0
M25=[]
for i in data25:
    M25=M25+[data25[q][3]/4]
    q=q+1
#Creating a list with mean magnetisation per spin, 'dat2':
#'l2' is an array containing all of the magnetisations per spin for all 5 repeats:
#'m1': mean value of all the 1st magnetisation per spin terms across all 5 repeats
l2=np.array([M21,M22,M23,M24,M25])
m1=np.sum(l2[:,0])/5
m2=np.sum(l2[:,1])/5
m3=np.sum(l2[:,2])/5
m4=np.sum(l2[:,3])/5
m5=np.sum(l2[:,4])/5
m6=np.sum(l2[:,5])/5
m7=np.sum(l2[:,6])/5
m8=np.sum(l2[:,7])/5
m9=np.sum(l2[:,8])/5
m10=np.sum(l2[:,9])/5
m11=np.sum(l2[:,10])/5
m12=np.sum(l2[:,11])/5
m13=np.sum(l2[:,12])/5
m14=np.sum(l2[:,13])/5
m15=np.sum(l2[:,14])/5
m16=np.sum(l2[:,15])/5
m17=np.sum(l2[:,16])/5
m18=np.sum(l2[:,17])/5
m19=np.sum(l2[:,18])/5
m20=np.sum(l2[:,19])/5
m21=np.sum(l2[:,20])/5
m22=np.sum(l2[:,21])/5
m23=np.sum(l2[:,22])/5
m24=np.sum(l2[:,23])/5
m25=np.sum(l2[:,24])/5
m26=np.sum(l2[:,25])/5
m27=np.sum(l2[:,26])/5
m28=np.sum(l2[:,27])/5
m29=np.sum(l2[:,28])/5
m30=np.sum(l2[:,29])/5
m31=np.sum(l2[:,30])/5
m32=np.sum(l2[:,31])/5
m33=np.sum(l2[:,32])/5
m34=np.sum(l2[:,33])/5
m35=np.sum(l2[:,34])/5
m36=np.sum(l2[:,35])/5
m37=np.sum(l2[:,36])/5
m38=np.sum(l2[:,37])/5
m39=np.sum(l2[:,38])/5
m40=np.sum(l2[:,39])/5
m41=np.sum(l2[:,40])/5
m42=np.sum(l2[:,41])/5
m43=np.sum(l2[:,42])/5
m44=np.sum(l2[:,43])/5
m45=np.sum(l2[:,44])/5
m46=np.sum(l2[:,45])/5
m47=np.sum(l2[:,46])/5
dat2=[m1,m2,m3,m4,m5,m6,m7,m8,m9,m10,m11,m12,m13,m14,m15,m16,m17,m18,m19,m20,m21,m22,m23,m24,m25,m26,m27,m28,m29,m30,m31,m32,m33,m34,m35,m36,m37,m38,m39,m40,m41,m42,m43,m44,m45,m46,m47]
#Creating a list of variances for the energies per spin, 'var_E1':
#'y1': variance in energy per spin from mean energy per spin, of all 5 1st energy per spin terms
y1=(((-E21[0]+dat1[0])**2)+((-E22[0]--dat1[0])**2)+((-E23[0]--dat1[0])**2)+((-E24[0]--dat1[0])**2)+((-E25[0]--dat1[0])**2))/5
y2=(((-E21[1]+dat1[1])**2)+((-E22[1]--dat1[1])**2)+((-E23[1]--dat1[1])**2)+((-E24[1]--dat1[1])**2)+((-E25[1]--dat1[1])**2))/5
y3=(((-E21[2]+dat1[2])**2)+((-E22[2]--dat1[2])**2)+((-E23[2]--dat1[2])**2)+((-E24[2]--dat1[2])**2)+((-E25[2]--dat1[2])**2))/5
y4=(((-E21[3]+dat1[3])**2)+((-E22[3]--dat1[3])**2)+((-E23[3]--dat1[3])**2)+((-E24[3]--dat1[3])**2)+((-E25[3]--dat1[3])**2))/5
y5=(((-E21[4]+dat1[4])**2)+((-E22[4]--dat1[4])**2)+((-E23[4]--dat1[4])**2)+((-E24[4]--dat1[4])**2)+((-E25[4]--dat1[4])**2))/5
y6=(((-E21[5]+dat1[5])**2)+((-E22[5]--dat1[5])**2)+((-E23[5]--dat1[5])**2)+((-E24[5]--dat1[5])**2)+((-E25[5]--dat1[5])**2))/5
y7=(((-E21[6]+dat1[6])**2)+((-E22[6]--dat1[6])**2)+((-E23[6]--dat1[6])**2)+((-E24[6]--dat1[6])**2)+((-E25[6]--dat1[6])**2))/5
y8=(((-E21[7]+dat1[7])**2)+((-E22[7]--dat1[7])**2)+((-E23[7]--dat1[7])**2)+((-E24[7]--dat1[7])**2)+((-E25[7]--dat1[7])**2))/5
y9=(((-E21[8]+dat1[8])**2)+((-E22[8]--dat1[8])**2)+((-E23[8]--dat1[8])**2)+((-E24[8]--dat1[8])**2)+((-E25[8]--dat1[8])**2))/5
y10=(((-E21[9]+dat1[9])**2)+((-E22[9]--dat1[9])**2)+((-E23[9]--dat1[9])**2)+((-E24[9]--dat1[9])**2)+((-E25[9]--dat1[9])**2))/5
y11=(((-E21[10]+dat1[10])**2)+((-E22[10]--dat1[10])**2)+((-E23[10]--dat1[10])**2)+((-E24[10]--dat1[10])**2)+((-E25[10]-- dat1[10])**2))/5
y12=(((-E21[11]+dat1[11])**2)+((-E22[11]--dat1[11])**2)+((-E23[11]--dat1[11])**2)+((-E24[11]--dat1[11])**2)+((-E25[11]--dat1[11])**2))/5
y13=(((-E21[12]+dat1[12])**2)+((-E22[12]--dat1[12])**2)+((-E23[12]--dat1[12])**2)+((-E24[12]--dat1[12])**2)+((-E25[12]--dat1[12])**2))/5
y14=(((-E21[13]+dat1[13])**2)+((-E22[13]--dat1[13])**2)+((-E23[13]--dat1[13])**2)+((-E24[13]--dat1[13])**2)+((-E25[13]--dat1[13])**2))/5
y15=(((-E21[14]+dat1[14])**2)+((-E22[14]--dat1[14])**2)+((-E23[14]--dat1[14])**2)+((-E24[14]--dat1[14])**2)+((-E25[14]--dat1[14])**2))/5
y16=(((-E21[15]+dat1[15])**2)+((-E22[15]--dat1[15])**2)+((-E23[15]--dat1[15])**2)+((-E24[15]--dat1[15])**2)+((-E25[15]--dat1[15])**2))/5
y17=(((-E21[16]+dat1[16])**2)+((-E22[16]--dat1[16])**2)+((-E23[16]--dat1[16])**2)+((-E24[16]--dat1[16])**2)+((-E25[16]--dat1[16])**2))/5
y18=(((-E21[17]+dat1[17])**2)+((-E22[17]--dat1[17])**2)+((-E23[17]--dat1[17])**2)+((-E24[17]--dat1[17])**2)+((-E25[17]--dat1[17])**2))/5
y19=(((-E21[18]+dat1[18])**2)+((-E22[18]--dat1[18])**2)+((-E23[18]--dat1[18])**2)+((-E24[18]--dat1[18])**2)+((-E25[18]--dat1[18])**2))/5
y20=(((-E21[19]+dat1[19])**2)+((-E22[19]--dat1[19])**2)+((-E23[19]--dat1[19])**2)+((-E24[19]--dat1[19])**2)+((-E25[19]--dat1[19])**2))/5
y21=(((-E21[20]+dat1[20])**2)+((-E22[20]--dat1[20])**2)+((-E23[20]--dat1[20])**2)+((-E24[20]--dat1[20])**2)+((-E25[20]--dat1[20])**2))/5
y22=(((-E21[21]+dat1[21])**2)+((-E22[21]--dat1[21])**2)+((-E23[21]--dat1[21])**2)+((-E24[21]--dat1[21])**2)+((-E25[21]--dat1[21])**2))/5
y23=(((-E21[22]+dat1[22])**2)+((-E22[22]--dat1[22])**2)+((-E23[22]--dat1[22])**2)+((-E24[22]--dat1[22])**2)+((-E25[22]--dat1[22])**2))/5
y24=(((-E21[23]+dat1[23])**2)+((-E22[23]--dat1[23])**2)+((-E23[23]--dat1[23])**2)+((-E24[23]--dat1[23])**2)+((-E25[23]--dat1[23])**2))/5
y25=(((-E21[24]+dat1[24])**2)+((-E22[24]--dat1[24])**2)+((-E23[24]--dat1[24])**2)+((-E24[24]--dat1[24])**2)+((-E25[24]--dat1[24])**2))/5
y26=(((-E21[25]+dat1[25])**2)+((-E22[25]--dat1[25])**2)+((-E23[25]--dat1[25])**2)+((-E24[25]--dat1[25])**2)+((-E25[25]--dat1[25])**2))/5
y27=(((-E21[26]+dat1[26])**2)+((-E22[26]--dat1[26])**2)+((-E23[26]--dat1[26])**2)+((-E24[26]--dat1[26])**2)+((-E25[26]--dat1[26])**2))/5
y28=(((-E21[27]+dat1[27])**2)+((-E22[27]--dat1[27])**2)+((-E23[27]--dat1[27])**2)+((-E24[27]--dat1[27])**2)+((-E25[27]--dat1[27])**2))/5
y29=(((-E21[28]+dat1[28])**2)+((-E22[28]--dat1[28])**2)+((-E23[28]--dat1[28])**2)+((-E24[28]--dat1[28])**2)+((-E25[28]-- dat1[28])**2))/5
y30=(((-E21[29]+dat1[29])**2)+((-E22[29]--dat1[29])**2)+((-E23[29]--dat1[29])**2)+((-E24[29]--dat1[29])**2)+((-E25[29]--dat1[29])**2))/5
y31=(((-E21[30]+dat1[30])**2)+((-E22[30]--dat1[30])**2)+((-E23[30]--dat1[30])**2)+((-E24[30]--dat1[30])**2)+((-E25[30]--dat1[30])**2))/5
y32=(((-E21[31]+dat1[31])**2)+((-E22[31]--dat1[31])**2)+((-E23[31]--dat1[31])**2)+((-E24[31]--dat1[31])**2)+((-E25[31]--dat1[31])**2))/5
y33=(((-E21[32]+dat1[32])**2)+((-E22[32]--dat1[32])**2)+((-E23[32]--dat1[32])**2)+((-E24[32]--dat1[32])**2)+((-E25[32]--dat1[32])**2))/5
y34=(((-E21[33]+dat1[33])**2)+((-E22[33]--dat1[33])**2)+((-E23[33]--dat1[33])**2)+((-E24[33]--dat1[33])**2)+((-E25[33]--dat1[33])**2))/5
y35=(((-E21[34]+dat1[34])**2)+((-E22[34]--dat1[34])**2)+((-E23[34]--dat1[34])**2)+((-E24[34]--dat1[34])**2)+((-E25[34]--dat1[34])**2))/5
y36=(((-E21[35]+dat1[35])**2)+((-E22[35]--dat1[35])**2)+((-E23[35]--dat1[35])**2)+((-E24[35]--dat1[35])**2)+((-E25[35]--dat1[35])**2))/5
y37=(((-E21[36]+dat1[36])**2)+((-E22[36]--dat1[36])**2)+((-E23[36]--dat1[36])**2)+((-E24[36]--dat1[36])**2)+((-E25[36]--dat1[36])**2))/5
y38=(((-E21[37]+dat1[37])**2)+((-E22[37]--dat1[37])**2)+((-E23[37]--dat1[37])**2)+((-E24[37]--dat1[37])**2)+((-E25[37]--dat1[37])**2))/5
y39=(((-E21[38]+dat1[38])**2)+((-E22[38]--dat1[38])**2)+((-E23[38]--dat1[38])**2)+((-E24[38]--dat1[38])**2)+((-E25[38]--dat1[38])**2))/5
y40=(((-E21[39]+dat1[39])**2)+((-E22[39]--dat1[39])**2)+((-E23[39]--dat1[39])**2)+((-E24[39]--dat1[39])**2)+((-E25[39]--dat1[39])**2))/5
y41=(((-E21[40]+dat1[40])**2)+((-E22[40]--dat1[40])**2)+((-E23[40]--dat1[40])**2)+((-E24[40]--dat1[40])**2)+((-E25[40]--dat1[40])**2))/5
y42=(((-E21[41]+dat1[41])**2)+((-E22[41]--dat1[41])**2)+((-E23[41]--dat1[41])**2)+((-E24[41]--dat1[41])**2)+((-E25[41]--dat1[41])**2))/5
y43=(((-E21[42]+dat1[42])**2)+((-E22[42]--dat1[42])**2)+((-E23[42]--dat1[42])**2)+((-E24[42]--dat1[42])**2)+((-E25[42]--dat1[42])**2))/5
y44=(((-E21[43]+dat1[43])**2)+((-E22[43]--dat1[43])**2)+((-E23[43]--dat1[43])**2)+((-E24[43]--dat1[43])**2)+((-E25[43]--dat1[43])**2))/5
y45=(((-E21[44]+dat1[44])**2)+((-E22[44]--dat1[44])**2)+((-E23[44]--dat1[44])**2)+((-E24[44]--dat1[44])**2)+((-E25[44]--dat1[44])**2))/5
y46=(((-E21[45]+dat1[45])**2)+((-E22[45]--dat1[45])**2)+((-E23[45]--dat1[45])**2)+((-E24[45]--dat1[45])**2)+((-E25[45]--dat1[45])**2))/5
y47=(((-E21[46]+dat1[46])**2)+((-E22[46]--dat1[46])**2)+((-E23[46]--dat1[46])**2)+((-E24[46]--dat1[46])**2)+((-E25[46]--dat1[46])**2))/5
var_E1=[y1,y2,y3,y4,y5,y6,y7,y8,y9,y10,y11,y12,y13,y14,y15,y16,y17,y18,y19,y20,y21,y22,y23,y24,y25,y26,y27,y28,y29,y30,y31,y32,y33,y34,y35,y36,y37,y38,y39,y40,y41,y42,y43,y44,y45,y46,y47]
#Creating a list with variances of magnetisation per spin, 'var_M1':
#'z1': variance in magnetisation per spin from mean magnetisation per spin, of all 5 1st magnetisation per spin terms
z1=(((M21[0]-dat2[0])**2)+((M22[0]-dat2[0])**2)+((M23[0]-dat2[0])**2)+((M24[0]-dat2[0])**2)+((M25[0]-dat2[0])**2))/5
z2=(((M21[1]-dat2[1])**2)+((M22[1]-dat2[1])**2)+((M23[1]-dat2[1])**2)+((M24[1]-dat2[1])**2)+((M25[1]-dat2[1])**2))/5
z3=(((M21[2]-dat2[2])**2)+((M22[2]-dat2[2])**2)+((M23[2]-dat2[2])**2)+((M24[2]-dat2[2])**2)+((M25[2]-dat2[2])**2))/5
z4=(((M21[3]-dat2[3])**2)+((M22[3]-dat2[3])**2)+((M23[3]-dat2[3])**2)+((M24[3]-dat2[3])**2)+((M25[3]-dat2[3])**2))/5
z5=(((M21[4]-dat2[4])**2)+((M22[4]-dat2[4])**2)+((M23[4]-dat2[4])**2)+((M24[4]-dat2[4])**2)+((M25[4]-dat2[4])**2))/5
z6=(((M21[5]-dat2[5])**2)+((M22[5]-dat2[5])**2)+((M23[5]-dat2[5])**2)+((M24[5]-dat2[5])**2)+((M25[5]-dat2[5])**2))/5
z7=(((M21[6]-dat2[6])**2)+((M22[6]-dat2[6])**2)+((M23[6]-dat2[6])**2)+((M24[6]-dat2[6])**2)+((M25[6]-dat2[6])**2))/5
z8=(((M21[7]-dat2[7])**2)+((M22[7]-dat2[7])**2)+((M23[7]-dat2[7])**2)+((M24[7]-dat2[7])**2)+((M25[7]-dat2[7])**2))/5
z9=(((M21[8]-dat2[8])**2)+((M22[8]-dat2[8])**2)+((M23[8]-dat2[8])**2)+((M24[8]-dat2[8])**2)+((M25[8]-dat2[8])**2))/5
z10=(((M21[9]-dat2[9])**2)+((M22[9]-dat2[9])**2)+((M23[9]-dat2[9])**2)+((M24[9]-dat2[9])**2)+((M25[9]-dat2[9])**2))/5
z11=(((M21[10]-dat2[10])**2)+((M22[10]-dat2[10])**2)+((M23[10]-dat2[10])**2)+((M24[10]-dat2[10])**2)+((M25[10]-dat2[10])**2))/5
z12=(((M21[11]-dat2[11])**2)+((M22[11]-dat2[11])**2)+((M23[11]-dat2[11])**2)+((M24[11]-dat2[11])**2)+((M25[11]-dat2[11])**2))/5
z13=(((M21[12]-dat2[12])**2)+((M22[12]-dat2[12])**2)+((M23[12]-dat2[12])**2)+((M24[12]-dat2[12])**2)+((M25[12]-dat2[12])**2))/5
z14=(((M21[13]-dat2[13])**2)+((M22[13]-dat2[13])**2)+((M23[13]-dat2[13])**2)+((M24[13]-dat2[13])**2)+((M25[13]-dat2[13])**2))/5
z15=(((M21[14]-dat2[14])**2)+((M22[14]-dat2[14])**2)+((M23[14]-dat2[14])**2)+((M24[14]-dat2[14])**2)+((M25[14]-dat2[14])**2))/5
z16=(((M21[15]-dat2[15])**2)+((M22[15]-dat2[15])**2)+((M23[15]-dat2[15])**2)+((M24[15]-dat2[15])**2)+((M25[15]-dat2[15])**2))/5
z17=(((M21[16]-dat2[16])**2)+((M22[16]-dat2[16])**2)+((M23[16]-dat2[16])**2)+((M24[16]-dat2[16])**2)+((M25[16]-dat2[16])**2))/5
z18=(((M21[17]-dat2[17])**2)+((M22[17]-dat2[17])**2)+((M23[17]-dat2[17])**2)+((M24[17]-dat2[17])**2)+((M25[17]-dat2[17])**2))/5
z19=(((M21[18]-dat2[18])**2)+((M22[18]-dat2[18])**2)+((M23[18]-dat2[18])**2)+((M24[18]-dat2[18])**2)+((M25[18]-dat2[18])**2))/5
z20=(((M21[19]-dat2[19])**2)+((M22[19]-dat2[19])**2)+((M23[19]-dat2[19])**2)+((M24[19]-dat2[19])**2)+((M25[19]-dat2[19])**2))/5
z21=(((M21[20]-dat2[20])**2)+((M22[20]-dat2[20])**2)+((M23[20]-dat2[20])**2)+((M24[20]-dat2[20])**2)+((M25[20]-dat2[20])**2))/5
z22=(((M21[21]-dat2[21])**2)+((M22[21]-dat2[21])**2)+((M23[21]-dat2[21])**2)+((M24[21]-dat2[21])**2)+((M25[21]-dat2[21])**2))/5
z23=(((M21[22]-dat2[22])**2)+((M22[22]-dat2[22])**2)+((M23[22]-dat2[22])**2)+((M24[22]-dat2[22])**2)+((M25[22]-dat2[22])**2))/5
z24=(((M21[23]-dat2[23])**2)+((M22[23]-dat2[23])**2)+((M23[23]-dat2[23])**2)+((M24[23]-dat2[23])**2)+((M25[23]-dat2[23])**2))/5
z25=(((M21[24]-dat2[24])**2)+((M22[24]-dat2[24])**2)+((M23[24]-dat2[24])**2)+((M24[24]-dat2[24])**2)+((M25[24]-dat2[24])**2))/5
z26=(((M21[25]-dat2[25])**2)+((M22[25]-dat2[25])**2)+((M23[25]-dat2[25])**2)+((M24[25]-dat2[25])**2)+((M25[25]-dat2[25])**2))/5
z27=(((M21[26]-dat2[26])**2)+((M22[26]-dat2[26])**2)+((M23[26]-dat2[26])**2)+((M24[26]-dat2[26])**2)+((M25[26]-dat2[26])**2))/5
z28=(((M21[27]-dat2[27])**2)+((M22[27]-dat2[27])**2)+((M23[27]-dat2[27])**2)+((M24[27]-dat2[27])**2)+((M25[27]-dat2[27])**2))/5
z29=(((M21[28]-dat2[28])**2)+((M22[28]-dat2[28])**2)+((M23[28]-dat2[28])**2)+((M24[28]-dat2[28])**2)+((M25[28]-dat2[28])**2))/5
z30=(((M21[29]-dat2[29])**2)+((M22[29]-dat2[29])**2)+((M23[29]-dat2[29])**2)+((M24[29]-dat2[29])**2)+((M25[29]-dat2[29])**2))/5
z31=(((M21[30]-dat2[30])**2)+((M22[30]-dat2[30])**2)+((M23[30]-dat2[30])**2)+((M24[30]-dat2[30])**2)+((M25[30]-dat2[30])**2))/5
z32=(((M21[31]-dat2[31])**2)+((M22[31]-dat2[31])**2)+((M23[31]-dat2[31])**2)+((M24[31]-dat2[31])**2)+((M25[31]-dat2[31])**2))/5
z33=(((M21[32]-dat2[32])**2)+((M22[32]-dat2[32])**2)+((M23[32]-dat2[32])**2)+((M24[32]-dat2[32])**2)+((M25[32]-dat2[32])**2))/5
z34=(((M21[33]-dat2[33])**2)+((M22[33]-dat2[33])**2)+((M23[33]-dat2[33])**2)+((M24[33]-dat2[33])**2)+((M25[33]-dat2[33])**2))/5
z35=(((M21[34]-dat2[34])**2)+((M22[34]-dat2[34])**2)+((M23[34]-dat2[34])**2)+((M24[34]-dat2[34])**2)+((M25[34]-dat2[34])**2))/5
z36=(((M21[35]-dat2[35])**2)+((M22[35]-dat2[35])**2)+((M23[35]-dat2[35])**2)+((M24[35]-dat2[35])**2)+((M25[35]-dat2[35])**2))/5
z37=(((M21[36]-dat2[36])**2)+((M22[36]-dat2[36])**2)+((M23[36]-dat2[36])**2)+((M24[36]-dat2[36])**2)+((M25[36]-dat2[36])**2))/5
z38=(((M21[37]-dat2[37])**2)+((M22[37]-dat2[37])**2)+((M23[37]-dat2[37])**2)+((M24[37]-dat2[37])**2)+((M25[37]-dat2[37])**2))/5
z39=(((M21[38]-dat2[38])**2)+((M22[38]-dat2[38])**2)+((M23[38]-dat2[38])**2)+((M24[38]-dat2[38])**2)+((M25[38]-dat2[38])**2))/5
z40=(((M21[39]-dat2[39])**2)+((M22[39]-dat2[39])**2)+((M23[39]-dat2[39])**2)+((M24[39]-dat2[39])**2)+((M25[39]-dat2[39])**2))/5
z41=(((M21[40]-dat2[40])**2)+((M22[40]-dat2[40])**2)+((M23[40]-dat2[40])**2)+((M24[40]-dat2[40])**2)+((M25[40]-dat2[40])**2))/5
z42=(((M21[41]-dat2[41])**2)+((M22[41]-dat2[41])**2)+((M23[41]-dat2[41])**2)+((M24[41]-dat2[41])**2)+((M25[41]-dat2[41])**2))/5
z43=(((M21[42]-dat2[42])**2)+((M22[42]-dat2[42])**2)+((M23[42]-dat2[42])**2)+((M24[42]-dat2[42])**2)+((M25[42]-dat2[42])**2))/5
z44=(((M21[43]-dat2[43])**2)+((M22[43]-dat2[43])**2)+((M23[43]-dat2[43])**2)+((M24[43]-dat2[43])**2)+((M25[43]-dat2[43])**2))/5
z45=(((M21[44]-dat2[44])**2)+((M22[44]-dat2[44])**2)+((M23[44]-dat2[44])**2)+((M24[44]-dat2[44])**2)+((M25[44]-dat2[44])**2))/5
z46=(((M21[45]-dat2[45])**2)+((M22[45]-dat2[45])**2)+((M23[45]-dat2[45])**2)+((M24[45]-dat2[45])**2)+((M25[45]-dat2[45])**2))/5
z47=(((M21[46]-dat2[46])**2)+((M22[46]-dat2[46])**2)+((M23[46]-dat2[46])**2)+((M24[46]-dat2[46])**2)+((M25[46]-dat2[46])**2))/5
var_M1=[z1,z2,z3,z4,z5,z6,z7,z8,z9,z10,z11,z12,z13,z14,z15,z16,z17,z18,z19,z20,z21,z22,z23,z24,z25,z26,z27,z28,z29,z30,z31,z32,z33,z34,z35,z36,z37,z38,z39,z40,z41,z42,z43,z44,z45,z46,z47]
#Plotting a graph Energy/Magnetisation per spin against Temperature:
figure(figsize(20,20))
plot(T,dat1,label='Energy',color='red')
plot(T,dat2,label='Magnetisation',color='blue')
title('$2x2$ $Lattice:$ $4,000$ $Steps$',fontsize=22)
xlabel('$Temperature$ $T/K$',fontsize=22)
ylabel('$Energy/Magnetisation$ $per$ $spin$',fontsize=22)
errorbar(T,dat1,yerr=var_E1,color='red')
errorbar(T,dat2,yerr=var_M1,color='blue')
legend(loc=1,fontsize='20')
show()
| 2x2 | 4x4 |
|---|---|
 |
 |
| 8x8 | 16x16 |
|---|---|
 |
 |
| 32x32 |
|---|
 |
The error bars in the above shown graphs represent the variance about the mean energy/magnetisation per spin with respect to the 5 repeats (i.e. how much the data from the 5 runs of the energy/magnetisation per spin at a temperature point varies from the mean energy/magnetisation per spin at that temperature). As one can see, the variance error bars on the energy per spin curves are negligibly small, indicating very little, if any, difference between the energy per spin data across all 5 repeats. The magnetisation per spin curves posses large variances solely at points with steep changes in magnetisation, so the large error bars at temperatures are expected.
However, it is also possible to plot error bars that illustrate the variance in energy/magnetisation per spin within the entire system. To calculate the intrinsic variance at each point and plot its error bars, one has to obtain values for the mean squared energy, <E2>, and the squared mean energy <E>2.From these two quantities, one can compute the variance within the system by using the statistical equation Var(X)=<X2>-<X>2. To achieve this, one cam add the following lines of Python code to the code shown above:
#Extracting energies squared, 'E2', from data:
#'Esq1': List of all square energy terms for the 1st repeat run:
Esq1=data21[:,2]
Esq2=data22[:,2]
Esq3=data23[:,2]
Esq4=data24[:,2]
Esq5=data25[:,2]
#Extracting energies per spin,'E', from data:
#'E1': List of all energies for the 1st repeat run:
E1=data21[:,1]
E2=data22[:,1]
E3=data23[:,1]
E4=data24[:,1]
E5=data25[:,1]
#Creating arrays of the variance of the energies per spin, Var(E), by using the equation Var(E) = <E2> - <E>2:
var_E1=(np.array(Esq1)-np.array(E1)**2)/256
var_E2=(np.array(Esq2)-np.array(E2)**2)/256
var_E3=(np.array(Esq3)-np.array(E3)**2)/256
var_E4=(np.array(Esq4)-np.array(E4)**2)/256
var_E5=(np.array(Esq5)-np.array(E5)**2)/256
#Calculating the mean variance of the energies per spin for all 5 repeat runs:
Var_E=(var_E1+var_E2+var_E3+var_E4+var_E5)/5
#Extracting magnetisms squared, 'M2', from data:
#'Msq1': List of all square magnetism terms for the 1st repeat run:
Msq1=data21[:,3]
Msq2=data22[:,3]
Msq3=data23[:,3]
Msq4=data24[:,3]
Msq5=data25[:,3]
#Extracting magnetisms per spin,'M', from data:
#'M1': List of all magnetisms for the 1st repeat run:
M1=data21[:,3]
M2=data22[:,3]
M3=data23[:,3]
M4=data24[:,3]
M5=data25[:,3]
#Creating arrays of the variance of the magnetisms per spin, Var(M), by using the equation Var(M) = <M2> - <M>2:
var_M1=(np.array(Msq1)-np.array(M1)**2)/256
var_M2=(np.array(Msq2)-np.array(M2)**2)/256
var_M3=(np.array(Msq3)-np.array(M3)**2)/256
var_M4=(np.array(Msq4)-np.array(M4)**2)/256
var_M5=(np.array(Msq5)-np.array(M5)**2)/256
#Calculating the mean variance of the magnestisms per spin for all 5 repeat runs:
Var_M=(var_M1+var_M2+var_M3+var_M4+var_M5)/5
| 2x2 | 4x4 |
|---|---|
 |
 |
| 8x8 | 16x16 |
|---|---|
 |
 |
| 32x32 |
|---|
 |
From the graphs above, several trends are visible. Firstly, that magnetisation per spin decreases to almost 0 as the temperature increases, whilst the energy per spin increases. This can be rationalised by considering the Curie temperature and how magnetisation is affected by temperature, as discussed in Task 8 above. The magnetisation decrease with rising temperature, as the spins in the ferromagnetic structure gain thermal energy and lose their order. Logically, due to thermal excitation and an increased number of spin-spin interactions (as described in Task 1), the energy per spin increases with rising temperature.
Secondly, a 'hump' is visible in each of the curves, an increasing one for the energy and a decreasing one for the magnetisation. This 'hump', as expected, occurs at the Curie temperature, the point above which the material's magnetic properties alter and decrease. The shape of the 'hump' becomes more defined with increasing number of spins in the lattice. This is most likely due to a cumulative effect, as there are simply more spins in the lattice that can lose magnetisation and gain energy, leading to the whole system possessing more energy and/or magnetisation, and consequently leads to a greater loss of magnetisation per spin and greater gain in energy per spin at the critical temperature.
Further, the magnetisation variance error bars diminish at higher temperatures/temperatures close to the Curie point, whilst the energy variance error bars starkly increase in size.
Determining the Heat Capacity
Task 15[4][2]
The partition function of a system, q, is given by the following equation: , where Ej represents the energy of a particular microstate. By knowing the partition function, one is able to calculate the average energy, <E>, of the system:
One can simplify the equation by recognising that the relationship between the numerator and the denominator of the fraction is the derivative of the latter term (which is equal to the partition function) with respect to 1/kT. This term can be represented by the letter β: , so .
By realizing that , the expression for the average energy can be re-written as .
Next, we remind ourselves that the definition of the heat capacity, C, at constant volume and number of particles is given by and that the variance of the energy, Var(E), is calculated as .
The derivative with respect to β, d/dβ, may be written in terms of the Boltzmann constant, k, and the temperature, T: .
By substituting in the equations for the heat capacity and for d/dβ into the expression for Var(E), one arrives at the conclusion that .
Hence: .
Task 16
A Python code was written to generate Heat Capacity against Temperature graphs for spin lattices of sizes 2x2, 4x4, 8x8, 16x16 and 32x32. As before, the code presented here is specific for the 2x2 lattice and the code template was used on the larger spin lattices.
import numpy as np
import matplotlib.pyplot as plt
%pylab inline
#Importing data:
#'data1' list contains all the data from the 1st repeat run (out of 5 in total):
data1=np.loadtxt('2x2_1.dat')
data2=np.loadtxt('2x2_2.dat')
data3=np.loadtxt('2x2_3.dat')
data4=np.loadtxt('2x2_4.dat')
data5=np.loadtxt('2x2_5.dat')
#Extracting Temperature values,'T', from data:
T=np.array(data1[:,0])
T_2=T**2
#Extracting energies squared, 'E2', from data:
#'Esq1': List of all square energy terms for the 1st repeat run:
Esq1=data1[:,2]
Esq2=data2[:,2]
Esq3=data3[:,2]
Esq4=data4[:,2]
Esq5=data5[:,2]
#Extracting energies per spin,'E', from data:
#'E1': List of all energies for the 1st repeat run:
E1=data1[:,1]
E2=data2[:,1]
E3=data3[:,1]
E4=data4[:,1]
E5=data5[:,1]
#Creating arrays of the variance of the energies per spin, Var(E), by using the equation Var(E) = <E2> - <E>2:
var_E1=(np.array(Esq1)-np.array(E1)**2)/4
var_E2=(np.array(Esq2)-np.array(E2)**2)/4
var_E3=(np.array(Esq3)-np.array(E3)**2)/4
var_E4=(np.array(Esq4)-np.array(E4)**2)/4
var_E5=(np.array(Esq5)-np.array(E5)**2)/4
#Calculating the mean variance of the energies per spin for all 5 repeat runs:
Var_E=(var_E1+var_E2+var_E3+var_E4+var_E5)/5
#Creating a list of Heat Capacities, 'C', using C=Var(E)/kT2 and a list containing all Temperatures, 'T':
k=1.38065e-23
C=Var_E/(k*T_2)
#Plotting a graph of Heat Capacity against Temperature:
figure(figsize(20,20))
plot(T,C,color='red')
title('$Heat$ $Capacity$ $against$ $Temperature:$ $2x2$ $Lattice$',fontsize=22)
xlabel('$Temperature$ $T/K$',fontsize=22)
ylabel('$Heat$ $Capacity$ $C/JK-1$',fontsize=22)
show()
| 2x2 | 4x4 |
|---|---|
 |
 |
| 8x8 | 16x16 |
|---|---|
 |
 |
| 32x32 |
|---|
 |
Locating the Curie Temperature
Task 17
The Python code presented here extracts data from the C++ files, as well as the Python simulation experiments. The data for energy, magnetisation and heat capacity per spin is plotted against temperature from both sources of data (for 2x2, 4x4, 8x8, 16x16 and 32x32 spin lattice sizes).
#From C++_Data file:
cpp2=np.loadtxt('2x2.dat')
cpp4=np.loadtxt('4x4.dat')
cpp8=np.loadtxt('8x8.dat')
cpp16=np.loadtxt('16x16.dat')
cpp32=np.loadtxt('32x32.dat')
Tpp=np.array(cpp2[:,0])
#Experimental Python data:
dat2=np.loadtxt('2x2_1.dat')
dat4=np.loadtxt('4x4_1.dat')
dat8=np.loadtxt('8x8_1.dat')
dat16=np.loadtxt('16x16_1.dat')
dat32=np.loadtxt('32x32_1.dat')
T=np.array(dat2[:,0])
#Heat Capacities from experimental Python data:
c2=((np.array(dat2[:,2])-(np.array(dat2[:,1])**2))/4)/T**2
c4=((np.array(dat4[:,2])-(np.array(dat2[:,1])**2))/16)/T**2
c8=((np.array(dat8[:,2])-(np.array(dat8[:,1])**2))/64)/T**2
c16=((np.array(dat16[:,2])-(np.array(dat16[:,1])**2))/256)/T**2
c32=((np.array(dat32[:,2])-(np.array(dat32[:,1])**2))/1024)/T**2

#Energy from experimental Python data:
e2=dat2[:,1]/4
e4=dat4[:,1]/16
e8=dat8[:,1]/64
e16=dat16[:,1]/256
e32=dat32[:,1]/1024
#Magnetism from experimental Python data:
m2=dat2[:,3]/4
m4=dat4[:,3]/16
m8=dat8[:,3]/64
m16=dat16[:,3]/256
m32=dat32[:,3]/1024
#Heat Capacities from C++ data:
cp2=cpp2[:,5]
cp4=cpp4[:,5]
cp8=cpp8[:,5]
cp16=cpp16[:,5]
cp32=cpp32[:,5]
#Energy from C++ data:
ep2=cpp2[:,1]
ep4=cpp4[:,1]
ep8=cpp8[:,1]
ep16=cpp16[:,1]
ep32=cpp32[:,1]

#Magnetism from C++ data:
mp2=cpp2[:,3]
mp4=cpp4[:,3]
mp8=cpp8[:,3]
mp16=cpp16[:,3]
mp32=cpp32[:,3]
#2x2 Lattice Graphs:
figure(figsize(20,20))
plot(T,c2,color='blue',linestyle='-',label='Pyhton')
plot(Tpp,cp2, linestyle='--', color='red', label='C++')
title('$C++$ $vs$ $Python:$ $2x2$ $Heat$ $Capacity$',fontsize=22)
xlabel('$Temperature$ $T/K$',fontsize=22)
ylabel('$Heat$ $Capacity$ $C/JK-1$',fontsize=22)
legend(loc=1,fontsize='20')
show()
figure(figsize(20,20))
plot(T,e2,color='blue',linestyle='-',label='Python')
plot(Tpp,ep2, linestyle='--',marker=, color='red', label='C++')
title('$C++$ $vs$ $Python:$ $2x2$ $Energy$',fontsize=22)
xlabel('$Temperature$ $T/K$',fontsize=22)
ylabel('$Energy$',fontsize=22)
legend(loc=1,fontsize='20')
show()
figure(figsize(20,20))
plot(T,m2,color='blue',linestyle='-',label='Python')
plot(Tpp,mp2, linestyle='--',marker=, color='red', label='C++')
title('$C++$ $vs$ $Python:$ $2x2$ $Magnetisation$',fontsize=22)
xlabel('$Temperature$ $T/K$',fontsize=22)
ylabel('$Magnetisation$',fontsize=22)
legend(loc=1,fontsize='20')
show()
#4x4 Lattice Graphs
figure(figsize(20,20))
plot(T,c4,color='blue',linestyle='-',label='Python')
plot(Tpp,cp4, linestyle='--',marker=, color='red', label='C++')
title('$C++$ $vs$ $Python:$ $4x4$ $Heat Capacity$',fontsize=22)
xlabel('$Temperature$ $T/K$',fontsize=22)
ylabel('$Heat$ $Capacity$ $C/JK-1$',fontsize=22)
legend(loc=1,fontsize='20')
show()
figure(figsize(20,20))
plot(T,e4,color='blue',linestyle='-',label='Python')
plot(Tpp,ep4, linestyle='--',marker=, color='red', label='C++')
title('$C++$ $vs$ $Python:$ $4x4$ $Energy$',fontsize=22)
xlabel('$Temperature$ $T/K$',fontsize=22)
ylabel('$Energy$',fontsize=22)
legend(loc=1,fontsize='20')
show()
figure(figsize(20,20))
plot(T,m4,color='blue',linestyle='-',label='Python')
plot(Tpp,mp4, linestyle='--',marker=, color='red', label='C++')
title('$C++$ $vs$ $Python:$ $4x4$',fontsize=22)
xlabel('$Temperature$ $T/K$',fontsize=22)
ylabel('$Magnetisation$',fontsize=22)
legend(loc=1,fontsize='20')
show()
#8x8 Lattice Graphs
figure(figsize(20,20))
plot(T,c8,color='blue',linestyle='-',label='Python')
plot(Tpp,cp8, linestyle='--',marker=, color='red', label='C++')
title('$C++$ $vs$ $Python:$ $8x8$ $Heat$ $Capacity$',fontsize=22)
xlabel('$Temperature$ $T/K$',fontsize=22)
ylabel('$Heat$ $Capacity$ $C/JK-1$',fontsize=22)
legend(loc=1,fontsize='20')
show()
figure(figsize(20,20))
plot(T,e8,color='blue',linestyle='-',label='Python')
plot(Tpp,ep8, linestyle='--',marker=, color='red', label='C++')
title('$C++$ $vs$ $Python:$ $8x8$ $Energy$',fontsize=22)
xlabel('$Temperature$ $T/K$',fontsize=22)
ylabel('$Energy$',fontsize=22)
legend(loc=1,fontsize='20')
show()
figure(figsize(20,20))
plot(T,m8,color='blue',linestyle='-',label='Python')
plot(Tpp,mp8, linestyle='--',marker=, color='red', label='C++')
title('$C++$ $vs$ $Python:$ $8x8$',fontsize=22)
xlabel('$Temperature$ $T/K$',fontsize=22)
ylabel('$Magnetisation$',fontsize=22)
legend(loc=1,fontsize='20')
show()
#16x16 Lattice Graphs
figure(figsize(20,20))
plot(T,c16,color='blue',linestyle='-',label='Python')
plot(Tpp,cp16, linestyle='-',marker=, color='red', label='C++')
title('$C++$ $vs$ $Python:$ $16x16$ $Heat$ $Capacity$',fontsize=22)
xlabel('$Temperature$ $T/K$',fontsize=22)
ylabel('$Heat$ $Capacity$ $C/JK-1$',fontsize=22)
legend(loc=1,fontsize='20')
show()
figure(figsize(20,20))
plot(T,e16,color='blue',linestyle='-',label='Python')
plot(Tpp,ep16, linestyle='--',marker=, color='red', label='C++')
title('$C++$ $vs$ $Python:$ $16x16$ $Energy$',fontsize=22)
xlabel('$Temperature$ $T/K$',fontsize=22)
ylabel('$Energy$',fontsize=22)
legend(loc=1,fontsize='20')
show()
figure(figsize(20,20))
plot(T,m16,color='blue',linestyle='-',label='Python')
plot(Tpp,mp16, linestyle='--',marker=, color='red', label='C++')
title('$C++$ $vs$ $Python:$ $16x16$',fontsize=22)
xlabel('$Temperature$ $T/K$',fontsize=22)
ylabel('$Magnetisation$',fontsize=22)
legend(loc=1,fontsize='20')
show()
#32x32 Lattice Graphs
figure(figsize(20,20))
plot(T,c32,color='blue',linestyle='-',label='Python')
plot(Tpp,cp32, linestyle='--',marker=, color='red', label='C++')
title('$C++$ $vs$ $Python:$ $32x32$ $Heat$ $Capacity$',fontsize=22)
xlabel('$Temperature$ $T/K$',fontsize=22)
ylabel('$Heat$ $Capacity$ $C/JK-1$',fontsize=22)
legend(loc=1,fontsize='20')
show()

figure(figsize(20,20))
plot(T,e32,color='blue',linestyle='-',label='Python')
plot(Tpp,ep32, linestyle='--',marker=, color='red', label='C++')
title('$C++$ $vs$ $Python:$ $32x32$ $Energy$',fontsize=22)
xlabel('$Temperature$ $T/K$',fontsize=22)
ylabel('$Energy$',fontsize=22)
legend(loc=1,fontsize='20')
show()
figure(figsize(20,20))
plot(T,m32,color='blue',linestyle='-',label='Python')
plot(Tpp,mp32, linestyle='--',marker=, color='red', label='C++')
title('$C++$ $vs$ $Python:$ $32x32$',fontsize=22)
xlabel('$Temperature$ $T/K$',fontsize=22)
ylabel('$Magnetisation$',fontsize=22)
legend(loc=1,fontsize='20')
show()
The three graphs below are for case of the 2x2 lattice and show a significant amount of agreement between the Python and the C++ data.
| Energy | Magnetisation |
|---|---|
 |
 |
| Heat Capacity |
|---|
 |
Task 18
Python code that gives a Heat-Capacity against Temperature graph, along with its fitted verion:
   %pylab inline
   data = np.loadtxt("8x8_1.dat") #assume data is now a 2D array containing two columns, T and C
   T = data[:,0] #get the first column
   E = data[:,1] # get the second column
   E2 = data[:,2]
   Var=np.array(E2)-np.array(E)**2
   T2=np.array(T)**2
   C=Var/T2
   #first we fit the polynomial to the data
   fit = np.polyfit(T, C, 25) # fit a third order polynomial
   #now we generate interpolated values of the fitted polynomial over the range of our function
   T_min = np.min(T)
   T_max = np.max(T)
   T_range = np.linspace(T_min, T_max, 1000) #generate 1000 evenly spaced points between T_min and T_max
   fitted_C_values = np.polyval(fit, T_range) # use the fit object to generate the corresponding values of C
   figure(figsize(20,20))
   plot(T,C,color='blue',label='unfitted')
   plot(T_range,fitted_C_values, linestyle='--', color='red', label='fitted')
   title('$Heat$ $Capacity$ $against$ $Temperature$',fontsize=22)
   xlabel('$Temperature$ $T/K$',fontsize=22)
   ylabel('$Heat$ $Capacity$ $C/JK-1$',fontsize=22)
   legend(loc=1,fontsize='20')
   show()
Example for a fitted curve with data from an 8x8 spin lattice:

Task 19
Python code, that only fits a certain region/the peak of the curve of a Heat Capacity - Temperature graph:
   %pylab inline
   data = np.loadtxt("8x8_1.dat")
   T = data[:,0]
   E = data[:,1]
   E2 = data[:,2]
   Var=np.array(E2)-np.array(E)**2
   T2=np.array(T)**2
   C=Var/T2
   Tmin = 2.13
   Tmax = 2.72
   selection = np.logical_and(T > Tmin, T < Tmax)
   peak_T_values = T[selection]
   peak_C_values = C[selection]
   fit = np.polyfit(peak_T_values, peak_C_values, 25)
   fitted_C_values = np.polyval(fit, peak_T_values)
   figure(figsize(20,20))
   plot(T,C,color='blue',linestyle='--',label='unfitted')
   plot(peak_T_values,fitted_C_values, linestyle='-',marker=, color='red', label='fitted')
   title('$Heat$ $Capacity$ $against$ $Temperature$',fontsize=22)
   xlabel('$Temperature$ $T/K$',fontsize=22)
   ylabel('$Heat$ $Capacity$ $C/JK-1$',fontsize=22)
   legend(loc=1,fontsize='20')
   show()

One can see that when the graph is only fitted at the peak, the fitting is much more accurate and effective.
Task 20
%pylab inline
   def findC(dat):
       data = np.loadtxt(dat)
       T = data[:,0]
       E = data[:,1]
       E2 = data[:,2]
       Var=np.array(E2)-np.array(E)**2
       T2=np.array(T)**2
       C=Var/T2
       Tmin = 2.0
       Tmax = 3.5
       selection = np.logical_and(T > Tmin, T < Tmax)
       peak_T_values = T[selection]
       peak_C_values = C[selection]
       fit = np.polyfit(peak_T_values, peak_C_values, 25)
       fitted_C_values = np.polyval(fit, peak_T_values)
       peak_T_range=linspace(Tmin,Tmax,1000)
       Cmax = np.max(fitted_C_values)
       Tmax = peak_T_range[fitted_C_values == Cmax]
return Tmax
   d=['2x2_2.dat','4x4_2.dat','8x8_2.dat','16x16_2.dat']
   x=[1/2,1/4,1/8,1/16]
   Tc=[]
   for i in d:
       Tc+=[findC(i)]
References
- ↑ 1.0 1.1 https://wiki.ch.ic.ac.uk/wiki/index.php?title=Third_year_CMP_compulsory_experiment/Introduction_to_the_Ising_model
- ↑ 2.0 2.1 P. Atkins and J. de Paula, Physical Chemistry, WH Freeman and Company, New York, 9th edn, 2010, ch. 15, p.576
- ↑ Shriver and Atkins, Inorganic Chemistry, Oxford University Press, Oxford, 5th edn, 2010, ch.20, p.503
- ↑ Dr. David Tong, University of Cambridge, Department of Applied Mathematics and Theoretical Physics, Statistical Physics - Mathematical Tripos, 2011/2012
