Rep:Mod:PKO17
The Cope Rearrangement Tutorial
The Cope rearrangement is an example of a [3+3] sigmatropic rearrangement. This is a pericyclic reaction in which an alkyl group migrates from one end of a chain to another, and involving the breaking of one σ-bond and the formation of a new σ-bond at the new attachment point. The mechanism for the reaction is shown in Figure 1.
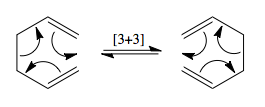
The reaction can proceed via two possible transition states, which forms the basis for this module. Firstly, Gaussian calculations using the Hartree-Fock method will be used to optimize the geometry of the starting material 1,5-hexadiene. The geometries of the transition states will be optimized and IRC calculations will be used to link them to the two conformers of 1,5-hexadiene.
Optimizing the Reactants and Products
A molecule of 1,5-hexadiene was drawn in Gaussview, with the four central carbon atoms in an antiperiplanar arrangement (with a dihedral angle of approximately 180°). The "clean" function was used to clean the structure. A Gaussian optimization calculation was performed using the Hartree-Fock method and the 3-21G basis set. The results of the optimization were analyzed in order to determine the energy and point group of the molecule. The optimized structure of this "anti" conformation can be found here:
The molecule was then redrawn, but this time with a "gauche" conformation of the four central carbon atoms. The Gaussian optimization calculation was carried out as described above, and the energy and point group found by the calculation are displayed in the table below. The optimized structure can be found here:
When comparing energies of the anti and gauche conformers of a molecule like this, we would typically expect the anti conformer to have the lower energy of the pair. This is because the alkyl substituents are sterically very bulky compared to the hydrogen atoms, and we would therefore assume that steric hindrance would force them to occupy positions antiperiplanar to each other. However, examination of the output file from the calculation shows that the gauche conformer is lower in energy that the anti conformer by 0.177 kj/mol. As we can see, there is little difference between the energies of the two conformers. These findings would suggest that the stability of each conformer is not predominantly decided by steric interactions between the two alkyl substituents, and that there is therefore another factor which determines the relative energies.
By adjusting the symmetry and the dihedral angle of the molecule, 10 possible conformations of 1,5-hexadiene can be accessed. These have been listed here. In an attempt to find a lower energy form of 1,5-hexadiene, two other conformations were drawn, with the double bonds pointing in different directions to the two conformations previously modelled. The optimized anti structure found can be seen here:
and the gauche structure can be seen here:
Gaussian conformations were performed on these structures and the energies and point groups of the optimized structures can be found in the table below. Analysing the output files, however, shows that these conformations differ only very slightly from the two conformations previously modelled, and therefore a conformation with a significantly lower energy was unable to be found. The following table displays the findings of the Gaussian optimization calculations:
| 1 - Anti | 2 - Gauche | 3 - Anti | 4 - Gauche | |
|---|---|---|---|---|
| Newman projection | ||||
| Energy / a.u. | -231.69260 | -231.69267 | -231.6925 | -231.6779 |
| RMS gradient norm / a.u. | 0.00001824 | 0.00001866 | 0.00001339 | 0.00000000 |
| Dihedral angle / ° | 176.9 | 63.7 | 180 | 67.7 |
| Point group | C2 | C1 | Ci | C2 |
The anti conformer 3, which belongs to the Ci point group, is the one which will be further investigated in this section. The analysis already conducted has shown the energy to be the same as that displayed in Appendix 1, and therefore we can be confident that the correct structure has been drawn.
The structure was then reoptimized. This time, the DFT/B3LYP method was used, with the 6,31G(d) basis set being used. The reoptimised structure can be seen here:
The main change in geometry between this reoptimized structure and that optimized with the HF/6-21G method previously is seen in the dihedral angle, which increases by 4° after the second optimization calculation, suggesting that the B3LYP method is the more accurate of the two calculations used. The results of the first and second optimization calculations can be compared in the following table:
| HF / 6-21G | B3LYP / 6-31G(d) | |
|---|---|---|
| Energy / Hartrees | -231.69251 | -234.61170 |
| Dihedral angle C=C-C-C / ° | 114.669 | 118.528 |
| Dihedral angle C-C=C-C / ° | 180 | 180 |
| Dihedral angle C-C-C=C / ° | -114.669 | -118.528 |
The final energy obtained from this reoptimization gives an indication of the energy of the conformation on a potential energy surface. If we are able to find out additional terms, then we will be able to compare this to values obtained experimentally. In order to predict these values, we can carry out a frequency calculation.
This was performed in Gaussian, by selecting "Frequency" as the job type, and the B3LYP/6-31G(d) method was used. The output file from this frequency calculation can be accessed here: Media:PKOHEX3FREQ.LOG
The output file was used in order to access vibrational analysis performed during the frequency calculation. Firstly, the vibrational frequencies given for the conformation were checked to ensure that they were all positive; this confirms that the vibrations are real and that the conformation corresponds to a minimum in the potential energy surface. This function was then used to plot a prediction of the infrared spectrum of the structure, which is shown in Figure 2.

The next step was the analysis of the thermochemistry section of the calculation's output file. The four energies displayed under the vibrational temperatures are shown in the following table:
| Energy type | Value at 298.15K |
|---|---|
| Sum of electronic and zero-point energies / a.u. | -234.46921 |
| Sum of electronic and thermal energies / a.u. | -234.46186 |
| Sum of electronic and thermal enthalpies / a.u. | -234.46091 |
| Sum of electronic and thermal free energies / a.u. | -234.50082 |
These energies can be defined as follows:
- Sum of electronic and zero-point energies - this is the potential energy at 0K, and includes the zero-point energy (E = Eelec + ZPE).
- Sum of electronic and thermal energies - this includes translational, rotational and vibrational contributions at 298K and 1 atm (E = Eelec + Erot + Etrans + Evib)
- Sum of electronic and thermal enthalpies - this includes a correction to account for RT, which proves more accurate when dealing with dissociation reactions. (H = E + RT)
- Sum of electronic and thermal free energies - this includes entropic contributions (G = H - TS)
Optimizing the chair and boat transition structures
An allyl fragment was drawn in Gaussview and optimized using the HF method and 3-21G basis set. This fragment was then pasted twice into a new molecule window, and the two fragments were oriented to resemble the chair transition state shown in Appendix 2. The "modify bond" feature was used in order to set the terminal carbon atoms of the two fragments approximately 2.2 Angstroms apart. This transition state estimate was then optimized using two different methods: the first of which is a Gaussian optimization to a transition state (Berny). The force constants were calculated once and the keyword "Opt=NoEigen" was added to prevent the simulation crashing if more than one imaginary frequency is detected. This optimization gave one imaginary frequency, at -817.85 cm-1. The optimized structure is shown in Figure 3, and its predicted IR spectrum in figure 4.
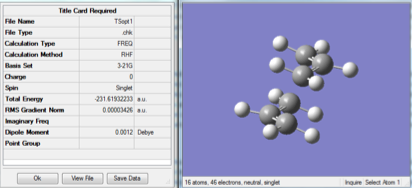
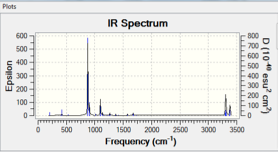
The animation of the vibration can be seen here:
The structure was then optimized again using the frozen coordinate method. The estimated structure was again pasted into Gaussview, and the redundant coordinate editor feature was used. This fixes the bond breaking/forming distances at 2.2 Angstroms, and the optimization is then carried out as if it were a minimum. A second optimization was then carried out to a transition state, with the derivative option chosen in the freeze coordinates section. The result is a structure almost identical to the one found by the previous method. The energy was found to be -231.619 a.u., which is exactly the same as that the previous optimization's results. Both calculations gave the bond breaking/forming distances to be 2.0199 angstroms. The similarity in the results is expected, since the two optimization types employed use the same method. The second method used does this in two steps, firstly freezing the bond making/breaking coordinates and optimizing the rest of the structure, then relaxing the coordinates of the new bonds and allowing them to be optimized. The first method does both those steps in one calculation. Since the results of both calculations appear equally accurate, the first one used is probably preferable since it is quicker and requires fewer steps.
The next step involves performing optimization calculation of the boat transition structure. This was done using the QST2 method, in which the reactants and products are specified and the transition state is found by interpolating between the two structures.
The .chk output file for the Ci optimized structure from the first section of the module was pasted into a new molecule group window. This was done twice, to create two molecules which will correspond to the the reactant and the product. The molecules were viewed side-by-side and rotated to appear as shown in Figure 6. The "atom list" feature was used to change the numbering of the atoms in order to differentiate between the two otherwise identical structures.
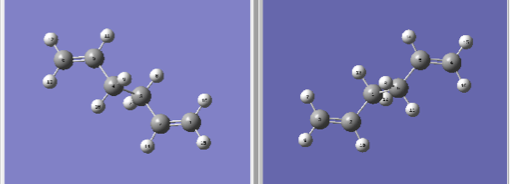
The Gaussian opt+freq calculation was then set up, with the TS (QST2) method selected. The calculation was submitted but failed. This is because the orientation of the product and reactant molecules entered were not close enough to that of the transition state for the calculation to interpolate successfully. The geometries of the two structures were therefore altered; the central C-C-C-C dihedral angle was set to 0°, and each of the two C-C-C angles in each of the molecules was set to 100°. The structures then appeared as shown in Figure 7:
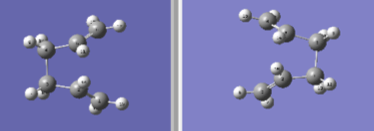
The QST2 calculation was performed again. This time, the calculation worked and the structure is displayed in Figure 8.
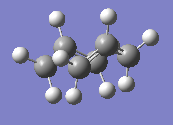
The output file displayed one imaginary frequency, at -839.85 cm-1, which corresponds to one bond breaking and another being formed simultaneously, as would be expected.
The QST2 calculation is much more time-consuming than the TS(Berny) calculation used previously. This is due to the hassle of renumbering all of the carbon atoms. The Berny calculation also is better at predicting the structure of the transition state, whereas for the QST2 calculation the drawn geometry must correspond to the structure of the transition state in order for the optimization to succeed.
From the calculations performed so far, it is practically impossible to predict the conformations of the reactant and product molecules from the transition state. We can therefore implement the intrinsic reaction coordinate (IRC) method in Gaussian in order to follow the path of the transition state to a minimum on a potential energy surface.
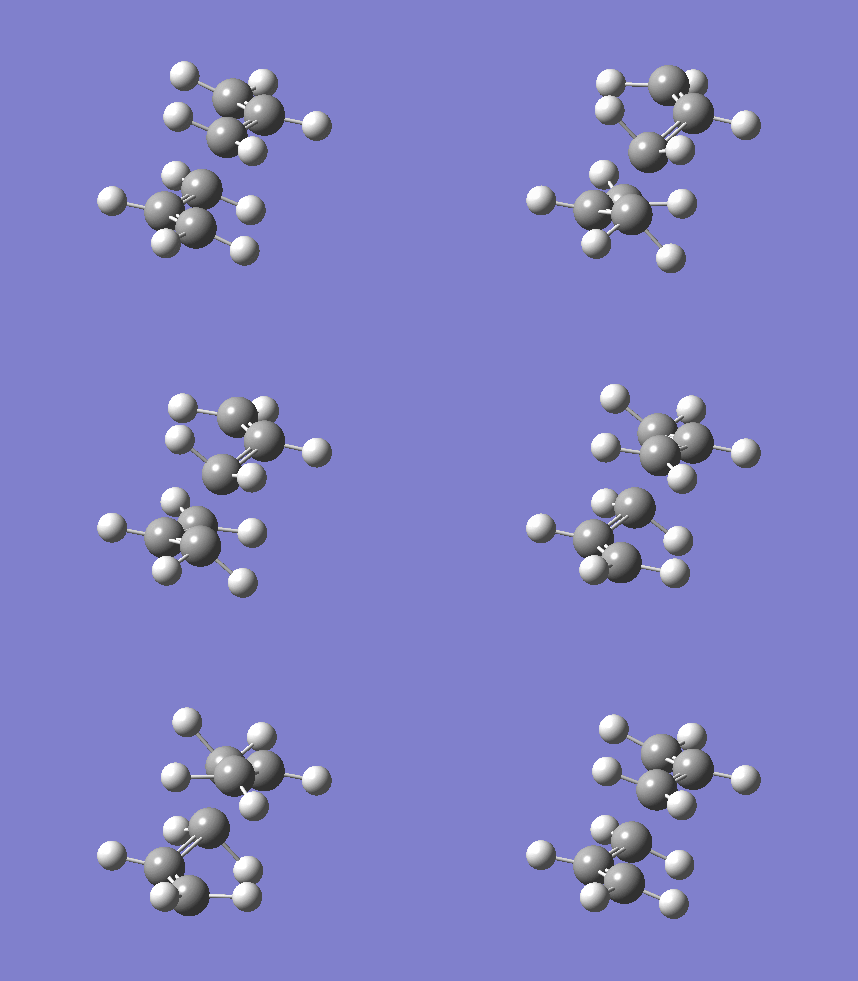
The .chk file for the optimized chair structure was opened. A Gaussian IRC calculation was set up in the forward direction, with the number of points along the IRC set to 50. The calculation returned geometries for 22 points along the IRC. The geometries for the first point and the two final points are shown in Figure 9:

When the calculation was finished, a minimum had still not been reached, so the calculation was repeated. One option to find the minimum would be to increase the maximum number of points, however the calculation had finished at 22 points out of a maximum of 50, which suggests that the number does not need increasing. The repeat calculation was therefore performed with the force constants being computed at each step. The results for the two calculations performed are compared in the following table:
| IRC with force constants calculated once | IRC with force constants calculated at every step | |
|---|---|---|
| Energy / Hartrees | -231.6895 | -231.6926 |
| C=C bond length / Angstroms | 1.32 | 1.32 |
| Central C-C bond length / Angstroms | 1.55 | 1.54 |
The results given by the two calculations are very similar. The second calculation gave an energy which matched up more closely to that given in the appendix. This suggests that this is the more accurate method of the two. This is as expected; it is known to be the most reliable, but is also the most expensive.
- boat??***
The Diels-Alder Cycloaddition
This part of the module will focus on the Diels-Alder reaction between ethylene and cis-butadiene, shown in Figure 10.

Optimizing the reactants
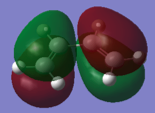
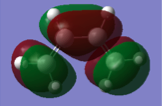
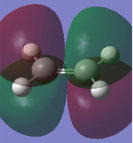
Both reactants were drawn in Gaussview, and optimization calculations were carried out using the AM1 semi-empirical MO method. In the resulting .chk file, the HOMO and LUMO of each molecule were visualized and the symmetry noted. The results are shown in the following table:
Whether or not this reaction will proceed depends on the relative properties of the molecular orbitals involved. If the HOMO of one reactant and the LUMO of another are similar in energy and have the same symmetry properties, then the overlap is allowed and the reaction can proceed. From the table above, we can see that the HOMO of cis-butadiene and the LUMO of ethylene are both antisymmetric, and by looking at the diagrams we can see that they will be able to interact successfully. Equally, the LUMO of cis-butadiene and the HOMO of ethylene are both symmetric and will also be able to interact. With this established, we can see that the reaction is therefore allowed.
Optimizing the transition structure
The next step is the optimization of the transition structure, in order to interpret the nature of the path that the reaction takes.
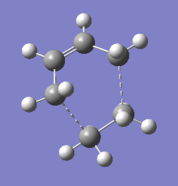
The transition structure, which has an envelope shape, was drawn in Gaussview. The bonds that are being formed were defined as dashed bonds with the "modify bond" feature, and the distances were provisionally set to 1.7 Angstroms, as the existing C-C bonds had a length of around 1.55 Angstroms. When the "clean" function was used, the bond forming distances were set to 2.29 Angstroms.
A Gaussian optimization calculation was then carried out, again using the semi-empirical AM1 method. The following table shows the results of this calculation:
| Optimized geometry | C-C bond forming lengths | Energy / Hartrees | Vibration frequency / cm-1 | HOMO | LUMO |
|---|---|---|---|---|---|
 |
2.32, 2.29 | 0.4622 | -956 | 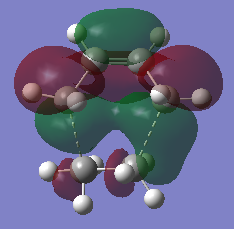 |

|
The structure of the optimized transition state is found here:
Analysis of the molecular orbitals shows that the HOMO is symmetric with respect to the plane, and the LUMO is antisymmetric. Comparing these to the reactant molecular orbitals pictured above, we can see that the antisymmetric LUMO is made up of the HOMO of cis-butadiene and the LUMO of ethylene. It follows that the symmetric HOMO can be seen to be made up from the LUMO of cis-butadiene and the HOMO of ethylene. This follows the selection rules described previously about orbitals needing to have the same symmetry in order to interact.
The C-C bond forming lengths were found to be 2.32 and 2.29 Angstroms. Compared to the standard C-C bond length of approximately 1.54 Angstroms, these bond lengths are especially long. However, the bonds in the transition structure are only partly formed. As the reaction proceeded and the bonds were fully formed, we would expect the bond lengths to decrease, as the reaction pathway involves the reactant molecules becoming closer to each other.
Cycloaddition of cyclohexa-1,3-diene and maleic anhydride
The reaction of cyclohexa-1,3-diene and maleic anhydride can give two products, as shown in Figure 11. The endo product 4 is the primary product.

By analysing the transition structures of the two possible products, we can hopefully explain the stability of the endo product and therefore the selectivity of the reaction. The first step was to optimize the reactants. This was done using the semi-empirical AM1 MO method. The optimized structure of maleic anhydride is found here:
and the structure of cyclohexa-1,3-diene is found here:
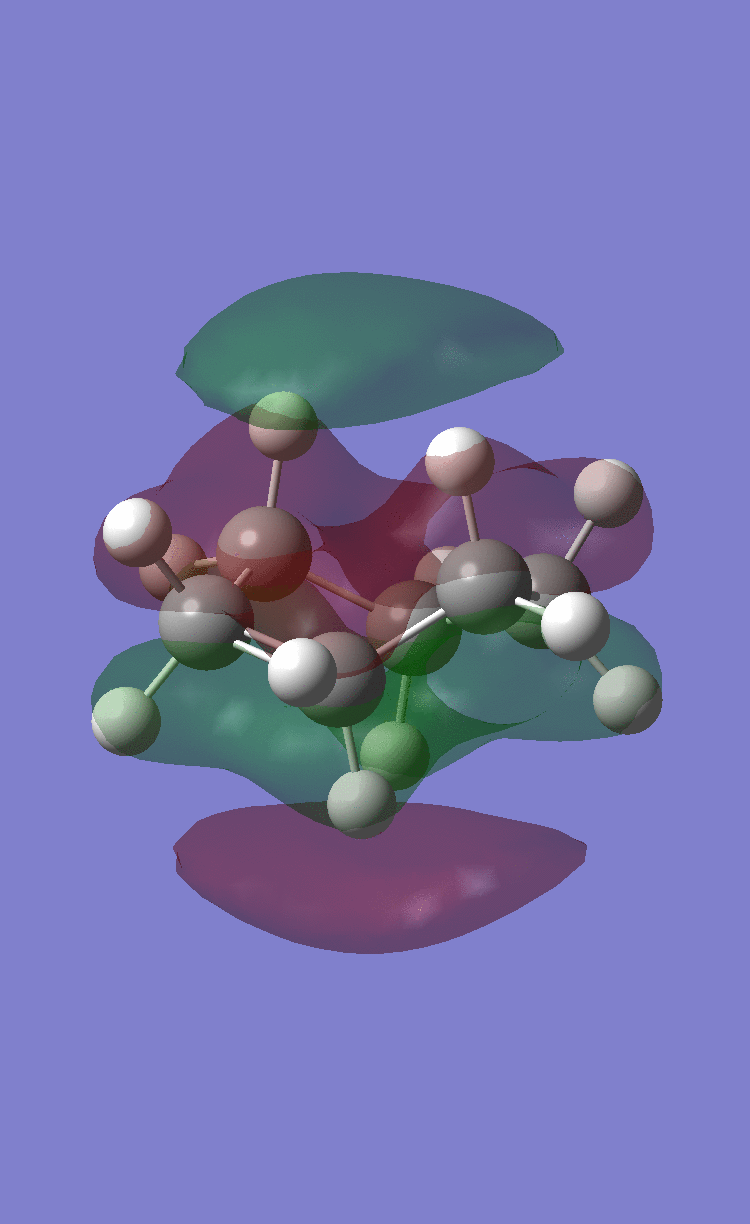
Their respective HOMOs and LUMOs are shown in the following table:
| Maleic anhydride HOMO | Maleic anhydride LUMO | Cyclohexadiene HOMO | Cyclohexadiene LUMO |
|---|---|---|---|
 |
 |
 |
|
| Symmetric | Antisymmetric | Antisymmetric | Symmetric |

