Rep:Mod:PAP0802
Module 2
Analysis of BH3
Optimisation of BH3

BH3 was investigated using Gaussian 5.0 to optimise the molecule and find the IR spectra, molecular orbitals and to carry out natural bonding orbital analysis. Before the BH3 molecule was optimised, the bond lengths were changed from 1.18Å to 1.50Å in order to see a greater change in the molecule when optimising and obtaining the graphs for the gradients. The optimisation was carried out using the DFT B3LYP method and the basis set was 3-21g. The basis set was set to low accuracy because BH3 is a simple molecule and does not need much computing power in order to optimise it. After optimisation, BH3 had a B-H bond length of 1.19Å and a H-B-H bond angle of 120o. To find out whether the optimisation carried out was successful, the .log output file must be viewed.

As can be seen from the output file, the calculations have converged so the output BH3 structure has been optimised. The calculation summary can be viewed to give important information for the calculation that has been carried out.
| File Type | .log |
| Calculation Type | FOPT |
| Calculation Method | RB3LYP |
| Basis Set | 3-21G |
| Charge | 0 |
| Spin | Singlet |
| E(RB3LYP) | -26.46 a.u. |
| RMS Gradient Norm | 0.00020672 a.u. |
| Dipole Moment | 0.0000 Debye |
| Point Group | D3h |
| Job CPU Time | 0 days, 0 hours, 0 minutes, 30.0 seconds |
The summary shows that the gradient is less than 0.001 therefore the molecule has been optimised. Gaussian finds the optimised structure, i.e. the most stable structure, by solving the Schrodinger equation for different energies along the potential energy plot of the molecule. It starts at a certain energy, E, which corresponds to a sensible structure and then moves to another energy, E', and again solves the Schrodinger equation for the new energy. The energies are compared and if the second energy is lower then the program will move down this path until it has found the lowest energy structure. These steps can be seen in the total energy and RMS gradient plots below.
 |
 |
The total energy decreases with each step as is expected as the program tries to find the lowest energy structure. The gradient decreases to zero as the minimum energy structure is found. The gradient is found by differentiating the energy so as the slope of the total energy graph decreases, the the gradient becomes zero indicating a minimum has been found. The program does not differentiate between a local minimum and a global minimum therefore a sensible starting structure must be used.
Vibrational Analysis of BH3
The IR spectrum for BH3 is found using the optimised BH3 structure and will confirm whether the minimum energy structure has been found. This was done using the DFT B3LYP calculation method and the 3-21g basis set. The full(nbo) keywords added will give the molecular orbitals and the electron densities of each orbital. The program finds the second derivative of the optimised molecule and this can be used to see if the ground state configuration has been found.

The low frequencies on the top line of the .log output file above indicates the accuracy of the calculation. The largest value is -66cm-1 which, although is much smaller than the frequencies associated with the vibrations of the molecule, is still far from zero. The more accurate the method used to find the frequencies, the closer the low frequency values are to zero therefore the 3-21g basis set is not the most accurate of methods to use.
| File Type | .log |
| Calculation Type | FREQ |
| Calculation Method | RB3LYP |
| Basis Set | 3-21G |
| Charge | 0 |
| Spin | Singlet |
| E(RB3LYP) | -26.46 a.u. |
| RMS Gradient Norm | 0.00020662 a.u. |
| Dipole Moment | 0.0000 Debye |
| Point Group | D3h |
| Job CPU Time | 0 days, 0 hours, 0 minutes, 10.0 seconds |
Again the summary shows that the gradient is less than 0.001 which confirms that the right frequencies were found. The output file also shows important information such as the symmetry of each of the six vibrations. The frequency calculation was carried out using the optimised structure because the geometry of the molecule had to be fixed in order to obtain the correct frequencies.
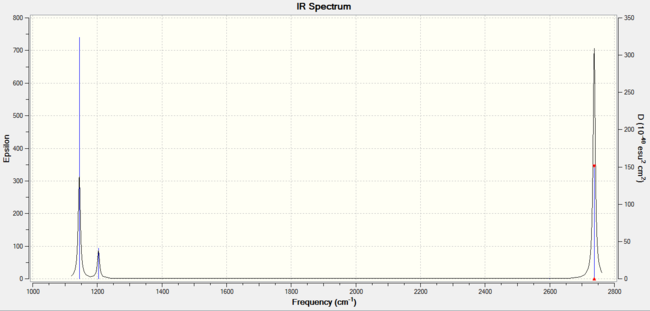
The IR spectrum should show 6 different vibrations due to the 3N-6 rule. N is the number of atoms in the molecule which in this case is 4. Therefore (3x4)-6 gives 6 vibrations.
| Vibration Number | Frequency/cm-1 | Intensity | Vibration Type | Point Group | Dipole Vectors |
|---|---|---|---|---|---|
| 1 | 1144.15 | 92.87 | All three H atoms move up at the same time while the B atom moves down | A2 | 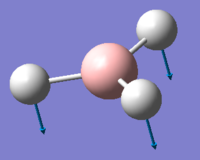 |
| 2 | 1203.64 | 12.31 | Concerted movement of two of the H atoms in a scissor-bend | E' | 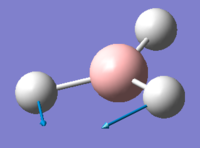 |
| 3 | 1203.64 | 12.32 | Movement of two H atoms in the same direction and the third H atom moving in the opposite direction with a greater displacement | E' | 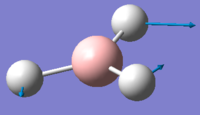 |
| 4 | 2598.42 | 0.00 | Concerted stretching of all three H atoms away from the B atom | A1' | 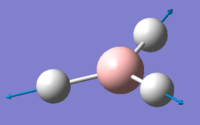 |
| 5 | 2737.44 | 103.74 | Asymmetric stretching of two H atoms away from the B atom | E' | 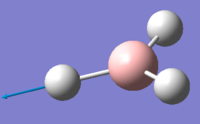 |
| 6 | 2737.44 | 103.73 | Symmetric stretching of two H atoms away from the B atom and stretching of the third H atom away from the B atom | E' | 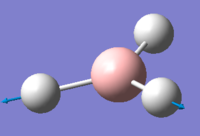 |
The symmetry of each of the vibrations can be assigned. Two sets of vibrations have the same frequency therefore they are assigned as e' as they are degenerate. Animations of each of the vibrations can be seen by clicking the link below the images. Although there are 6 vibrations shown in the output file, only three peaks can be seen on the IR spectrum. One of the stretches can not be seen as it has an intensity of zero. This is due to stretch 4 where the stretching of the hydrogen atoms are symmetric and therefore it is IR inactive.
Molecular Orbitals of BH3
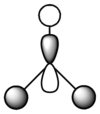
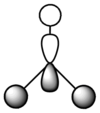
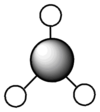
The optimised BH3 file was used to find the molecular orbitals using the B3LYP method and the 6-31g basis set. The MO diagram for BH3 can be seen below. The 1s orbital for the boron atom is not shown on the MO diagram as it is too low in energy to interact with the other orbitals.
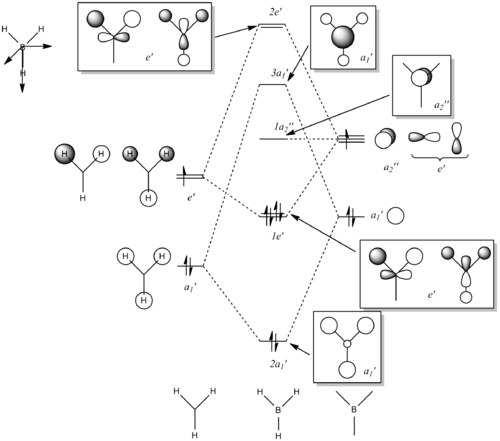
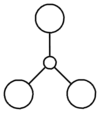
The output formatted checkpoint file was opened with Gaussian and used to find the structures of the molecular orbitals for the first 8 MOs. These can be compared with the LCAOs from the molecular orbital diagram. The calculation run can be seen in D-space: DOI:10042/to-10838
| LUMOs | MO in Gaussian | LCAO MO | HOMOs | MO in Gaussian | LCAO MO |
|---|---|---|---|---|---|
| LUMO | 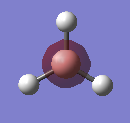 |
 |
HOMO | 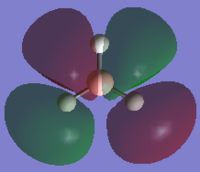 |

|
| LUMO+1 | 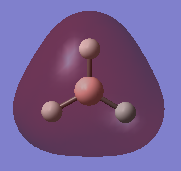 |
 |
HOMO-1 | 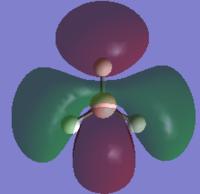 |
|
| LUMO+2 | 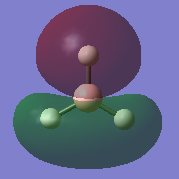 |
 |
HOMO-2 | 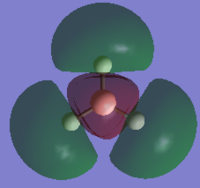 |
|
| LUMO+3 | 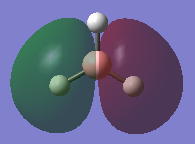 |
 |
HOMO-3 | 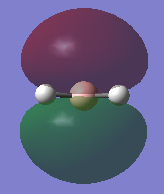 |

|
The MOs found from the calculations are very similar to the LCAOs in the MO diagram which suggests that the calculation method used was ideal. Linear combination of atomic orbitals can be used to predict the shapes of the molecular orbitals for BH3 as it is a simple highly symmetric molecule.
NBO Analysis of BH3
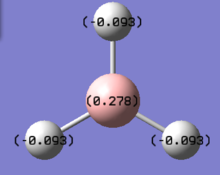
Natural bonding orbital analysis was carried out on the output file created from the population analysis. From this, the charge distribution can be seen. The boron atom is green and has a charge of 0.270 which means it is highly positively charged. The hydrogen atoms are red and have a charge of -0.093 so they are highly negatively charged.
The charge distribution can also be seen from the output .log file.
 |
 |
 |
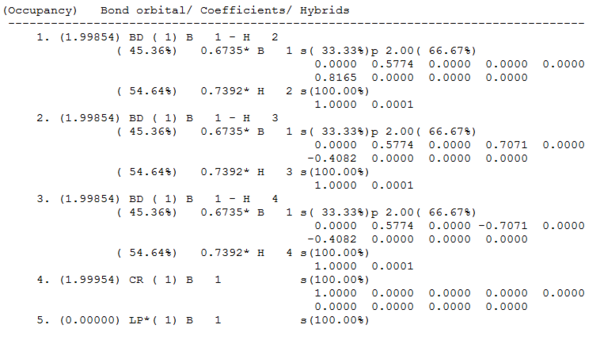
The orbital coefficients can be seen in the output .log file. This gives information on the contribution of each atom in the molecule to the 2e-2c B-H bonds and the s and p character of the atoms. It shows that in all three BH bonds (BD) the boron atom contributes 45.36% with a hybridisation of 33.33%s+66.67%p character and the hydrogen atom contributes 54.64% to the bond with 100%s character. Therefore the boron is sp2 hybridised as it has twice as much p orbital character than s. Orbital 4 (CR) is the 1s orbital of the boron atom. This does not interact with the other orbitals and is not involved in bonding therefore it has 100%s character. The last orbital is the lone pair on the boron atom in the p orbital perpendicular to the plane of the molecule. The output shows it is in the s orbital but it is supposed to be in the 100% p orbital.
The second perturbation theory analysis of Fock matrix did not show energy values of greater than 20kcalmol-1 so there is no significant mixing in the borane. The summary of the NBO calculation can be seen below. It shows that the energy has remained the same and the point group of the molecule has been retained.
| File Type | .log |
| Calculation Type | SP |
| Calculation Method | RB3LYP |
| Basis Set | 6-31G |
| Charge | 0 |
| Spin | Singlet |
| E(RB3LYP) | -26.61 a.u. |
| Dipole Moment | 0.0000 Debye |
| Point Group | D3h |
| Job CPU Time | 0 days, 0 hours, 0 minutes, 6.0 seconds |
Analysis of TlBr3
Optimisation of TlBr3
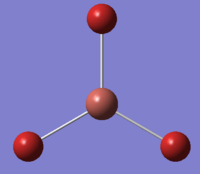
TlBr3 was drawn in GaussView 5.0 using a similar method to BH3. The symmetry was restricted to D3h to keep the orientation the same throughout the calculations. The summary shows that the calculation method was B3LYP and the basis set used for optimisation was LANL2DZ. A pseudo-potential had to be used for TlBr3 as opposed to the less accurate 3-21g for BH3 as thallium is a heavier element than boron.
| File Type | .log |
| Calculation Type | FOPT |
| Calculation Method | RB3LYP |
| Basis Set | LANL2DZ |
| Charge | 0 |
| Spin | Singlet |
| E(RB3LYP) | -91.22 a.u. |
| RMS Gradient Norm | 0.00000090 a.u. |
| Dipole Moment | 0.0000 Debye |
| Point Group | D3h |
| Job CPU Time | 0 days, 0 hours, 0 minutes, 37.0 seconds |
The optimised TlBr3 structure has a Tl-Br bond length of 2.65Å and a Br-Tl-Br bond angle of 120o. The literature[1] Tl-Be bond length is 2.51Å which is quite close to that found using the optimisation method therefore the method used for optimisation was acceptable.
Vibrational Analysis of TlBr3
Frequency analysis was also carried out on the TlBr3 to see if the minimum energy structure was found as the frequency calculations carry out a second differential of the potential energy surface. The basis set used for this calculation was also LANL2DZ so the optimisation and frequency calculations could be compared. The frequencies all have positive values therefore the minimum energy structure was found.
| File Type | .log |
| Calculation Type | FREQ |
| Calculation Method | RB3LYP |
| Basis Set | LANL2DZ |
| Charge | 0 |
| Spin | Singlet |
| E(RB3LYP) | -91.22 a.u. |
| RMS Gradient Norm | 0.00000088 a.u. |
| Dipole Moment | 0.0000 Debye |
| Point Group | D3h |
| Job CPU Time | 0 days, 0 hours, 0 minutes, 23.0 seconds |
The energy for the optimisation and the frequency calculation are the same. The output file was checked for the low frequencies. It can be seen that they are close to zero so the basis set used in this case is very accurate.
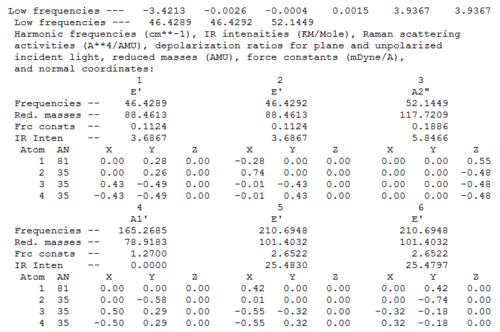
The largest low frequency is 3.94cm-1 which is very close to zero so the basis set used for the calculation is quite accurate. The lowest "real" normal modes for TlBr3 can be seen in the second row of the output file shown.
| Vibration Number | Frequency/cm-1 | Intensity | Vibration Type | Point Group | Dipole Vectors |
|---|---|---|---|---|---|
| 1 | 46.43 | 3.69 | Concerted movement of two of the Br atoms in a scissor-bend | E' | 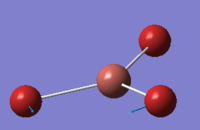 |
| 2 | 46.43 | 3.69 | Movement of two Br atoms in the same direction and the third Br atom moving in the opposite direction with a greater displacement | E' | 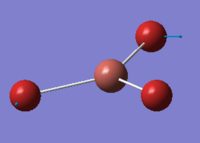 |
| 3 | 52.14 | 5.85 | Concerted bending of all three Br atoms up while the Tl atom moves down | A2 | 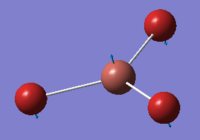 |
| 4 | 165.27 | 0.00 | Concerted stretching of all three Br atoms away from the Tl atom | A1' | 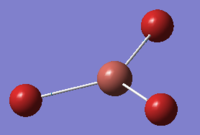 |
| 5 | 210.69 | 25.48 | Asymmetric stretching of two Br atoms and movement of the Tl atom back and forth | E' | 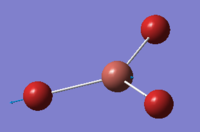 |
| 6 | 210.69 | 25.48 | Symmetric stretching of two Br atoms away from the Tl atom and stretching of the third Br atom away from the Tl atom | E' | 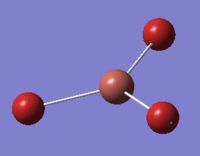 |
The animations of the vibrations of the molecule can be seen by clicking the link below the image. Vibrations 1&2 and 5&6 are degenerate so are given the symmetry label e'. There are 6 vibrations for this molecule due to the 3N-6 rule. Vibration 4 is not seen on the IR spectrum as the stretching is completely symmetric.
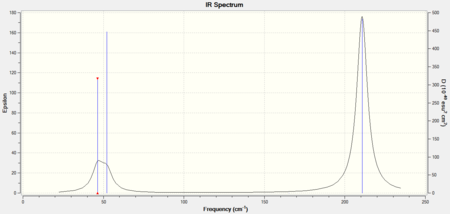
GaussView does not draw bonds in some structures where expected because the program draws bonds according to the pre-set distance. However this does not mean that there are no bonds present in the real structure as this is just a convenient method for GaussView to perform calculations, especially for inorganic compounds. A bond is an interaction between atoms which could be due to many types of interactions. This includes electromagnetic forces such as van der Waal's forces and dipole interactions, and exchange of electrons either through covalent or ionic bonds. Bonds occur when there is good overlap between the orbitals of the atoms in question as this allows interactions between the atoms.
References
- ↑ Julius Glaser and Georg Johansson, Acta Chemica Scandiavica A, 1982, 36, 125-135 DOI:10.3891/acta.chem.scand.36a-0125
Analysis of [Mo(CO)4(PCl3)2]
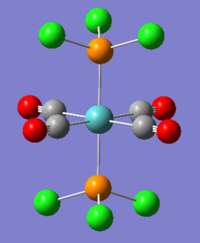
[Mo(CO)4(PPh3)2] could be investigated using the methods above, however the phenyl groups are very large and require a lot of computational demand therefore Cl atoms will be used in their place as it is very similar electronically to the triphenylphosphine ligand. The cis and trans forms of [Mo(CO)4(PCl3)2] will be optimised using the same calculation method and basis set and their vibrational spectra will be analysed in order to find which of the two isomers is the most stable.
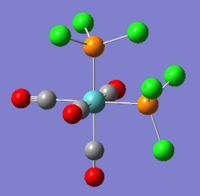 |
 |
Optimisation of [Mo(CO)4(PCl3)2] Isomers
The optimisation of both isomers was carried out using the R3LYP method and the LANL2MB basis set. This is a lower accuracy basis set than LANL2DZ but it is ideal for the initial optimisation. The optimisation was set to "loose" in order for the limit to be reached.
The output files show whether the calculations had converged:
 |
 |
The point group for the cis isomer is C2v and the point group is D2h for the trans isomer, however as the point group was not restricted, the point group in the summaries below appear as C1.
| Cis Isomer | Trans Isomer | |
|---|---|---|
| File Type | .log | .log |
| Calculation Type | FOPT | FOPT |
| Calculation Method | RB3LYP | RB3LYP |
| Basis Set | LANL2MB | LANL2MB |
| Charge | 0 | 0 |
| Spin | Singlet | Singlet |
| E(RB3LYP) | -617.53 a.u. | -617.52 a.u. |
| RMS Gradient Norm | 0.00028593 a.u. | 0.00116747 a.u. |
| Dipole Moment | 8.4926 Debye | 0.0000 Debye |
| Point Group | C1 | C1 |
| Job CPU Time | 0 days, 0 hours, 11 minutes, 49.0 seconds | 0 days, 0 hours, 3 minutes, 39.1 seconds |
| Image |  |

|
| Jmol | ||
| DOI | DOI:10042/to-10838 | DOI:10042/to-10839 |
The summaries show that unlike the trans isomer, the cis isomer has a dipole moment. This is due to the symmetry of the trans molecule where the chlorine atoms are all trans to each other therefore their dipole moments cancel each other out. This does not occur with the cis isomer as the chlorine atoms are not trans to each other so there is no dipole cancellation. The gradients also show that the molecule has been optimised as the are both less than 0.001 a.u.
To ensure that the molecules have been optimised to the global minimum and not the local minimum, both isomers were adjusted using the dihedral angle adjuster. The PCl3 groups of the cis isomer were arranged so one P-Cl bond of one group was aligned with the axial CO-Mo-CO bond facing up and one P-Cl bond of the other group was aligned with the axial CO-Mo-CO bond facing down. In the trans isomer, the PCl3 groups are eclipsed so one P-Cl bond of each group is parallel with to one CO-Mo bond so the torsion is 0o.
 |
 |
The method for the second optimisation was the same but the basis set was changed to LANL2DZ as this is a more accurate calculation. The "opt=loose" keywords were replaced with "int=ultrafine scf=conver=9" and the optimisation was run.
| Cis Isomer | Trans Isomer | |
|---|---|---|
| File Type | .log | .log |
| Calculation Type | FOPT | FOPT |
| Calculation Method | RB3LYP | RB3LYP |
| Basis Set | LANL2DZ | LANL2DZ |
| Charge | 0 | 0 |
| Spin | Singlet | Singlet |
| E(RB3LYP) | -623.58 a.u. | -623.58 a.u. |
| RMS Gradient Norm | 0.00000877 a.u. | 0.00003763 a.u. |
| Dipole Moment | 1.3096 Debye | 0.3053 Debye |
| Point Group | C1 | C1 |
| Job CPU Time | 0 days, 1 hours, 10 minutes, 34.3 seconds | 0 days, 0 hours, 45 minutes, 55.5 seconds |
| Image |  |

|
| Jmol | ||
| DOI | DOI:10042/to-10840 | DOI:10042/to-10841 |
The summaries above show that as the gradient is less than 0.001 a.u., a minimum energy structure has been reached. The energy for the second optimisation is lower than that for the first which suggests that the global minimum has been found. This can also be seen from the output .log files. The trans isomer has a dipole moment after the second optimisation where it had none in the first as it has lost its symmetry. The dipole moment for the cis isomer is lower in the second optimisation than in the first because the molecule has been changed so it is more symmetric.
 |
 |
The output files of both show that the calculations have converged therefore the minimum energy structure has been found. The energies of the molecules are reported in Hartrees therefore they must be converted to kJmol-1 using the conversion factor 1 a.u. = 1 Hartree = 2625.50 kJmol-1. This allows the energies to be compared as they were calculated using the same method and basis set. The cis isomer has an energy of -1.637202x10⁶ kJmol-1 and the trans isomer has an energy of -1.637199x10⁶ kJmol-1. The energy difference between the two isomers is therefore only 2.73 kJmol-1 which is within the error limit of the calculation. As there is not a large difference in energy between the two isomers, the more stable isomer of the two can not be determined however if PPh3 was used instead of PCl3, a greater difference in energy would be seen as it is a more bulky ligand and would prefer to be trans to each other so the trans isomer would be more stable. The electronic effects of the ligands would also cancel each other out when in the trans position due to the trans effect, making the trans isomer more stable than the cis isomer.
Geometry
The bond distances and dihedral angles can be found using GaussView and compared with literature values to see if the calculation run has given the correct output.
| Bond Length (Å) | Cis Isomer | Trans Isomer | Literature Value[1] |
|---|---|---|---|
| Mo-CO axial | 2.06 | 2.06 | 2.01 |
| Mo-CO equitorial | 2.01 | 2.06 | 2.02 |
| Mo-P | 2.51 | 2.44 | 2.50 |
| C=O | 1.17 | 1.17 | 1.16 |
| Bond Angle (o) | Cis Isomer | Trans Isomer | Literature Value[1] |
|---|---|---|---|
| CO-Mo-CO axial | 178.35 | 179.99 | 180.0 |
| CO-Mo-CO equitorial | 89.73 | 179.00 | 92.1 (trans) |
| P-Mo-P | 94.16 | 177.39 | 180.0 (trans) |
| CO-Mo-P axial | 89.23 | 91.30 | 92.0 |
| CO-Mo-P equitorial | 89.42 | 89.99 | 87.2 |
The bond angles and bond lengths found from literature are for the trans isomer however they relate very closely to the bond lengths and angles found using GaussView which suggests that the optimisations of the molecules proceeded correctly.
Vibrational Analysis
The second optimised structures were used to perform the frequency calculations using the same method and basis set as before.
| Cis Isomer | Trans Isomer | |
|---|---|---|
| File Type | .log | .log |
| Calculation Type | FREQ | FREQ |
| Calculation Method | RB3LYP | RB3LYP |
| Basis Set | LANL2DZ | LANL2DZ |
| Charge | 0 | 0 |
| Spin | Singlet | Singlet |
| E(RB3LYP) | -623.58 a.u. | -623.58 a.u. |
| RMS Gradient Norm | 0.00003938 a.u. | 0.00005163 a.u. |
| Dipole Moment | 1.3096 Debye | 0.3066 Debye |
| Point Group | C1 | C1 |
| Job CPU Time | 0 days, 0 hours, 29 minutes, 50.1 seconds | 0 days, 0 hours, 30 minutes, 15.9 seconds |
| DOI | DOI:10042/to-10842 | DOI:10042/to-10843 |
The frequency analysis carried out on both molecules also support that the minimum energy structures were found as all the frequencies for the vibrations are positive, as can be seen in the output file.
 |
 |
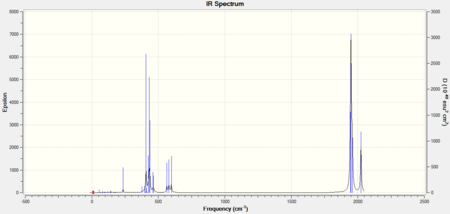
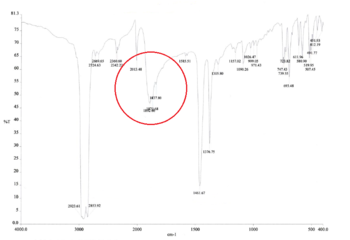
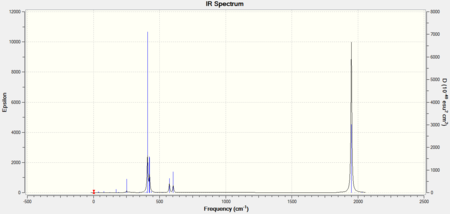
As the ligands in both molecules are the same, the IR spectra are expected to look very similar. The computational IR spectra are compared with the spectra obtained from experimental synthesis of the cis and trans isomers of [Mo(CO)4(PPh3)2] from the 2nd year synthesis labs.[2]
 |
 |
 |
 |
It can be seen that in the IR spectrum for the cis isomer, two carbonyl peaks can be seen in the region of 2100-1750cm-1[3] which is in the region for transition metal carbonyls. As the isomers have different point groups, different peaks will be seen on the IR spectrum corresponding to the CO stretches. In the cis isomer, there are four different carbonyl stretches at due to the 2A1, B1 and B2 stretches whereas in the trans isomer, only one carbonyl stretch can be seen from the Eu stretches as this is the only component from the irreducible representation that is IR active. This is because the A1g and B1g stretches are symmetric so the intensity is zero and they do not appear on the IR spectrum.
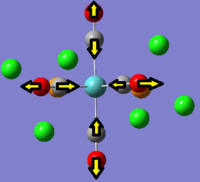 |
 |
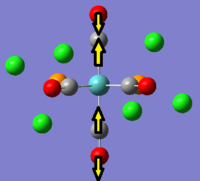 |
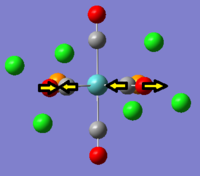 |
| Point Group | Computational Frequency/cm-1 | Experimental Frequency/cm-1 | Literature Frequency/cm-1[4] |
|---|---|---|---|
| A1(a) | 2023.47 | 2013.48 | 2022 |
| A1(b) | 1958.48 | 1892.66 | 1917 |
| B1 | 1948.86 | 1870.68 | 1903 |
| B2 | 1945.37 | 1837.80 | 1882 |
The computational results relate very closely with the experimental and literature values suggesting that the global minimum has been found.
 |
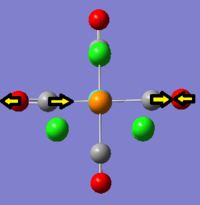 |
| Point Group | Computational Frequency/cm-1 | Experimental Frequency/cm-1 |
|---|---|---|
| Eu | 1950.41, 1951.35 | 1890.52 |
The experimental frequency is slightly lower than that calculated using computational methods but both are within the region of the expected carbonyl-metal stretches. GaussView shows two strong peaks at very similar frequencies for the trans carbonyl stretch which should not be seen as only one peak is expected. This may be because the geometry of the molecule has changed slightly so it does not have a rigid D4h symmetry. Therefore the stretches are not entirely symmetrical but GaussView does not interpret the the stretches as degenerate.
References
- ↑ 1.0 1.1 Graeme Hogarth, Tim Norman, Inorganica Chemica Acta, 1997, 254(1), 167-171 DOI:10.1016/S0020-1693(96)05133-X
- ↑ 2nd Year Synthesis Labs;Experiment 4S Identification of Stereochemical (Geometrical) Isomers of [Mo(CO)4(L)2] by Infrared Spectroscopy
- ↑ P. Atkins, J. de Paula, Atkins’ Physical Chemistry, OUP, 2006, 8, 1013, Table 13.3
- ↑ A.D. Allen, P.F. Barrett, Can. J. Chem., 1968, 46, 1651DOI:10.1139/v68-276
Mini-Project: Square-planar Gold Complexes
Introduction
The mini-project involves looking at different square-planar halogenated gold complexes; AuCl4-, AuCl2Br2- and AuCl3Br-. The molecules will be optimised and the HOMOs and LUMOs of all three molecules will be compared and their IR spectra will be analysed to see the effect different halogens have on the vibrations and energies of the compounds. As gold is a heavy element, pseudo-potentials must be used in order to obtain the global minimum.
 |
 |
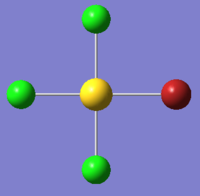 |
Optimisation of the Gold Complexes
The Au-Br bond length, 2.48Å, is slightly longer than the Au-Cl bond length, 2.33Å, as both bromine is larger than chlorine so there is less good overlap between the orbitals. In order to compare the complexes, the calculations for all three must be done using the same method and basis set. In this case, as gold and bromine are computationally demanding atoms, the B3LYP method and LANL2DZ basis set will be used. The geometry of each of the molecules was restrained to their point groups so they would not change throughout the calculations. As all the complexes have a charge of -1, this was set during the optimisation.
| AuCl4- | AuCl2Br2- | AuCl3Br- | |
|---|---|---|---|
| File Type | .log | .log | .log |
| Calculation Type | FOPT | FOPT | FOPT |
| Calculation Method | RB3LYP | RB3LYP | RB3LYP |
| Basis Set | LANL2DZ | LANL2DZ | LANL2DZ |
| Charge | -1 | -1 | -1 |
| Spin | Singlet | Singlet | Singlet |
| E(RB3LYP) | -195.44 a.u. | -191.89 a.u. | -193.67 a.u. |
| RMS Gradient Norm | 0.00005428 a.u. | 0.00000429 a.u. | 0.00011389 a.u. |
| Dipole Moment | 0.0000 Debye | 0.0000 Debye | 1.8183 Debye |
| Point Group | D4h | D2h | C2v |
| Job CPU Time | 0 days, 0 hours, 0 minutes, 24.6 seconds | 0 days, 0 hours, 0 minutes, 42.3 seconds | 0 days, 0 hours, 0 minutes, 28.9 seconds |
| DOI | DOI:10042/to-10844 | DOI:10042/to-10851 | DOI:10042/to-10853 |
The RMS gradient for the optimisation of all three gold complexes are less than 0.001 a.u. therefore they have all been optimised to a minimum energy structure. The energies of the complexes can not be compared directly but as there are no large differences in energy, the substitution of chlorine atoms with bromine atoms has little effect on the overall stability of the molecule. The output files can also be looked at to see whether the calculations have converged. The only molecule of the three that has a dipole moment is AuCl3Br- as this is not symmetric. In AuCl2Br2- the Cl atoms are trans and the Br atoms are trans so their dipole moments cancel each other out.
 |
 |
 |
Vibrational Analysis of the Gold Complexes
The vibrational spectra of the complexes can be used to differentiate between them as they all have different point groups. Therefore the symmetry of the stretches will be different and some will be IR inactive and therefore will not be seen on the spectra. The calculation summaries for the frequency analysis can be seen below.
| AuCl4- | AuCl2Br2- | AuCl3Br- | |
|---|---|---|---|
| File Type | .log | .log | .log |
| Calculation Type | FREQ | FREQ | FREQ |
| Calculation Method | RB3LYP | RB3LYP | RB3LYP |
| Basis Set | LANL2DZ | LANL2DZ | LANL2DZ |
| Charge | -1 | -1 | -1 |
| Spin | Singlet | Singlet | Singlet |
| E(RB3LYP) | -195.44 a.u. | -191.89 a.u. | -193.67 a.u. |
| RMS Gradient Norm | 0.00005427 a.u. | 0.00011392 a.u. | 0.00011389 a.u. |
| Dipole Moment | 0.0000 Debye | 0.0000 Debye | 1.8183 Debye |
| Point Group | D4h | D2h | C2v |
| Job CPU Time | 0 days, 0 hours, 0 minutes, 28.1 seconds | 0 days, 0 hours, 0 minutes, 38.6 seconds | 0 days, 0 hours, 0 minutes, 38.3 seconds |
| DOI | DOI:10042/to-10854 | DOI:10042/to-10856 | DOI:10042/to-10857 |
As the calculation method and basis set used for the optimisation and the frequency analysis are the same, the output files can be compared. The summaries show that the energies of all three complexes have remained the same and as the point groups were set with very high tolerance before the optimisation, the point group symmetry of each molecule has been retained. The RMS gradients are all less than 0.001 a.u. so the global minimum for each molecule has been found.
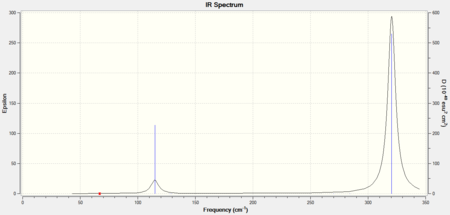
As all three molecules have 5 atoms in total, each one should have 9 degrees of freedom, using the 3N-6 rule for non-linear molecules, and therefore they should have 9 different stretching modes. The IR spectra for AuCl4- has 2 strong visible peaks, the spectra for AuCl2Br2- has 3 strong visible peaks and the spectra for AuCl3Br- has 5.
 |
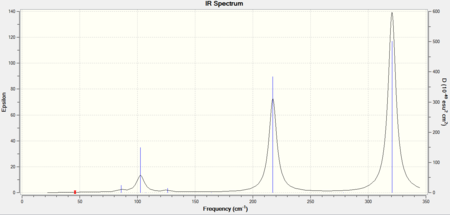 |
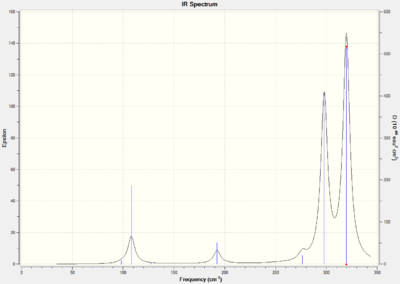
Fewer peaks are seen in the spectrum for AuCl4- because this is the most symmetric molecule of the three. Therefore it will have more IR inactive symmetric stretches than the other two molecules. AuCl2Br2- is the second most symmetric molecule so it will have more peaks than AuCl4- and AuCl3Br- is the least symmetric molecule so it will have the most number of visible peaks.
 |
 |
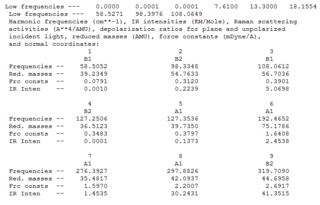 |
The .log output file for the molecules show that in each case the low frequencies were very close to 0 therefore the LANL2DZ basis set was suitable in calculating the second derivative of the potential energy surface. The vibrations for all 9 peaks of each molecule can be seen in the tables below.
| Vibration Number | Frequency/cm-1 | Intensity | Vibration Type | Point Group | Dipole Vectors |
|---|---|---|---|---|---|
| 1 | 66.98 | 0.00 | Au-Cl symmetric bend of all four Cl atoms. The trans Cl atoms move concertedly | B2u |  |
| 2 | 114.82 | 6.54 | Concerted bending of all four Cl atoms up while the Au atom moves down | A2u |  |
| 3 | 127.85 | 0.00 | Symmetric scissor-bending of all Cl atoms | B2g |  |
| 4 | 129.17 | 0.0112 | Concerted bending of two trans Cl atoms back and forth | Eu |  |
| 5 | 129.17 | 0.0112 | Concerted bending of two Cl atoms back and forth | Eu |  |
| 6 | 270.25 | 0.00 | Symmetric stretching of two trans Cl atoms towards the Au atom while the other two trans Cl atoms stretch away from the Au atom | B1g |  |
| 7 | 284.13 | 0.00 | Concerted symmetric stretching of all four Cl atoms | A1g |  |
| 8 | 320.50 | 42.54 | Asymmetric stretching of two trans Cl atoms | Eu |  |
| 9 | 320.50 | 42.54 | Asymmetric stretching of two trans Cl atoms | Eu |  |
As the point group of each molecule is different, the symmetry labels for the stretches will also be different so they can not be compared.
| Vibration Number | Frequency/cm-1 | Intensity | Vibration Type | Point Group | Dipole Vectors |
|---|---|---|---|---|---|
| 1 | 46.03 | 0.04 | Symmetric bending of both Cl and Br atoms. The Cl atoms move concertedly up and the Br atoms move concertedly down | B3u |  |
| 2 | 85.86 | 0.51 | Concerted bending of both Br atoms in one direction while the AuCl2 unit moves in the other direction | B2u |  |
| 3 | 102.67 | 3.83 | Concerted movement of both Cl atoms up while the Au atom moves down | B3u |  |
| 4 | 107.05 | 0.00 | Symmetric scissor-bending of the Br and Cl atoms. Greatest displacement by the Br atoms | B3g |  |
| 5 | 126.21 | 0.47 | Concerted bending of both Cl atoms in one direction while the AuBr2 unit moves in the other direction | B1u |  |
| 6 | 164.02 | 0.00 | Symmetric stretching of both Au-Br bonds | Ag |  |
| 7 | 217.33 | 20.91 | Asymmetric stretching of both Au-Br bonds | B1u |  |
| 8 | 278.52 | 0.00 | Symmetric stretching of both Au-Cl bonds | Ag |  |
| 9 | 320.60 | 40.24 | Asymmetric stretching of both Au-Cl | B2u |  |
| Vibration Number | Frequency/cm-1 | Intensity | Vibration Type | Point Group | Dipole Vectors |
|---|---|---|---|---|---|
| 1 | 58.51 | 0.00 | Symmetric bending of all four atoms | B1 |  |
| 2 | 98.33 | 0.22 | Twisting of AuCl3 unit anti-clockwise while the Br atom moves clockwise | B2 |  |
| 3 | 108.06 | 5.07 | Movement of all four halogen atoms up while the Au atom moves down. Greatest displacement is by the Cl atoms | B1 |  |
| 4 | 127.25 | 0.00 | Symmetric scissor-bending of all three Cl atoms while the Br atom remains stationary | B2 |  |
| 5 | 127.35 | 0.14 | Concerted bending of the trans Cl atoms while the AuClBr unit moves in the opposite direction | A1 |  |
| 6 | 192.47 | 2.45 | Symmetric stretching of the trans Cl and Br atoms | A1 |  |
| 7 | 276.39 | 1.45 | Symmetric stretching of the trans Cl atoms | A1 |  |
| 8 | 297.88 | 30.24 | Stretching of the Cl atom opposite the Br atom | A1 |  |
| 9 | 319.71 | 41.35 | Asymmetric stretching of two trans Cl atoms | B2 |  |
The tables above show the Au-halogen stretches are in the same region but as the molecule becomes less symmetric, more stretches are observed.
MO Analysis of the Gold Complexes
The molecular orbitals of the molecules can be compared, however they should all be very similar as Br and Cl are in the same group in the periodic table. The calculation was carried out using the B3LYP method and LANL2DZ basis set so it is consistent with the previous calculations.
| AuCl4- | AuCl2Br2- | AuCl3Br- | |
|---|---|---|---|
| File Type | .log | .log | .log |
| Calculation Type | SP | SP | SP |
| Calculation Method | RB3LYP | RB3LYP | RB3LYP |
| Basis Set | LANL2DZ | LANL2DZ | LANL2DZ |
| Charge | -1 | -1 | -1 |
| Spin | Singlet | Singlet | Singlet |
| E(RB3LYP) | -195.44 a.u. | -191.89 a.u. | -193.67 a.u. |
| Dipole Moment | 0.0000 Debye | 0.0000 Debye | 1.8183 Debye |
| Point Group | D4h | D2h | C2v |
| Job CPU Time | 0 days, 0 hours, 0 minutes, 13.8 seconds | 0 days, 0 hours, 0 minutes, 15.8 seconds | 0 days, 0 hours, 0 minutes, 15.8 seconds |
| DOI | DOI:10042/to-10858 | DOI:10042/to-10860 | DOI:10042/to-10861 |
The energies of the molecule have remained the same but there was no output for the RMS gradient. This could be because there is no change in gradient between the optimisation and the population density calculation.
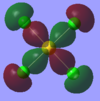
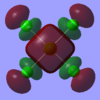
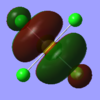
The MO diagram for the square-planar AuCl4- complex can be seen below. The orbitals shown have been mixed so the higher energy molecular orbitals have more contribution from the metal and the lower energy molecular orbitals have greater contribution from the ligands. Cl ligands are σ-donor ligands so only these orbitals are drawn on the MO diagram. The lower energy gold atomic orbitals are not shown on the MO diagram as these are too low in energy to have significant mixing.

The molecular orbitals for AuCl4- were viewed on GaussView and compared with the Linear Combination of Atomic Orbitals from the MO Diagram.
| MO | MO in Gaussian | LCAO MO | MO | MO in Gaussian | LCAO MO |
|---|---|---|---|---|---|
| 1a1g |  |
 |
2b1g LUMO |  |

|
| 1b1g |  |
 |
3a1g |  |
|
| 1eu |  |
 |
1a2u |  |

|
| 1eu |  |
 |
2eu |  |
|
| 2a1g (dz2) HOMO |  |
 |
2eu |  |

|
The calculation gave 54 orbitals in total, however most of these were from the lower energy bonding and antibonding molecular orbitals not seen on the diagram. When the MOs from the computational method and those from the LCAO method were compared, it was found that the shapes of the orbitals did not match exactly, however the closest matches were found and compared above. This may be because running the MO calculation using the D4h is too computationally demanding so the program uses a simpler point group to perform the calculations:

This shows that instead of running the calculation using the D4h point group, it was run using the D2h point group instead. This altered the molecular orbitals so the Gaussian MOs are not an exact match to the LCAO MOs. GaussView also shows lower energy molecular orbitals within other MOs so the shapes of the molecular orbitals look more complicated than the shapes of the LCAO MOs, as seen with the 1a2u orbital. Gold is also quite a heavy element which could affect the way the MOs are produced as Gaussian is more accustomed to dealing with lighter organic molecules.
It is clear that the computationally calculated HOMO is not similar in appearance at all to the LCAO HOMO. This may be because the program considers the higher energy chloride atomic orbitals to be involved in the MO diagram or the basis set used was not accurate enough. An extension of this mini-project could be to use a more complicated basis set to try and improve the accuracy of the MOs.
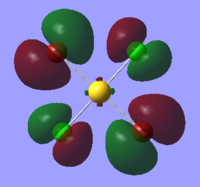
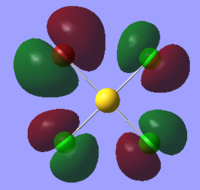
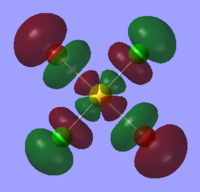
The computationally calculated HOMOs and LUMOs for the three molecules were also compared. As both Br and Cl are σ donor ligands, the LCAO MO diagram for the complexes should be the same. Therefore the HOMOs and LUMOs should look very similar to each other.
| Orbital | AuCl4- | AuCl2Br2- | AuCl3Br- |
|---|---|---|---|
| HOMO | 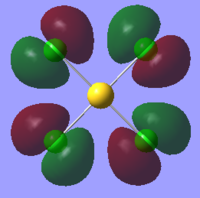 |
 |
|
| LUMO | 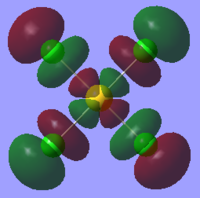 |
 |

|
The table above shows that the HOMOs and LUMOs are very similar for all three molecules. The orbitals around the bromine atoms are slightly larger than those around the chlorine atoms which is to be expected because Br is larger than Cl.
NBO Analysis
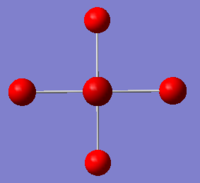
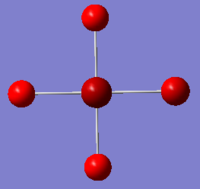
The charge distribution of each atom can be seen using natural bonding orbital analysis:
| AuCl4- | AuCl2Br2- | AuCl3Br- | |
|---|---|---|---|
| Charge by Colour | 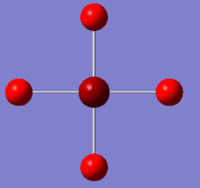 |
 |
|
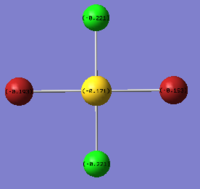
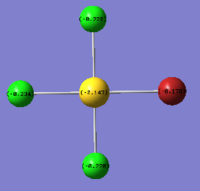
| Charge by Numbers | 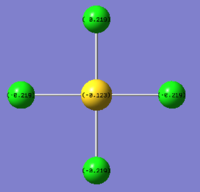 |
 |
|
The images above show the negative charge is distributed over the molecule for each of the complexes with most of the charge held evenly on the halogen atoms as they are electronegative species and can therefore easily accommodate the excess negative charge.
The NBO summaries below show how the electron density in each molecule is distributed:
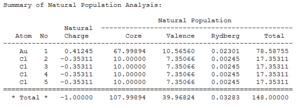 |
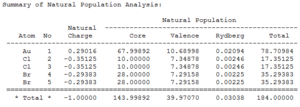 |
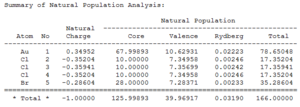 |
It can be seen that most of the electron density is held on the gold atom as this is the largest atom in the molecule.
The Second Order Perturbation Theory Analysis of Fock Matrix in NBO Analysis can also be found in the output file to see if there are any values greater than 20 kcalmol-1:
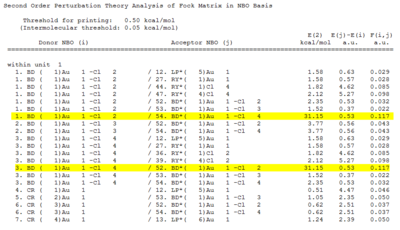 |
 |
Both AuCl4- and AuCl2Br2- showed energies of greater than 20kcalmol-1 however, AuCl3Br- did not within the same region.
With more time, the exact contributions of each atom to the bonds, and the hydridisation of the atoms could be found and compared to the hybridisation predicted from the LCAO and computationally calculated MOs.
Conclusion
The investigation of different halogenated square-planar gold complexes shows that pseudo-potential basis sets such as LANL2DZ can be used to optimise the structures and calculate the IR stretches and MOs of each molecule. The LANL2DZ basis set was used because Au and Br are heavy molecules so a more complex calculation must be used in order to obtain accurate results. The vibrational analysis showed that for each molecule, the basis set used was ideal and gave the expected results. However for the calculation of the MOs, the basis set used was not complicated enough and unexpected results were obtained. The three gold complexes all had different point groups which could clearly be seen in the IR analysis, however the point group of the molecule has no effect on the overall structure of the MOs; the only difference being the symmetry labels used to assign each orbital.
