Rep:Mod:PAH156
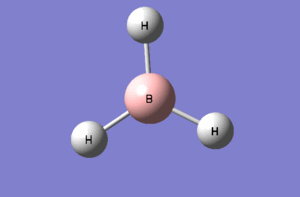
BH3 Optimisation
The aim of this exercise was to provide a relatively simple example upon which to experiment, and by doing so, to familiarise oneself with the program.
It is important at this stage to ask ourselves what exactly is taking place when we execute an optimisation, viz. two main processes:
- Firstly, with the nuclei in given positions, the Schrödinger equation is solved for the electron density of the molecule. This is known as the Self-Consistent Field (SCF) step.
- Having been performed once, the positions of the nuclei are now modified slightly; the SCF step is repeated at the new positions. This continues for some time until a wide range of geometries have been computed, with the lowest energy geometry being labelled the "optimised" molecule.
The molecule of BH3 is constructed simply enough in GaussView, and for our purposes the bond distances are set to 1.5 Å. For our first and relatively simple case, we are using the density functional theory (DFT) method with basis set B3LYP. The calculation is then fed into Gaussian, yielding the results below.
| Category | Answer |
|---|---|
| File type | .log |
| Calc. type | FOPT |
| Calc. method | RB3LYP |
| Basis set | 3-21G |
| Final energy | -26.46226338 a.u. |
| Gradient | 0.00020672 a.u. |
| Dipole moment | 0.0000 D |
| Point group | D3H |
| Comp. time | 1 min 14 secs |
| Bond angle | 120.000 |
| Bond distance | 1.19 Å |
Table 1 - Simple optimisation of BH3
The larger the value of the gradient, the less likely it is that the optimisation ran to completion. For most purposes, a gradient value less than 0.001 suggests a complete optimisation; as can be seen from Table 1, in this instance it appears our process ran to completion. Below is an extract from the full output text file, copied here as a means of indicating that the optimisation is complete.
Item               Value     Threshold  Converged?
 Maximum Force            0.000413     0.000450     YES
 RMS     Force            0.000271     0.000300     YES
 Maximum Displacement     0.001610     0.001800     YES
 RMS     Displacement     0.001054     0.001200     YES
 Predicted change in Energy=-1.071764D-06
 Optimization completed.
    -- Stationary point found.
So far we have covered only a simple example. To improve our results, we can modify the computations by using more complex basis sets. By adding in more basis functions, we will arrive at a more accurate result. The disadvantage to this, of course, comes in the increased computing time required to deal with the extra functions. Our computational chemistry is thus a careful balancing act between the need to have accurate results and the need to reduce computing time and usage.
The previous optimisation, while by no means entirely accurate due to the settings applied, gives us a good starting place for further optimisations. We will do one such optimisation on our BH3 molecule using a different basis set, this time 6-31G(d,p), a more complex set.
| Category | Answer |
|---|---|
| File type | .log |
| Calc. type | FOPT |
| Calc. method | RB3LYP |
| Basis set | 6-31G(d,p) |
| Final energy | -26.61532252 a.u. |
| Gradient | 0.00021672 a.u. |
| Dipole moment | 0.0000 D |
| Point group | D3H |
| Comp. time | 1 min 6 secs |
| Bond angle | 120.000 |
| Bond distance | 1.19143 Å |
Table 2 - A more complex optimisation of BH3
Our value for the gradient is not dissimilar to the previous optimisation, therefore we can conclude it is likely that the optimisation ran to completion. This is confirmed by the full text of the output file, the relevant section of which is provided here:
Item Value Threshold Converged?

Maximum Force            0.000433     0.000450     YES
 RMS     Force            0.000284     0.000300     YES
 Maximum Displacement     0.001702     0.001800     YES
 RMS     Displacement     0.001114     0.001200     YES
 Predicted change in Energy=-1.189019D-06
 Optimization completed.
    -- Stationary point found.
We will return to this optimisation later on, but for now, we must put it aside for a quick excursion to a heavier molecule.
GaBr3
For this molecule, our methods used above will no longer be sufficient: the atoms are too heavy and have too many electrons. Simply solving the Schrödinger equation will not take into account the relativistic effects experienced by these atoms, so we must compensate. It is safe to assume that any bonding interactions are controlled by valence electrons, and by using this assumption we can model the inner electrons of an atom using a function named a pseudo-potential. This greatly simplifies the mathematics and provides much relief in terms of calculation complexity and required computing time. It is important to limit their use to circumstances in which they are actually necessary (due to the time required in some cases), or for heavier atoms where the slight reduction in accuracy is less severe.
This example shows similar geometry to BH3, but we will see there are some significant differences between the two molecules. Additionally, in this instance we will specify the symmetry (D3H) and keep it within a very tight tolerance - this is to prevent later difficulties with MOs. The basis set in use this time is a medium level basis set "LanL2DZ" - more accurate ones could be used at the cost of increased computing time. This calculation will be run on the College high-performance computing system to ensure a prompt and speedy return of the desired results. Consequently, the resultant calculation will also be published to D-space.[1]
| Category | Answer |
|---|---|
| File type | .log |
| Calc. type | FOPT |
| Calc. method | RB3LYP |
| Basis set | LANL2DZ |
| Final energy | -41.69989295 a.u. |
| Gradient | 0.00402846 a.u. |
| Dipole moment | 0.0000 D |
| Point group | D3H |
| Comp. time | 29.4 secs |
| Bond angle | 120.000 |
| Bond distance | 2.39000 Å |
Table 3 - Pseudo-potential optimisation of GaBr3
The link to this calculation can be found here: DOI:10042/25186
The relevant Item table from the full output file is given below, and confirms the optimisation proceeded to completion.
Item               Value     Threshold  Converged?
 Maximum Force            0.000000     0.000450     YES
 RMS     Force            0.000000     0.000300     YES
 Maximum Displacement     0.000003     0.001800     YES
 RMS     Displacement     0.000002     0.001200     YES
 Predicted change in Energy=-1.282675D-12
 Optimization completed.
    -- Stationary point found.
As stated in Table 3, for the optimised molecule the bond angle is 120.000° and the bond distance is 2.39000 Å. According to the literature, however, the bond lengths are 2.239 ± 0.007 Å at 357 K, a figure obtained through the use of gas-phase electron diffraction.[2]
BBr3
We now return to a optimisation we made earlier, that of BH3 using the 6-31G(d,p) basis set. Instead of continuing with this particular molecule, we now change our H atoms into Br atoms - the benefit here is that we are using the results of a previous optimisation, which provides us a kind of advanced staging-post for this next optimisation. This particular computation requires more user input than previously, since GaussView is unable to provide us with what we need. In this instance, we specify that the calculation on Boron is to be run with a standard basis set (6-31G(d,p)), while the Br atoms are run using pseudo-potentials (LanL2DZ). The results of this optimisation are shown below.
| Category | Answer |
|---|---|
| File type | .log |
| Calc. type | FOPT |
| Calc. method | RB3LYP |
| Basis set | Gen |
| Final energy | -64.43645296 a.u. |
| Gradient | 0.00000382 a.u. |
| Dipole moment | 0.0000 D |
| Point group | D3H |
| Comp. time | 38.7 secs |
| Bond angle | 120.000 |
| Bond distance | 1.933396 Å |
Table 4 - A mixed optimisation of BBr3 using Gen basis set
The D-Space link for BBr3 can be found here: DOI:10042/25196
Item               Value     Threshold  Converged?
 Maximum Force            0.000008     0.000450     YES
 RMS     Force            0.000005     0.000300     YES
 Maximum Displacement     0.000036     0.001800     YES
 RMS     Displacement     0.000023     0.001200     YES
 Predicted change in Energy=-4.027676D-10
 Optimization completed.
    -- Stationary point found.
As can be seen from this extract, the optimisation ran to completion, and our results are sound.
Comparisons of the results so far
Having completed several optimisations so far, this section will collate the important results obtained and comment upon them. One of the most important differences between the molecules comes is in their bond distances. Table 5 shows these.
| Molecule | Distance |
|---|---|
| BH3 | 1.19 Å |
| BBr3 | 1.93 Å |
| GaBr3 | 2.39 Å |
Table 5 - Bond distances
As expected, the bond distances differ for each compound, but the causes of these differences are different in magnitude and origin. We will examine the chief causes of change in turn:
- We can modify the ligands attached to the central atom:
- As can be seen from Table 5, the value for BBr3 is approximately 62% larger than the the value for BH3. In this example we are swapping H for Br; let us consider their differences (though they are both ligands of the same type). H atoms are very small, and have little capability for attracting electron density - they can thus fit closer in to the central atom and do not stretch the bond by pulling electron density away. Br atoms, on the other hand, are larger and more electronegative. Their size prevents the bromine atoms from occupying space too close to the central atom due to steric factors, while the high electronegativity pulls electron density away from the central atom, stretching and elongating the bond.
- Bond distance and bond strength also depends on the orbital overlap between the atoms; a strong, short bond relies on a good orbital overlap. H atoms are of a size not dissimilar to B, and consequently the orbitals are of similar size and have a reasonable overlap. Since Br is a larger atom, the orbitals are correspondingly larger; given the size of the central boron, the larger orbitals of the Br atoms have a poor size match with the B orbitals and the bond is weaker and longer, as predicted.
- We can also modify the central atom:
- Both atoms are members of the same group, and have similar valence electron situations. They are both Lewis acids when in their trihalide forms, but in this instance we are more interested in the differences than the similarities.
- Ga, however, is a larger atom than boron, and thus the bonded atoms are held at greater distance through steric factors. Weaker attraction from the nuclear charge, which is further shielded, also plays a role. In addition, the valence orbitals of Ga are larger and more diffuse than those of boron, meaning that the overlap with the ligand orbitals is poorer and weaker - thus weakening and elongating the bond.
At this time, it is sensible to discuss bonding and GaussView's approach to the matter. A chemical bond is the state in which the forces between atoms are sufficient to form an aggregate with an acceptable degree of stability - these aggregates are compounds.[3] Through the use of modern Molecular Orbital theory we have come to understand the changes in electron density and orbitals which are caused by the formation of bonds between atoms. Rather than being tethered to their original atoms, when atoms form bonds the electrons occupy new molecular orbitals and depend on the motion of the nuclei in the molecule, rather than the nucleus of the atom from which they originate. Consequently there will be a measurable energy difference which we can measure experimentally in order to determine the degree of bonding in a certain molecule. Computational chemistry allows us to compare energies of systems, assuming all settings, basis sets and prerequisites are the same.
We typically see bonds as either there or not there, since it is very hard to observe items such as transition states, in which bonds and neither quite made nor broken at the same time. GaussView takes a different line on the issue - bonds are drawn as an aid, and the absence of a drawn bond does not indicate the absence of a bond. Rather, it has a predetermined value of bond distance over which it will not draw them in, yet there is still bonding character present.[1] GaussView is only designed to be a visual tool to aid understanding of the numbers provided - a truer perspective on the bonding characteristics between two atoms can be obtained from the raw data provided.
BH3 frequency analysis
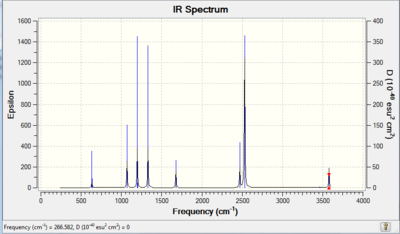
Now that we have performed some optimisations, it is important to ensure that they ran correctly. For our results to be accurate, we want data on the optimised molecule at its ground state, i.e. the lowest point on its potential energy surface. We can ensure this by looking at the second derivative of our functions - if the values are all positive, then we have arrived at a minimum point. To do this in Gaussian, we will now perform a frequency analysis on the BH3 we optimised with the P-31G basis set earlier. The frequency analysis also serves another purpose, in that it is able to provide us with Raman and IR predicted data; this is very useful, since it is an easy means through which we can compare our computationally predicted values with experimentally determined results. This results of this procedure are shown below in Tables 6 & 7 - the resultant predicted IR spectrum is shown in a thumbnail.

| Category | Answer |
|---|---|
| File type | .log |
| Calc. type | FOPT |
| Calc. method | RB3LYP |
| Basis set | 6-31G(d,p) |
| Final energy | -26.61532363 a.u. |
| Gradient | 0.00000237 a.u. |
| Dipole moment | 0.0000 D |
| Point group | D3H |
| Comp. time | 38 secs |
Table 6 - A frequency analysis of our pre-optimised BH3
From the log file, it is possible to locate the low frequencies - more on this later.
Low frequencies --- -0.9033 -0.7343 -0.0055 6.7375 12.2491 12.2824
Low frequencies --- 1163.0003 1213.1853 1213.1880
The frequency analysis yielded these predicted IR results, presented in the table below:
Table 7
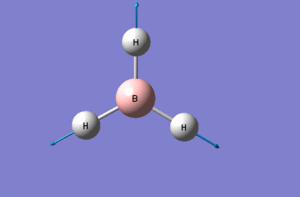
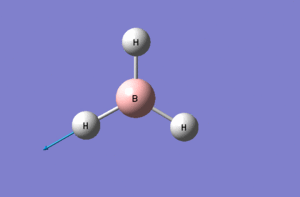
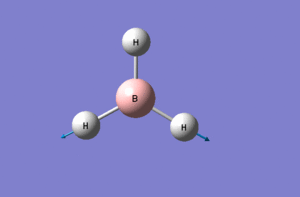
It is clear upon examination of the IR spectrum above that, despite there being six frequencies displayed, there are not six peaks visible. Indeed it appears to contain only three peaks, but this is easy to explain: there are two pairs of vibrations ( Nos. 2&3, 5&6 in Table 7), which yield two peaks, and one peak for the wagging vibration (No. 1). There is no visible peak for the symmetrical stretch (No. 4) as it is not IR active. Note that all frequencies and intensities are rounded to integer values to account for the error resulting from the system.
GaBr3 frequency analysis and comparison
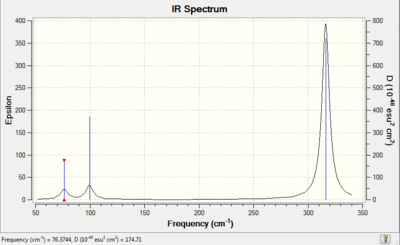
Now that we have done one frequency analysis, it makes sense to do some more! We return to an old acquaintance, namely GaBr3. This procedure is again run using pseudo-potentials and is run on the HPC system. The frequency analysis results are presented here.
| Category | Answer |
|---|---|
| File type | .log |
| Calc. type | FOPT |
| Calc. method | RB3LYP |
| Basis set | LANL2DZ |
| Final energy | -41.70082783 a.u. |
| Gradient | 0.00000011 a.u. |
| Dipole moment | 0.0000 D |
| Point group | D3H |
| Comp. time | 16.6 secs |
Table 8 - Frequency analysis of GaBr3
The D-space link can be found here: DOI:10042/25244
Below is an extract from the files, showing the low frequencies:
Low frequencies --- -0.5252 -0.5247 -0.0024 -0.0010 0.0235 1.2010
Low frequencies --- 76.3744 76.3753 99.6982
Comparison with literature for GaBr3 shows that the spectrum obtained is accurate.[4] The IR values obtained for this molecule are provided in the table below.
| No. | Form of the vibration | Frequency | Intensity | Symmetry C3v |
|---|---|---|---|---|
| 1 |  |
76 | 3 | E' |
| 2 | 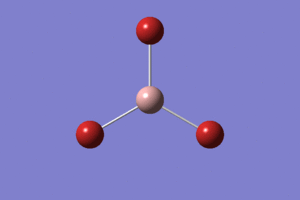 |
76 | 3 | E' |
| 3 |  |
100 | 9 | A1' |
| 4 | 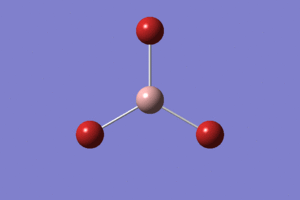 |
197 | 0.0 | A2" |
| 5 |  |
316 | 57 | E' |
| 6 | 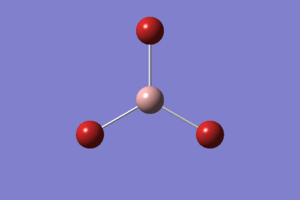 |
316 | 57 | E' |
Table 9
Now that we have both sets of results, we can compare the IR data for both BH3 and GaBr3
| BH3 | GaBr3 | |||
|---|---|---|---|---|
| Frequency | Intensity | Frequency | Intensity | |
| 1 | 1163 | 92 | 76 | 3 |
| 2 | 1213 | 14 | 76.38 | 3.3447 |
| 3 | 1213 | 14 | 100 | 9 |
| 4 | 2582 | 0.0 | 197 | 0.0 |
| 5 | 2715 | 126 | 316 | 57 |
| 6 | 2715 | 126 | 316 | 57 |
Table 10 - A comparison of IR data.
These data provide interesting reading; we can clearly see a trend in the IR spectra, but also some differences. It is worth discussing some theory behind IR before proceeding. The formula which we will discuss is:
The weaker the bond force constant or the higher the reduced mass, the lower the frequency. This is exemplified by these results, which we shall discuss here:
- Perhaps most noticeable is that the frequency values for GaBr3 are considerably smaller than for BH3. Given the equation above, we can conclude that GaBr3 has a weaker force constant and/or a higher reduced mass. We know that GaBr3 is a considerably larger molcule, consequently its reduced mass will be far larger. This is the primary cause of the shifts in frequency in these spectra.
- The IR spectra yielded by the frequency analyses (see thumbnails above), as might be expected, appear fairly similar. Though the intensities are different, the general shape is more or less the same - the peaks are in the same positions relative to each other in both spectra (though in GaBr3 with the wavenumbers of the peaks much lower and the gap between peaks correspondingly smaller). This tells us that the bonding in the two molecules is similar, but of differing strengths.
- It is important to note that there has been a reordering of the modes in the IR spectra - the two entries in Table 9 highlighted in yellow belong to the same type of vibration, yet are ordered differently by Gaussian. The answer lies in the nature of the vibration and the substituent groups' effect upon one another. As the groups are moving concertedly, they remain relatively close to each other at all times - this means that there is a strong effect from the Pauli repulsive forces. Since these arise from the electrons, the repulsive forces in GaBr3 are much higher due to the greater number of electrons present in the system. It is this extra repulsion which increases the energy of the molecule and thus raises its frequency in the IR.
- There are two pairs of vibrations which lie close in energy, the A2" and E' modes and the A1' and E' modes, of which the latter pair is higher in energy. This is due to the nature of the vibrations in question; the lower modes are "wagging" while the higher energy modes are stretching, and since it is easier to bend the bonds of a molecule than to stretch them, the stretching modes are higher in energy.
Now that we have completed a few computations, there are some important points to address:
- It is extremely important never to compare two calculations run with different basis sets or methods - any attempt to do so would yield meaningless results (it may well be that the result from such a calculation is correct; we merely have no way of telling if it is!. When the basis sets are modified, the shape of the potential energy surface on which the calculations are based also changes; a molecule which was at a minimum in a previous basis set may no longer be at a minimum in the new set's energy surface.
- Why are we carrying out frequency analyses? Gaussian is able to compute the vibrations for a particular molecule and produce a predicted IR/Raman spectrum and a wealth of useful data. The data allow us to determine if the optimisation had gone to completion, or if it had stopped at a transition state; this is done by looking in the data for the presence of any negative frequencies. We can also see the presence of a minimum, which will show that the optimisation ran to completion.
- The low frequencies reported in a frequency analysis represent the lowest modes available to that molecule (regardless of sign), and offer a good place to check with experimental evidence. If experiment suggests a mode lower than the low frequencies mentioned by Gaussian, it is likely that the molecule has been improperly optimised.[5] It is important to point out, however, that values very close to zero have little effective meaning - it can be very difficult to tell if they are genuine results or merely artifacts. Additionally, unless told to ignore them, any low-lying electronic levels present will be included by Gaussian, so care must be taken when setting up a calculation or analysing its results.
BH3 molecular orbital analysis
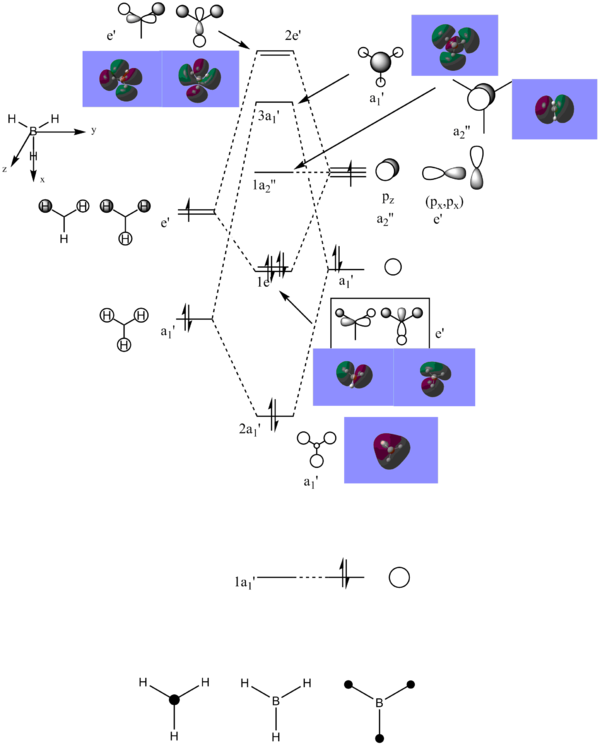
So far our calculations have centred around optimisations and frequency analyses, but Gaussian also allows the user to compute the electronic structures of molecules and produce the molecular orbitals. GaussView is able to display these orbitals graphically. A population analysis to obtain the MOs of BH3 was undertaken, and the result is shown below in the form of an MO diagram:
The file on D-Space for the population analysis can be found here: DOI:10042/25260
It is interesting to compare the differences between the drawn out LCAOs and the orbitals provided by GaussView - while the LCAO drawings offer a picture of a set of separate orbitals of the same phase, the real orbitals provided by GaussView show that these orbitals combine where applicable into one. In addition, the locations of the nodes in the orbitals are more pronounced, one can clearly see them. Consider the 2e' orbitals on the diagram: the LCAO drawings show lobes of different phases touching, whereas the Gaussview orbitals show clear and defined gaps between them. On the whole, Gaussview provides a more thorough and realistic look at the orbitals; this does not mean that qualitative MO theory is "worse" than Gaussian. Qualitative MO theory allows us to gain an understanding of the shapes of molecular orbitals without expending the time and effort necessary to obtain more accurate results through Gaussian, and indeed it provides results of acceptable accuracy. It is a worthy accompaniment to tackling the orbitals computationally.
NH3
Now that we have examined the molecular orbitals of our molecules, we can move on to examining other properties. In this instance, we shall undertake a Natural Bond Analysis of an entirely new molecule, namely ammonia. The purpose of the NBO is to determine various charge properties of the molecule, i.e. where the charges are distributed. Before this can commence, however, an optimisation must be done, and also a frequency analysis to determine whether our optimisation was successful. Below is the data from the optimisation:
| Category | Answer |
|---|---|
| File type | .log |
| Calc. type | FOPT |
| Calc. method | RB3LYP |
| Basis set | 6-31G(d,p) |
| Final energy | -56.55776863 a.u. |
| Gradient | 0.00000289 a.u. |
| Dipole moment | 1.8464 D |
| Point group | C3v |
| Comp. time | 1 min 22 secs |
| Bond angle | 105.746° |
| Bond distance | 1.01797 Å |
Table 11 - The first optimisation of NH3
Item Value Threshold Converged?
Maximum Force            0.000024     0.000450     YES
 RMS     Force            0.000012     0.000300     YES
 Maximum Displacement     0.000079     0.001800     YES
 RMS     Displacement     0.000053     0.001200     YES
 Predicted change in Energy=-1.629715D-09
 Optimization completed.

-- Stationary point found.
The frequency analysis of NH3 yielded these results (IR spectrum in thumbnail above):
The D-space link for this analysis can be found here: DOI:10042/25312
| No. | Form of the vibration | Frequency | Intensity | Symmetry C3v |
|---|---|---|---|---|
| 1 |  |
1090 | 145 | A1 |
| 2 |  |
1694 | 14 | E |
| 3 | 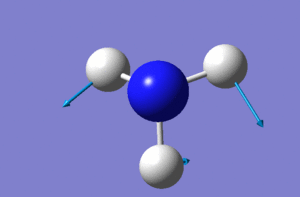 |
1694 | 14 | E |
| 4 | 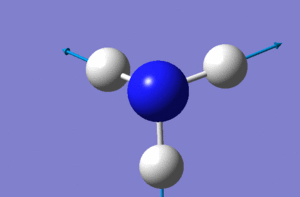 |
3461 | 1 | A2 |
| 5 | 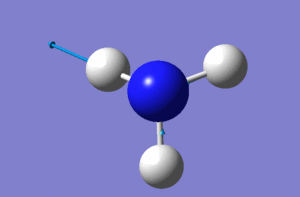 |
3590 | 0 | E |
| 6 | 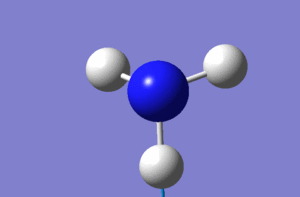 |
3590 | 0 | E |
Table 12
The low frequencies are presented below, and there are no negative frequencies in the second section, so we can determine that the optimisation was completed. While a low frequency range of 15 cm^-1 is desirable, the quality of the basis set we are using makes this difficult to achieve. Given this, the low frequencies are acceptably low.
Low frequencies --- -11.6527 -11.6490 -0.0045 0.0333 0.1312 25.5724

Low frequencies --- 1089.6616 1694.1736 1694.1736
Having performed the optimisation and checked that it was valid, we can proceed on to the NBO analysis itself. Care must be taken to ensure the same basis set is used as in the previous optimisation. The D-space link for this step can be found here: DOI:10042/25319
The thumbnail picture shows a coloured representation of the charge distribution in an ammonia molecule, in a range between -1.125 and 1.125. The values are given below the image.
 |
| Atom | Charge |
|---|---|
| N | -1.125 |
| H | 0.375 |
NH3BH3 analysis
In this section we will examine the bond association energy of the molecule ammonia-borane (borazane). This compound is currently of interest due to its potential as a hydrogen fuel source.[1] The bond formed between the nitrogen and boron atoms is a dative bond in which the nitrogen formally donates an electron pair to the boron atom, but this is useful only as a means of keeping track of the electron count. Rather, the electrons are shared in complex molecular orbitals. To reveal the value of the bond association energy, we need to know the energies (calculated from the same basis set!) of the reactants and products - the reactants in this case are the molecules we have previously met in this exercise, viz. BH3 and NH3. We therefore need only calculate the energy of the product, NH3BH3, and we will know the bond energy.
The starting procedure is, as always, to optimise our new molecule, with care taken to ensure the correct basis set is being used. The results of this are shown below in Table 12.
| Category | Answer |
|---|---|
| File type | .log |
| Calc. type | FOPT |
| Calc. method | RB3LYP |
| Basis set | 6-31G(d,p) |
| Final energy | -83.22469007 a.u. |
| Gradient | 0.00006839 a.u. |
| Dipole moment | 5.5653 D |
| Point group | C1 |
| Comp. time | 1 min 38.1 secs |
Table 13 - Ammonia-borane optimisation
The link to this on D-space can be found here:DOI:10042/25324
Item Value Threshold Converged?
Maximum Force            0.000139     0.000450     YES
 RMS     Force            0.000063     0.000300     YES
 Maximum Displacement     0.000771     0.001800     YES
 RMS     Displacement     0.000338     0.001200     YES
 Predicted change in Energy=-2.028054D-07
 Optimization completed.

-- Stationary point found.
The optimisation has converged, and we can move on to a frequency analysis. The link to the frequency analysis on D-space can be found here:DOI:10042/25326
Low frequencies --- 0.0009 0.0010 0.0014 19.0327 23.6880 42.9723
Low frequencies --- 266.5858 632.3792 639.4620
These values for the low frequencies are within acceptable boundaries, given the basis set in use. We can see that the optimisation ran to completion through the lack of negative frequencies on the second row. We now have all three energy values required to calculate the bond association energy, and this is performed below:
E(NH3) = -56.55776863 a.u.
E(BH3) = -26.61532252 a.u.
E(NH3BH3) = -83.22469007 a.u.
ΔE=E(NH3BH3)-[E(NH3)+E(BH3)] = -0.05159892 a.u.
It is standard to report bond energies in kJ/mol, so this value in atomic units is converted to give:
Association energy = -135.5 kJ/mol
We must now ask ourselves, is this figure within expected values? In this case, it is - we are expecting a bond energy of this magnitude, so we can conclude that our input was valid and the computations ran successfully. This is, however, still a computed value - comparison with literature is essential. A value obtained by different computational means of 103.34 kJ/mol (originally 24.7 kcal/mol) was located, and our value is not too dissimilar to this - our experiment appears to have been successful.[6]
- This particular reference concludes that the molecule is in fact a complex held together by strong van der Waals interactions, something we are unable to determine without further experiment.
Second Week Mini Project - S/Se N/P clusters
The aim of this mini-project will be to examine and analyse various clusters of sulphur, selenium, nitrogen and phosphorous through computational means. This will build on the knowledge obtained through Second Year main group lectures, and attempt to find out differences caused by substituting atoms in the molecules. Sulphur and nitrogen containing heterocycles (and by extension compounds also containing selenium and phosphorous) are of increasing interest at the moment, and offer some fine examples of interesting bonding and structures. We will look at a group of similar molecules and attempt to determine any trends amongst them; if any are present, we shall attempt to ascertain the reasons behind them. It is crucial to note that some of the molecules are theoretical in nature, but since this is a computational exercise, we can include them - any trends present in existent molecules would likely transfer on to theoretical ones.
S2N2
Our group of molecules will be analogues of S2N2, starting with the aforementioned molecule. Having drawn out a molecule of S2N2 in GaussView, we can run an optimisation; since our atoms are not terribly large, we can perform this analysis with a 6-31G(d,p) basis set. The summary of this optimisation is presented below:
| Category | Answer |
|---|---|
| File type | .log |
| Calc. type | FOPT |
| Calc. method | RB3LYP |
| Basis set | 6-31G(d,p) |
| Final energy | -905.76529862 a.u. |
| Gradient | 0.00019021 a.u. |
| Dipole moment | 0.0026 D |
| Point group | C1 |
| Comp. time | 2 min 41.1 secs |
Item               Value     Threshold  Converged?
 Maximum Force            0.000308     0.000450     YES
 RMS     Force            0.000176     0.000300     YES
 Maximum Displacement     0.000850     0.001800     YES
 RMS     Displacement     0.000504     0.001200     YES
 Predicted change in Energy=-4.984279D-07
 Optimization completed.
    -- Stationary point found.
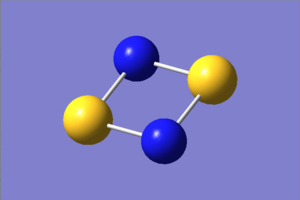
The text file of the optimisation confirms that the optimisation reached a stationary point. At this point, we can obtain the bond distances and angles from inspection in GaussView; these are provided below:
| Item | Value |
|---|---|
| Bond dist. | 1.66 Å |
| Angle S-N-S | 89.8° |
| Angle N-S-N | 90.2° |
The result of the optimisation shows a planar molecule in GaussView (see picture) with similar bond lengths around all sides - this is highly suggestive of its aromatic nature (which we know it to have). Our value of bond distance has a good agreement with literature values (1.651/1.657 Å) as do the angles (89.58° and 90.42°).[7]
We have obtained a stationary point, but in order to confirm that we have obtained a minimum, we must perform a frequency analysis:
| Category | Answer |
|---|---|
| File type | .log |
| Calc. type | FREQ |
| Calc. method | RB3LYP |
| Basis set | 6-31G(d,p) |
| Final energy | -905.76529862 a.u. |
| Gradient | 0.00019019 a.u. |
| Dipole moment | 0.0026 D |
| Point group | C1 |
| Comp. time | 1 min 25 secs |
The D-space link for this analysis can be found here: DOI:10042/25484
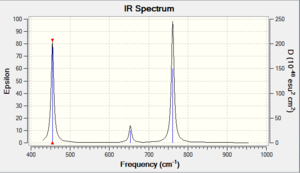
| No. | Form of the vibration | Frequency | Intensity |
|---|---|---|---|
| 1 |  |
455 | 24 |
| 2 | 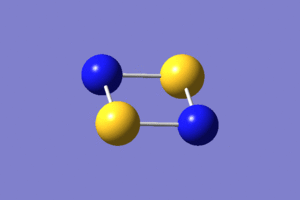 |
633 | 0 |
| 3 | 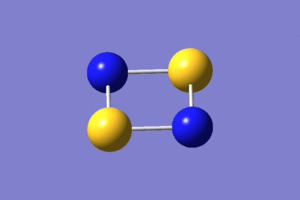 |
653 | 4 |
| 4 |  |
761 | 29 |
| 5 | 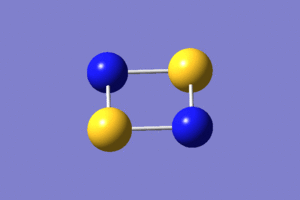 |
924 | 0 |
| 6 |  |
930 | 0 |
The log file can be found here
Low frequencies --- -21.3656 -14.0792 -1.9616 0.0024 0.0043 0.0051
Low frequencies --- 454.7267 633.0584 653.2658
We can see from the values of the low frequencies that we have reached a minimum, and not a transition state. The values in the first section are within acceptable boundaries, given the limitations of the basis set in use.
SSeN2
Now that we have gathered some data on S2N2, let us now see what happens if we substitute one of the atoms for another; in this case, one of the sulphur atoms for a selenium atom. We will perform an optimisation on this molecule using the same basis set and method as above, and then a frequency analysis. The summary is presented below:

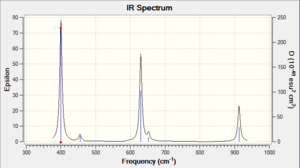
| Category | Answer |
|---|---|
| File type | .log |
| Calc. type | FOPT |
| Calc. method | RB3LYP |
| Basis set | 6-31G(d,p) |
| Final energy | -2906.95379546 a.u. |
| Gradient | 0.00021210 a.u. |
| Dipole moment | 0.5857 D |
| Point group | C1 |
| Comp. time | 3 min 48 secs |
Item               Value     Threshold  Converged?
 Maximum Force            0.000355     0.000450     YES
 RMS     Force            0.000155     0.000300     YES
 Maximum Displacement     0.000557     0.001800     YES
 RMS     Displacement     0.000288     0.001200     YES
 Predicted change in Energy=-3.559496D-07
 Optimization completed.
    -- Stationary point found.
From mere inspection of the optimised molecule in GaussView, we can begin to notice some differences - the selenium atom is warping the shape of the molecule out of the more square-like shape seen in S2N2. A table of bond angles and distances is provided below:
| Item | Value |
|---|---|
| Bond distance N-S | 1.64 Å |
| Bond distance N-Se | 1.84 Å |
| Angle S-N-Se | 90.1° |
| Angle N-S-N | 96.4° |
| Angle N-Se-N | 83.4° |
A frequency analysis is necessary to determine that we have indeed arrived at a minimum: Frequency analysis log file
| Category | Answer |
|---|---|
| File type | .log |
| Calc. type | FREQ |
| Calc. method | RB3LYP |
| Basis set | 6-31G(d,p) |
| Final energy | -2906.95379546 a.u. |
| Gradient | 0.00021209 a.u. |
| Dipole moment | 0.5857 D |
| Point group | C1 |
| Comp. time | 2 min 12 secs |
| No. | Form of the vibration | Frequency | Intensity |
|---|---|---|---|
| 1 |  |
400 | 23 |
| 2 | 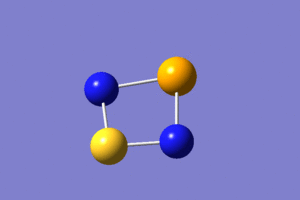 |
455 | 1 |
| 3 | 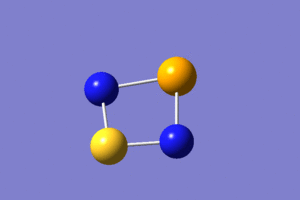 |
630 | 16 |
| 4 |  |
652 | 1 |
| 5 | 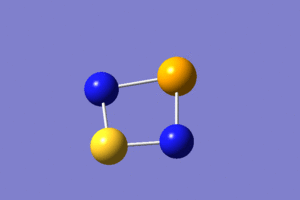 |
871 | 0 |
| 6 | 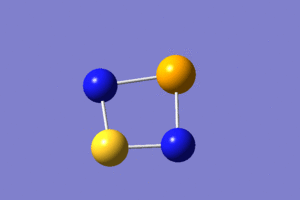 |
913 | 7 |
Low frequencies --- -20.8215 -9.9125 0.0135 0.0150 0.0174 12.1993
Low frequencies --- 399.7899 454.6910 629.8717
These low frequencies are acceptable, the optimisation reached a minimum.
S2NP
We now substitute a nitrogen atom for a phosphorous and repeat the process.
The log file can be found here
| Category | Answer |
|---|---|
| File type | .log |
| Calc. type | FOPT |
| Calc. method | RB3LYP |
| Basis set | 6-31G(d,p) |
| Final energy | -1192.42316111 a.u. |
| Gradient | 0.00020143 a.u. |
| Dipole moment | 1.4867 D |
| Point group | C1 |
| Comp. time | 4 min 13 secs |
Item               Value     Threshold  Converged?
 Maximum Force            0.000370     0.000450     YES
 RMS     Force            0.000152     0.000300     YES
 Maximum Displacement     0.001453     0.001800     YES
 RMS     Displacement     0.000589     0.001200     YES
 Predicted change in Energy=-6.047381D-07
 Optimization completed.
    -- Stationary point found.


The table of bond data is available below; it is clear to see that the molecule has been changed considerably by the substitution. The molecule has been pulled out of its square structure into a more "kite-like" shape, and there is now significant disparity in the bond lengths and angles, which will prove important in later analyses.
| Item | Value |
|---|---|
| Bond distance N-S | 1.67 Å |
| Bond distance S-P | 2.12 Å |
| Bond angle S-P-S | 75.5° |
| Bond angle P-S-N | 91.3° |
| Bond angle S-N-S | 102.0° |
The frequency analysis: The log file is available here
| Category | Answer |
|---|---|
| File type | .log |
| Calc. type | FREQ |
| Calc. method | RB3LYP |
| Basis set | 6-31G(d,p) |
| Final energy | -1192.42316111 a.u. |
| Gradient | 0.00020147 a.u. |
| Dipole moment | 1.4867 D |
| Point group | C1 |
| Comp. time | 1 min 18 secs |
| No. | Form of the vibration | Frequency | Intensity |
|---|---|---|---|
| 1 | 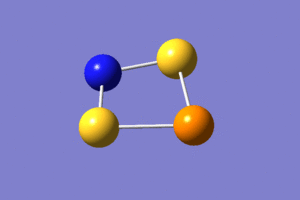 |
347 | 6 |
| 2 |  |
456 | 0 |
| 3 |  |
468 | 8 |
| 4 | 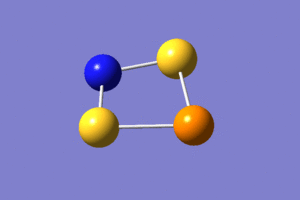 |
526 | 1 |
| 5 |  |
772 | 30 |
| 6 | 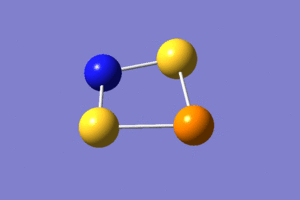 |
868 | 7 |
Low frequencies --- -3.8029 -0.0047 -0.0030 0.0037 15.6999 20.3651
Low frequencies --- 346.9777 456.0051 468.0623
The low frequencies are within acceptable limits.
Se2P2
We will now tackle the exact "opposite" of our starting molecule S2N2, in that all the atoms have been substituted for the relevant Se or N atom. The process is repeated as before:
The log file can be found here
| Category | Answer |
|---|---|
| File type | .log |
| Calc. type | FOPT |
| Calc. method | RB3LYP |
| Basis set | 6-31G(d,p) |
| Final energy | -5481.51300679 a.u. |
| Gradient | 0.00006979 a.u. |
| Dipole moment | 0.0009 D |
| Point group | C1 |
| Comp. time | 5 min 4 secs |
Item               Value     Threshold  Converged?
 Maximum Force            0.000148     0.000450     YES
 RMS     Force            0.000046     0.000300     YES
 Maximum Displacement     0.000783     0.001800     YES
 RMS     Displacement     0.000567     0.001200     YES
 Predicted change in Energy=-1.409908D-07
 Optimization completed.
    -- Stationary point found.
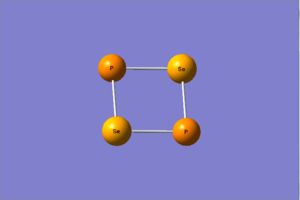
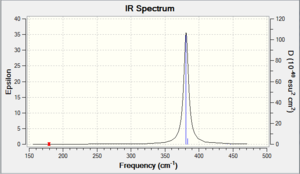
The bond data (provided below) show a similar molecular shape to S2N2, slightly parallelogram in nature, though the bond distances are predictably longer, though uniform around the molecule.
| Item | Value |
|---|---|
| Bond distance P-Se | 2.23 Å |
| Bond angle Se-P-Se | 88.6° |
| Bond angle P-Se-P | 91.4° |
A frequency analysis is run: The log file can be found here
| Category | Answer |
|---|---|
| File type | .log |
| Calc. type | FREQ |
| Calc. method | RB3LYP |
| Basis set | 6-31G(d,p) |
| Final energy | -5481.51300679 a.u. |
| Gradient | 0.00006977 a.u. |
| Dipole moment | 0.0009 D |
| Point group | C1 |
| Comp. time | 2 min 42 secs |
| No. | Frequency | Intensity |
|---|---|---|
| 1 | 180 | 0 |
| 2 | 225 | 0 |
| 3 | 381 | 10 |
| 4 | 383 | 1 |
| 5 | 441 | 0 |
| 6 | 446 | 0 |
The animations of the vibrations are not shown in this example, as they would be the same as those for S2N2.
Low frequencies --- -7.6226 -4.2111 -0.0098 0.0082 0.0118 9.1073
Low frequencies --- 179.5587 225.4813 380.9993
Analysis of data obtained so far
Having run optimisations on several molecules thus far, now would be a good time to analyse our data properly, and determine if any trends are visible. To do this, we shall look primarily at the changes in IR vibrational data and dipole moments.
| Molecule | Dipole moment (D) |
|---|---|
| S2N2 | 0 |
| SSeN2 | 0.59 |
| S2NP | 1.49 |
| Se2P2 | 0 |
| S2N2 | SSeN2 | S2NP | Se2P2 | |||||
|---|---|---|---|---|---|---|---|---|
| Frequency | Intensity | Frequency | Intensity | Frequency | Intensity | Frequency | Intensity | |
| 1 | 455 | 24 | 400 | 23 | 347 | 6 | 180 | 0 |
| 2 | 633 | 0 | 455 | 1 | 456 | 0 | 225 | 0 |
| 3 | 653 | 4 | 630 | 16 | 468 | 8 | 381 | 10 |
| 4 | 761 | 29 | 652 | 1 | 526 | 1 | 383 | 1 |
| 5 | 924 | 0 | 871 | 0 | 772 | 30 | 441 | 0 |
| 6 | 930 | 0 | 913 | 7 | 868 | 7 | 446 | 0 |
It is predicted that molecules with greater bond distances will have weaker bonds and consequently lower frequency vibrations in the IR - this is corroborated by the results, but a particular point of interest is in the relation between dipole moments and the number of IR-active modes - as an example, mode no. 5 is IR-active solely for S2NP. This is because in all the other molecules chosen, this stretch involves two nitrogen atoms moving in equal and opposite directions, such that the overall change in dipole is zero. When one of these atoms is substituted for a phosphorous, this is no longer the case: the mode becomes IR-active, and indeed is quite intense.
- Values for intensity have been rounded to zero where very small to account for the error expected with the calculations, though it is important to note that for the substituted molecules, some intensity values were non-zero. Whether this was a real result of the shift in dipole or due to the error in the system is unknown - we have no way of telling.
Given that substituting the atoms results in changes in the IR properties, it is logical to suppose that these changes may also affect the molecular orbital situation in the molecules. Having optimised our molecules previously, we are now in a position to carry out population analyses to determine the molecular orbitals.
Molecular orbital analysis
We can perform a population analysis based on our optimised molecules in order to compute the molecular orbitals of the molecules; this is useful alone, but it is even more useful when combined with an LCAO approach. If we can construct an LCAO model and compare it with the actual picture provided by Gaussian, we can learn a lot about the benefits of the LCAO approach but also its limitations; similarly, we can sometimes see how the full Gaussian procedure may be unnecessary if we want a brief qualitative look at the situation, without the need for computing time and effort. To this end, it is useful to construct a molecular orbital diagram of S2N2. We shall use this diagram as a "control group" reference when we come to look at the orbitals of the other molecules. We shall not, however, compare all the orbitals for all the molecules - only those of particular interest will be included in the comparison. The constructed S2N2 MO diagram is shown here (D-space link to population analysis for S2N2: DOI:10042/25618 ). The orbitals shown are all the relevant orbitals from the first bonding MOs up to the LUMO level - beyond this level, the orbitals shown by Gaussian become unreliable as they are unoccupied, and as such are not included. Orbitals are displayed on the left and right hand side, but are all MOs - this is a space-saving measure only. The diagram can be enlarged by clicking into it.
The LCAO models drawn on the MO diagram are constructed from the MO pictures; that is to say, they were constructed by examining the pictures and breaking them down into the traditional LCAO elements. With these as our reference points, we can now explore the differences in the molecular orbitals ensued from substitution of atoms. To obtain the MOs of the other molecules, population analyses were also run for them. The D-space link to SSeN2 population analysis can be found here: DOI:10042/25709 , while the log files for S2NP and Se2P2 can be found here: S2NP Se2P2
What are we to expect from the orbitals of the other molecules? Let us summarise briefly our expectations, and we will see later if they are fulfilled:
- With a heavier, larger atom replacing a lighter atom, we can expect the orbitals of the atom to be larger and more diffuse - this may well have a significant effect on determining whether bonding interactions can occur (for instance through-space effects). Due to the increased size, we can expect weaker bonds due to the mismatch in orbital size - this certainly seems to be the case, based on the previous frequency analyses.
- As a consequence of the larger orbital size, is it possible that some MOs may involve "skipping" an atom? Consider the case in BCl3 - the Cl p-orbitals are large enough that they can interact without the central B atom. It is possible that a similar sort of system may well exist in these molecules.
- With our original S2N2 molecule there are few d-orbital effects, since both sulphur and nitrogen are too high in the periodic table for these to be significantly present. With the lower elements, on the other hand, these orbitals will become more easily accessible, and indeed do appear.
- The GaussView MO picture of the HOMO of S2N2 offers a curious spectacle: the p-orbitals of the nitrogen are being somehow drawn in at the edges towards the sulphur atoms, such that viewed along the sulphur atoms it looks like a d-orbital. While this is probably a chance result of the computations, there is a very small chance (according to the demonstrator) that there is a d-orbital interaction taking place. This is very unlikely, however, given sulphur's location in the periodic table and the taxing energy of the d-orbitals; more detailed research using an improved basis set would be required to determine the situation accurately.
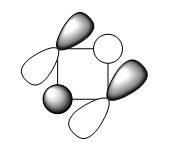
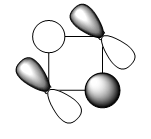
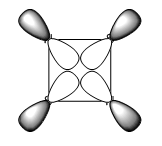
The LCAO representations of the molecular orbitals showcased in the table below are given here, followed by comments on the sets.
 |
 |
 |
| Set No. | S2N2 | SSeN2 | S2NP | Se2P2 |
|---|---|---|---|---|
| 1 |  |
 |
 |
 |
| 2 | 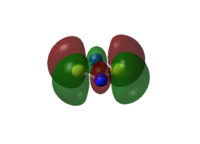 |
 |
 |
 |
| 3 |  |
 |
 |
 |
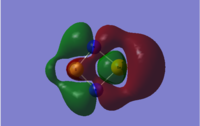
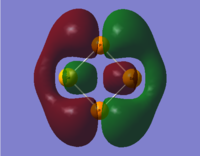
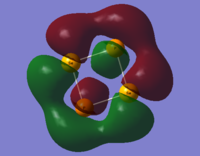
- The molecular orbitals in set 1 provide a fine example of the effects of changing the atoms within a set framework. For the S2N2 case, the orbital is a symmetric primarily bonding orbital arising from the in-phase interaction of two p-orbitals on the two nitrogen atoms and the out of phase s-orbitals on the sulphur atoms, with a nodal plane down the centre. When one of the sulphur atoms is replaced by a selenium atom, however, the picture looks considerably different. The primary orbital contribution is still from the two nitrogen p-orbitals, but this time the s-orbital on sulphur is able to interact with the phase of the p-orbital on the opposite side of the molecule; the same-side p-orbital cloud appears thinner, yet is still there. It is, however, extremely important to stress that the scales in the two pictures are unequal - the "ball and stick" model of the underlying atoms does not change size in the image, but does in reality, thus the orbital sizes must not be compared directly based on the MO pictures. Due to the Se-N bonds being 0.2 Å longer than the S-N bonds, the structure of the molecule shifts slightly to a more kite-like shape; the p-orbitals on nitrogen are thus driven sufficiently away from the selenium atom that the sulphur s-orbital can interact with the other side of the p-orbitals. The size of the selenium atom itself causes the large bulge in the "red" phase. There is little difference between the electronegativities of S and Se (2.58 and 2.55 in Pauling units respectively), so the visible difference is down to size. There is also the possibility that dipole moments could play a significant role in this sort of behaviour - the Se atom has effectively the same electronegativity as S, but is considerably further away - consequently its contribution the overall dipole moment is increased. It is possible that this is enough to cause the movement of electron density away from the S atom and towards the Se atom - giving rise to the sulphur s-orbital interaction with the p-orbital lobe of the same phase and leading to the "thinning" of the orbital shape behind the S atom.
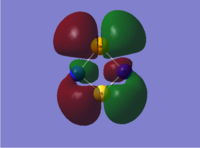
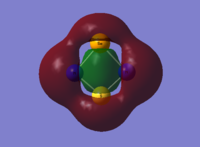
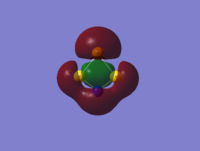
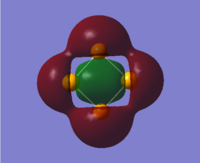
- These molecular orbitals are similar to those in set number 1 (see above): in the first instance (S2N2) the sulphur p-orbitals are out of phase with the nitrogen s-orbitals. The p-orbitals are of insufficient size to interact with each other, and we would expect this to be a predominantly anti-bonding orbital. The next case, SSeN2, also has an orbital layout similar, though with the sulphur p-orbitals being drawn slightly inwards. This makes sense, again for reasons of size and bond length: while the N-Se bonds have been elongated, the N-S bond has been shortened slightly. This reduction in bond distance is sufficient for the highly electronegative nitrogen to affect the shape of the sulphur p-orbital. The Se p-orbitals are sized too differently to be affected, and stand normally. In the third case with S2NP, however, one phase of the p-orbitals on sulphur is able to interact and form a continuous cloud behind the P atom. This is most likely due to the significant disparity in bond distances (2.12 Å versus 1.67 Å), and in this case, the difference in electronegativity between nitrogen and phosphorous. The final case involves all four atoms substituted and looks remarkably similar to the orbitals in set 1. The Se p-orbitals are large enough to lead to through-space interactions, which would give this MO more bonding character than its counterparts' equivalent MOs.
- This final set provides a clear example that size really matters in molecular orbital theory. In the first, second and fourth pictures, we see that each atom has a p-orbital pointing inwards to the centre of the molecule (see LCAOs above) such that a continuous orbital cloud is produced. The third case, S2NP is different - the p-orbital cloud covers only three quarters of molecule. This is down to the large Se-P bond distance in relation to the other bond distances - bearing in mind that one p-orbital lobe is pointing inwards (and interacts with the others), the other one is pointing outwards and is now too far out to interact with the other outward facing p-orbitals, yielding the situation displayed. The final example, Se2P2 has a complete ring like S2N2 and SSeN2 but with what appears to be a greater empty region between the phases. This shows that the absolute size of the orbitals is not what determines interaction, rather it is the relative size compared to other orbitals present.
Conclusion
Throughout this project, we have aimed to discover possible trends amongst S2N2 and compounds similar, and in this aim we have been successful. Though the trends we have discovered are predicted by theory, this makes the practical ratification of these theories no less important - indeed we may discover more than was predicted. We have firstly noted that by changing the atoms in this molecule, we can greatly affect its bond distances and angles, and consequently its dipole moment; through affecting its dipole moment, we are also affecting the IR properties of these molecules. Perhaps more interesting and informative is the effect that atom substitution can have upon the molecular orbitals of a system, sometimes changing the orbital layout completely (and consequently the bonding properties of the molecule; it is too easy to forget that the changes seen in MOs can have significant, physical effects upon a molecule). The key point noticed in this process is that size matters; charge difference, dipole moments and electronegativities all play a significant part, but in this case size matching (or mis-matching) has the most significant role.
It is important to reiterate that some of the molecules used in this experiment are theoretical in nature, but this in no way reduces the validity of the data obtained or the discussion about the results. Indeed the success observed in noticing the trends provides ample evidence that a similar procedure based on theoretical molecules may be of use in the future for other, more complex molecular groups; the potential for further study has been highlighted from this report.
Further study
S2N2 is one of the more basic of the cyclic sulphur-nitrogen compounds, but offers enough interesting data in a reasonably short period of time. There are many opportunities to carry this research on further, however, and indeed there is growing interest in some of these compounds. A few examples of possible future projects are:
- These trends have been established for S2N2-like molecules, and while we would predict that the same phenomena affect larger molecules (for instance S4N4), a similar study of substituting atoms in these rings would determine whether or not these trends are applicable to larger sulphur-nitrogen complexes.
- There is much organic chemistry interest in some of these compounds, particularly selenium-phosphorous heterocycles, as reagents in selenation reactions. One example is in the formation of α,β-unsaturated carbonyl compounds from unsaturated equivalents via selenoxide elimination[8], and there are many other reactions involving these Se compounds.
- There are many industrial uses of phosphorous-selenium compounds, e.g. as engine oil antioxidants or as aids to metal extraction from ores, and the field is largely unexplored - there remains yet a lot to be discovered, and through computational means we can attempt to "aim" our practical chemistry through modelling in order that less time is spent on failed experiments.[9]
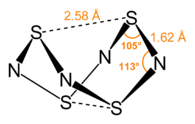
- Some of the larger sulphur-nitrogen complexes provide curious examples of bonding which are rarely seen elsewhere. The molecule S4N4 (see below) has a curious cradle-like structure created by the attraction of the two S atoms at the points of the structure - this cannot be explained solely by van der Waals' means, and so would be an excellent topic to explore with molecular orbital theory.
- While not a cluster compound per se, polymeric sulphur nitride (polythiazyl) is prepared from S4N4 (and then S2N2) and has a great number of important uses. It would be an interesting experiment to perform a similar atom substitution procedure and in doing so compute the molecular orbitals present in the polymer chain and compare them to those present in the clusters and determine if any trends are the same between clusters and polymer.
References
- ↑ 1.0 1.1 1.2 http://www.huntresearchgroup.org.uk/teaching/teaching_comp_lab_year3/2a_optimising_bh3.html
- ↑ B Réffy et al. Gallium tribromide: molecular geometry of monomer and dimer from gas-phase electron diffraction, Journal of Molecular Structure, Volume 445, Issues 1–3, 6 April 1998, Pages 139-148 DOI:10.1016/S0022-2860(97)00420-1
- ↑ PAC, 1994, 66, 1077 (Glossary of terms used in physical organic chemistry (IUPAC Recommendations 1994)) on page 1089
- ↑ E. Rytter et al, High temperature infrared spectra and vibrational analysis of GaBr3 and AIBr3NH3 in the vapour phase, Spectrochimica Acta, Vol. 42A, No. 1 I, pp. 1317-1319, 1986 DOI:10.1016/0584-8539(86)80233-1
- ↑ http://www.gaussian.com/g_tech/g_ur/k_freq.htm
- ↑ Ab initio theoretical study of interactions in borazane molecule, A. Jagielska, The Journal of Chemical Physics, Vol. 110, No. 2, pp. 947-954, 8 January 1999 DOI:10.1063/1.478139
- ↑ In Situ, Time-Resolved X-ray Diffraction Study of the Solid-State Polymerization of Disulfur Dinitride to Poly(sulfur nitride) - H. Müller , S. O. Svensson , J. Birch , and Å. Kvick, Inorg. Chem., 1997, 36 (7), pp 1488–1494 DOI:10.1021/ic961141y
- ↑ Reich, H. J.; Wollowitz, S. Org. React. 1993, 44, 1. DOI:10.1002/0471264180.or044.01
- ↑ J Derek Woollins, http://www.rsc.org/pdf/dalton/1003phos.pdf
- ↑ Wikimedia Commons

