Rep:Mod:OrganicChemistryComputational
Advanced molecular modelling and assigning the absolute configuration of an epoxide
Conformational analysis using Molecular Mechanics
The Hydrogenation of Cyclopentadiene Dimer
Cyclodimerisation of Cyclopentadiene
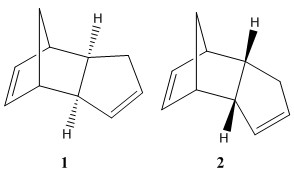
The cyclodimerisation of cyclopentadiene to form the dimer is a pericyclic reaction and is called a diels-alder reaction. This reaction occurs by one cyclopentadine molecule acting as the conjugated diene and the other acting as a dienophile. This cyclodimerisation can produce to two different stereoisomers seen in Figure 1, exo isomer product (1) and endo isomer product (2). The stereoisomer product that is formed will depend on how the reaction is controlled. For the cylcodimerisation of cyclopentadiene the endo isomer product is favoured over the formation of the exo isomer product. Using molecular mechanics I will predict the geometry and regioselectivity of the cyclodimerisation of cyclopentadiene. Optimisation of the sterioisomer geomerties was proformed in Avogadro using the MMFF94(s) force field and conjugated gradients algorithm options.
| structure | Exo isomer 1
|
Endo isomer 2
| ||||||
|---|---|---|---|---|---|---|---|---|
| Total bond stretching energy (kcal/mol) | 3.54 | 3.47 | ||||||
| Total angle bending energy (kcal/mol) | 30.77 | 33.19 | ||||||
| Total torsional energy (kcal/mol) | -2.73 | -2.95 | ||||||
| Total van der Waals energy (kcal/mol) | 12.80 | 12.36 | ||||||
| Total electrostatic energy (kcal/mol) | 13.01 | 14.18 | ||||||
| Total energy (kcal/mol) | 55.37 | 58.19 | ||||||
| Avogadro file | File:Exo isomer 1.cml | File:Endo isomer 2.cml |
The the thermodynamic product is the most stable and should have a lower total energy. The kinetic product is the fastest formed product and has a higher total energy. The kinetic product will have a lower activation energy and so a lower energy transition state. The data from table 1 shows that on comparing the exo isomer 1 and endo isomer 2, the total energy of endo isomer 2 is 58.19 kcal/mol which is 2.82 kcal/mol higher compared to the exo isomer 1 which is 55.37 kcal/mol. Therefore endo isomer must be the kinetic product and exo isomer 1 the thermodynamic product.
The largest contribution to the difference in relative energies between the isomers comes from the total angle bending energy terms.The angle bending energy is the energy associated with the bending of bond angles from normalit. From table 1 these total angle bending energies are 30.77 kcal/mol and 33.19 kcal/mol for exo isomer 1 and endo isomer 2 respectively .The difference between the exo and endo isomer is 2.41858 kcal/mol. The reason why there is a marked difference in the total energies is because the in endo product the 5-membered ring is closest to largest bridge , whilst in the exo product the 5-membered ring is located furthest away from the longest bridge. This results in a greater steric stain observed in the endo isomer shown through the calculated energies in table 1;higher angle bending energy and greater electrostatic repulsion.

The cyclodimerisation of cyclopentadiene kinetically controlled as the endo isomer 2 is regioselectivily produced. A frontier orbital description of the cyclodimerisation can be used to explain the regioselectivity. One cyclopentadiene molecule acts as the diene and the other as the dienophile ,the combination of the HOMO of the diene with the LUMO of the dienophile produces the correct symmetry for bond formation, where two π-bonds form two σ-bonds.Figure 2. shows the bonding interactions leading to both the exo and endo isomers, in the formation of the endo product there are orbitals at the back of the dienophile of the correct symmetry to interact with the orbital of the diene counterpart in a favourable through space interaction. This favourable through space interaction will result in a lower energy transition state for the endo product and it will form faster then the exo product, hence the endo isomer is the kinetic product.
The Hydrogenation of cyclopentadiene dimer
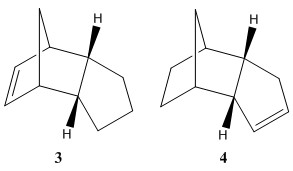
The hydrogenation of one of the carbon-carbon π-bonds in endo isomer 2 will initially produce one of the dihydro derivatives 3 or 4, which though prolonged hydrogenation will form the tetra-hydro derivative where both double bonds have been reduced. The geometry of the the dihydro derivatives (3 and 4) was optimisaed in Avogadro using the MMFF94(s) force field option and conjugated gradients algorithm option.
| structure | Dihydro derivative 3
|
Dihydro derivative 4
| ||||||
|---|---|---|---|---|---|---|---|---|
| Total bond stretching energy (kcal/mol) | 3.31 | 2.82 | ||||||
| Total angle bending energy (kcal/mol) | 31.93 | 24.69 | ||||||
| Total torsional energy (kcal/mol) | -1.47 | -0.38 | ||||||
| Total van der Waals energy (kcal/mol) | 13.64 | 10.64 | ||||||
| Total electrostatic energy (kcal/mol) | 5.12 | 5.15 | ||||||
| Total energy (kcal/mol) | 50.45 | 41.26 | ||||||
| Avogadro file | File:Dihydro derivative 3.cml | File:Dihydro derivative 4.cml |
Data from Table 2 shows that on comparing dihydro derivative 3 and 4, the most thermodynamically stable product is dihydro derivative 4. With a total energy of 41.26 kcal/mol it is 9.12 kcal/mol more stable than dihydro derivative 3. The total angle bending energy and the total Van der Waals energy are the two largest steric derivations repectivly between the structures.
| Structure | Dihydro derivative 3 | Dihydro derivative 4 | Dihydro derivative 4* |
|---|---|---|---|
| Bond lenght | 1.342 | 1.338 | 1.338 |
| Bond angle | 107.4 | 112.9 | 112.0 |
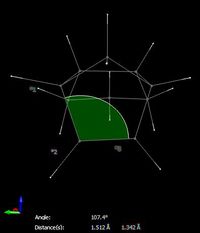
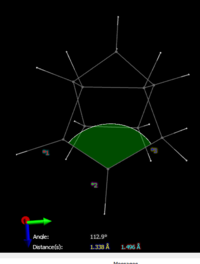
The total angle bending energy difference is 7.25 kcal/mol. This bond angle strain has been visualised in figure 3, the ideal bond angle at the sp2 carbon should be 120o however it is only 107.4o in derivative 3. Compare this to the bond angle around the sp2 alkene carbons in derivative 4 which which form bond angles of 112.9o and 112.0o to the adjacent carbon atoms in the ring. These slightly greater bond angles are closer to the ideal angles and will mean that the bonds are slightly more strained in derivative 3. The angle higher bending energy confirms this and means that the structure is higher in energy and less stable.The double bond in dihydro derivate 3 is more strained and therefore the corresponding bond in the starting material (endo isomer 2)should be more reactive towards hydrogenation.
Antropisomerism in an intermediate to the synthesis of Taxol

Atropisomerism is the distinction between two molecules that arises due to restricted rotation about a single bond, usually due to the high steric demand removing the usually free rotation. Structures 9 and 10 seen in figure 5 are antropisomers, and the restriction of rotation about two C-C single bonds at the carbonyl and the adjacent R2HC-CH2C(=O)R single bond gives two structures which differ by the spacial position of the carbonyl ( either pointing up or down). Using molecular mechanics I will predict the geometry and stability of the antropisomers 17 and 18 . Optimisation of the antropisomer geomerties was proformed in Avogadro using the MMFF94(s) force field and conjugated gradients algorithm options, and results posted in table 4.
| Structure | Taxol derivative 9 | Taxol derivative 10 | ||||||
|---|---|---|---|---|---|---|---|---|
|
| |||||||
| Total bond stretching energy (kcal/mol) | 7.65 | 7.57 | ||||||
| Total angle bending energy (kcal/mol) | 28.28 | 18.84 | ||||||
| Total torsional energy (kcal/mol) | 0.29 | 0.32 | ||||||
| Total van der Waals energy (kcal/mol) | 33.12 | 33.19 | ||||||
| Total electrostatic energy (kcal/mol) | 0.30 | -0.040 | ||||||
| Total energy (kcal/mol) | 70.54 | 60.57 | ||||||
| Avogadro file | File:Atropisomerism Taxol Intermediate 9.cml | File:Atropisomerism Taxol Intermediate 10.cml |
With both molecules having the 6-membered rings in the chair conformation ( which are the lowest energy confomers),the most thermodynamically stable atropisomer is 10. This atropisomer has total energy of 60.57 kcal/mol, which is 9.97 kcal/mol lower in energy than atropisomer 9 where total energy is 70.54 kcal/mol. The higher angle bonding energy in 9 points to a more strain structure.
The largest contribution to the increased strain on the structure 9 is from the angle bending energy term which is 9.44123 kcal/mol higher compared to structure 10. Table 5 compares the bond angles around the carbonyl on both atropisomers, the ideal bond angles around the sp2 carbonyl carbon atom is 120o however in antropisomer 9 these angles are 117.5o ,118.9o and 123.4o compare to 118.2o , 121.2o and 120.4o .It is clear that the bond angles formed around the carbonyl in 10 are more ideal than than those in 9 and the structure exhibits is less stained and therefore lower in energy. I would expect antropisomer 9 to interconvert to 10 on standing.
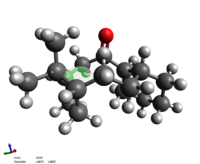
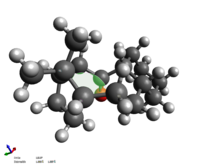
The bridgehead alkene is noted as reacting very slowly on functionalization, this is because it is a hyperstable alkene[1]. The olefin strain (OS) energy can be used to explain the stability and reactivity for hyperstable bridgehead olefins, OS is defined by subtracting the strain energy of the most stable conformer of the parent hydrocarbon from the total strain energy of the alkene. For the hyperstable alkenes the OS value is negative and so contains less stain than the parent hydrocarbon. A hyperstable alkene is less strained than its parent hydrocarbon and will show reduced reactivity due to the bridgehead position of the alkene. The reason for this bridgehead alkene stability is due to the unfavourable strained geometry of the parent hydrocarbon causes by steric inference of groups around the bridgehead (methylene H atoms with methyl groups on the bridge) , whereas the cage structure of the olefin provides less of these steric interactions between groups.
| Structure | Taxol derivative 9 | Taxol derivative 10 |
|---|---|---|
 |
| |
| Total bond stretching energy (kcal/mol) | 6.96 | 6.98 |
| Total angle bending energy (kcal/mol) | 32.06 | 25.52 |
| Total torsional energy (kcal/mol) | 9.46 | 8.52 |
| Total van der Waals energy (kcal/mol) | 32.73 | 32.33 |
| Total electrostatic energy (kcal/mol) | 0.00000 | 0.00000 |
| Total energy (kcal/mol) | 81.76 | 73.69 |
| Avogadro file | File:Atropisomerism 9 parent alkane.cml | File:Atropisomerism 10 parent alkane.cml |
I have optimised the parent alkane structures using Avogadro MMFF94(s) force field and conjugated gradients algorithm .I can now compare the strain energies between parent alkane and olefins 9 and 10. The parent alkane have total energies which are 11.22kcal/mol and 13.12 kcal/mol higher energy than the respective alkenes 9 and 10, so parent alkanes are less stable. The largest contributions to the increases in energy come from firstly the total angle bending energies. Alkenes have optimal bond angles of 120o, and from table 5 it is shown that these bond angles do not deviate more than 3.4o from ideality. Compare this to the optimal bond angles of an alkane which is 109.5o , the images in table 6 show the bond agles formed in the parent alkanes are now 117.3o and 118.8o respectively. This deviations are larger form ideality by upto 9.3o and backed up by the increases in the the angle bending energies which increases by 3.78 kcal/mol and 6.68 kcal/mol for the parent alkane structures of 9 and 10 respectively indicates more stain in the parent alkane structures. The second largest contribution to the increased total energy term is seen in the total torsional energy. The parent alkanes adopt eclipsed confomarions about the C-C bond at the bridgehead, they also have two additional H atoms which have added across the alkene. The dihedral angles along the C-C-C-H bond, for 9 this decreases from 16.2o to 7.5o and in 10 the dihedral angle increases from 18.6o to 18.7o ( No real change). This smaller dihedral angles and the extra H atoms which eclipse each other in the parent alkane structures increases the strain in the parent alkane and can be see in the torsional energy terms which have increased by 9.16 kcal/mol and 8.02kcal/mol for 9 and 10 respectively upon hydrogenation to alkanes.
Spectroscopic Simulation using Quantum Mechanics
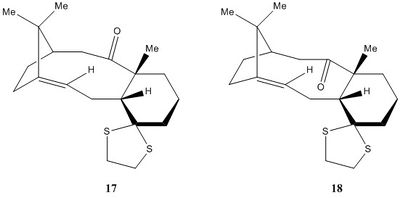
Using molecular mechanics I will first predict the geometry of the intermediates 17 and 18 related to the synthesis of Taxol. Optimisation of the structure geometry was preformed in Avogadro using the MMFF94(s) force field and conjugated gradients algorithm options.I will then take the lowest energy conformation and simulate the 1HNMR 13CNMR using Quantum mechanics and compared to literature. The geomerty is calculated at density function level(DTF)in Avogadro using the Gaussian extension. The following setting was input to simulate the NMR's, Calculation: Geometry optimisation), Theory: B3LYP, Basis set: 6-31G(d,p)(d= carbon polarisation, p=hydrogen polarisation),Solvent:SCRF=(CPCM,Solvent=chloroform), and keywords: FREQ NMR and EmpiricalDispersion=GD3.
| Structure | Taxol derivative 17 | Taxol derivative 18 | ||||||
|---|---|---|---|---|---|---|---|---|
|
| |||||||
| Total bond stretching energy (kcal/mol) | 16.53 | 15.02 | ||||||
| Total angle bending energy (kcal/mol) | 39.72 | 31.03 | ||||||
| Total torsional energy energy (kcal/mol) | 15.36 | 9.71 | ||||||
| Total van der Waals energy (kcal/mol) | 51.94 | 49.23 | ||||||
| Total electrostatic energy (kcal/mol) | -7.54 | -6.04 | ||||||
| Total energy (kcal/mol) | 118.234 | 100.46 | ||||||
| Gibbs free energy (kcal/mol) | -1036294.80 | -1036309.65 | ||||||
| Avogadro file |
Intermediate 18 has the lowest energy, comparing the Gibbs free energy shows that intermediate 18 is stablised by -14.84 kcal/mol. The NMR analysis was preformed on conformer 18. 18DOI:10042/26593 , 17DOI:10042/26744
 |
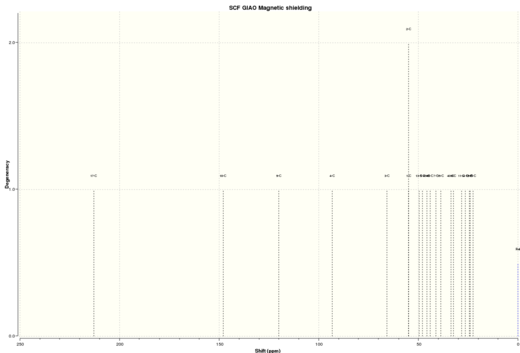 |
| Figure 6a. Taxol intermediate 18 HNMR spectra | Figure 6b. Taxol intermediate 18 CNMR spectra |
| Simulated 1HNMR chemical shifts / ppm | Literature 1HNMR chemical shifts / ppm |
|---|---|
| 6.00 (s,1H) | 5.21 (m,1H) |
| 3.14-2.82 | 3.00-2.70 (m,6H) |
| 2.62-2.34 | 2.70-2.35 (m, 4H) |
| 2.28-1.65 | 2.20-1.70 (m, 6H) |
| 1.59 | 1.58 (t, J = 5.4 Hz, 1H) |
| 1.52-1.37 | 1.50-1.20 (m, 3H) |
| 1.31-1.23 | 1.10 (s, 3H |
| 0.96 | 1.07 (s,3H) |
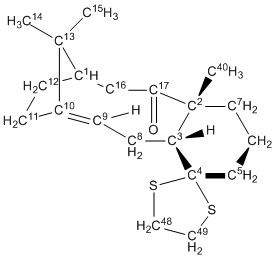
| Carbon | Simulated 13CNMR chemical shifts / ppm | Literature 13CNMR chemical shifts / ppm |
|---|---|---|
| 17 | 212.94 | 211.49 |
| 10 | 147.91 | 148.72 |
| 9 | 120.13 | 120.90 |
| 4 | 93.16 | 74.61 |
| 3 | 65.83 | 60.53 |
| 1,2 | 54.91 | 51.30 |
| 13 | 49.57 | 50.94 |
| 5 | 48.01 | 45.53 |
| 49 | 45.07 | 43.28 |
| 46 | 44.05 | 40.82 |
| 7 | 41.24 | 38.73 |
| 16 | 38.62 | 36.78 |
| 40 | 33.62 | 35.47 |
| 8 | 32.47 | 30.84 |
| 11 | 28.31 | 30.00 |
| 14 | 26.41 | 25.35 |
| 12 | 24.48 | 22.21 |
| 6 | 24.07 | 21.39 |
| 15 | 22.48 | 19.83 |
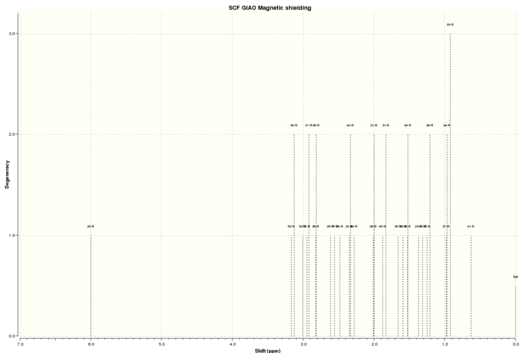
Table 8 shows a comparison between my simulated 1HNMR with the chemical shifts found in literature. The quantum mechanics simulation provided a very good approximation of the proton environments as no chemical environment was out by more than 0.79 ppm compared to literature ( this was the the alkene proton). overall this method works quite well for predicting 1HNMR and the proton environments. Table 9 shows the comparison between my simulated 13CNMR with the chemical shifts found in literature. On the hole most of the carbon environment were within 1-2 ppm, however there are a few that are out by 4~19 ppm( notably carbons 4,3 1,2 and 46) . Theses significant differences in the chemical shifts point to an incorrect conformation in these particular environments within either the quantum mechanical prediction or the reported literature. Carbon 4 which is located adjacent to two sulfur atoms has the largest difference between calculated and literature of 18.55 ppm. As carbon 4 is next to two heavy sulfur atoms the chemical shift will need correction for spin-orbital coupling errors, however no correction has been calculated/found.Overall the method has work well for predicting the relative carbon 13CNMR but not to the accuracy as was obtain whilst predicting the 1HNMR spectrum. A possible reason for this was that in quantum mechanical calculation will work better on smaller nuclei like hydrogen as the approximations are better, i could try to use a higher level basic set in my calculation in an attempt to improve the simulated 13CNMR results however i believe that the main problem comes from the spin-orbital coupling errors. Another improvement to the quantum mechanical approach would be to predict the n J X-Y spin-spin coupling in the 1HNMR, however this is a very time consuming calculation as structure 18 contains 30 hydrogen's. I could have also used the gNMR program to simulate the observed spectrum by using the predicted chemical shifts and coupling constants Using the Predicted chemical shifts and coupling constants to simulate an observed spectrum.To obtain a replica of the experimental spectrum i would combine the predicted values to simulate the actual spectrum. It should be noted that the quantum mechanical prediction only produces a snap-shot of the the NMR and so some protons in similar environment may have been predicted using quantum mechanics as being non equivalent.
Analysis of the properties of the synthesised alkene epoxides
The crystal structures of the two catalysts
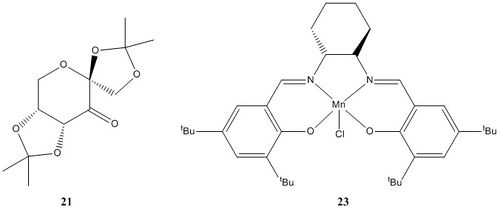
The Cambridge crystal database (CCDC) was searched using Conquest program to find the crystal structures of pre-catalysts 21 and 23. Once the search was complete the Mercury program was used to further analyses the cryatal structures.
 |
 |
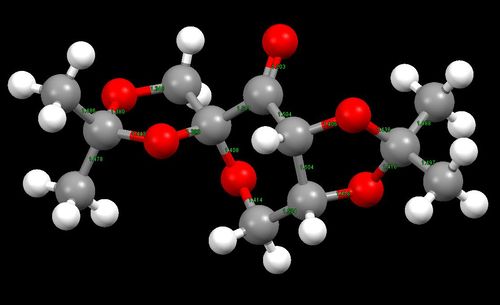
| Figure 9. Shi pre-catlyst 21 | Figure 10.Jacobsen pre-catalyt 23 |
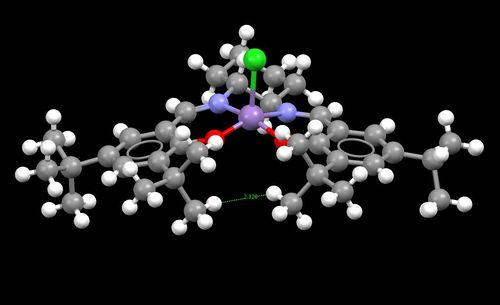
In the structure 23 there are two t-butyl groups attached to the two aromatic systems that are adjacent to each other. As these groups are very large it could be expected that there must be considerable steric repulsion between these groups. This large steric hindrance must causes the structure of molecule 23 to be distorted seen as the molecule does not have the optimal bond angles for a square based pyramid structre around the Mn 3+ center. This twisting to the structure caused by steric hinderance must lead the the possibility of forming atropisomers. I have also noticed that there appears to be two protons on adjacent t-butyl groups which are close enough for an attractive van der waals (dispersion) interaction. Twice the van der waals radii for hydrogen is 240 pm, these two hydrogen's identified are 232.8 pm apart.
 |
 |
| Figure 11. Anomeric effect stereoelectronic interaction between σLPO/σ*c-o</sub | Figure 12.Anomeric effect orbital interactions |
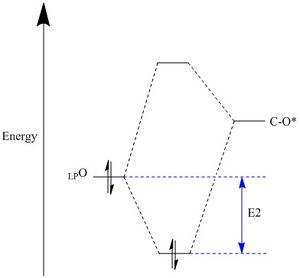
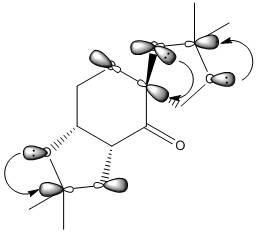
The anomeric effect is a type of stereoelectron effect where the interaction of atomic and molecular orbitals leads to the stability of certain confomers by a donor-acceptor interaction. The anomeric effect is present within systems where there is a hetroatom adjacent to another hertoatom whitin a cyclic system, like pre-catalyst 21. The donor orbitals are one of the two oxygen lone pairs (σ LPO) and the acceptors being the C-O bond (σ*C-O) molecular orbitals, figure 11 and figure 12 show the sterioelectron stabilisation caused by the anomeric effect and the oxygen lone pair donation to C-O antibonding orbital respectively. There are three anomeric centres (O-C-O)in 21, figure 9 shows the bond lengths at all three anomeric centres. The bonds lengths are; 1.416 Å (O11-C22) adjacent to 1.438 Å (C22-O10), 1.408 Å (O12-C14) adjacent to 1.390 Å (C14-O08) and 1.380Å (O07-C19) adjacent to 1.443 Å (C19-O08) . The donation from the lone pair into a σ*C-O molecular orbital will shorten the a C-O bond and also weaken the adjacent C-O bond. This is due to electrons entering an antibonding orbital of the adjacent C-O bond, this is seen by the increase the bond lengths.
The calculated NMR properties of epoxides
Optimisation of the epoxides geometry was preformed in Avogadro using the MMFF94(s) force field and conjugated gradients algorithm options.The following setting was input to simulate the NMR's in gaussview, Calculation: Geometry optimisation), Theory: B3LYP, Basis set: 6-31G(d,p)(d= carbon polarisation, p=hydrogen polarisation),Solvent:SCRF=(CPCM,Solvent=chloroform), and keywords: FREQ NMR and EmpiricalDispersion=GD3.
Styren oxide
Styrene-oxide link to DSPACE: DOI:10042/26528
 |
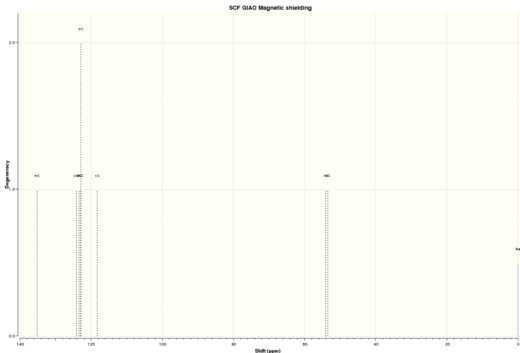 |
| Figure 13. Calculated Styrene oxide 1HNMR | Figure 14.Calculated Styrene oxide 13CNMR |
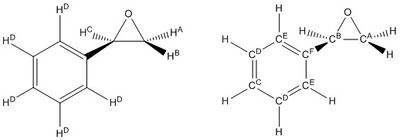
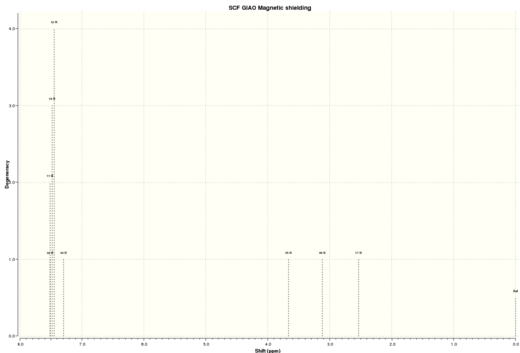
| Proton | Simulated 1HNMR chemical shifts / ppm | Literature 1HNMR chemical shifts / ppm |
|---|---|---|
| A | 2.53 | 2.75 (dd, J = 2.8, 5.6 HZ, 1H) |
| B | 3.12 | 3.08 (dd, 4.1, 5.6 Hz, 1H) |
| C | 3.66 | 3.80 (dd, J = 2.8, 4.1 Hz, 1H) |
| D | 7.49-7.30 | 7.24-7.23 (m, 5H) |
| Carbon | Simulated 13CNMR chemical shifts / ppm | Literature 13CNMR chemical shifts / ppm |
|---|---|---|
| A | 53.5 | 51.0 |
| B | 54.1 | 51.1 |
| C | 118.3-123.0 | 125.3 |
| D | 123.4 | 128.0 |
| E | 124.1 | 128.2 |
| F | 135.1 | 137.5 |
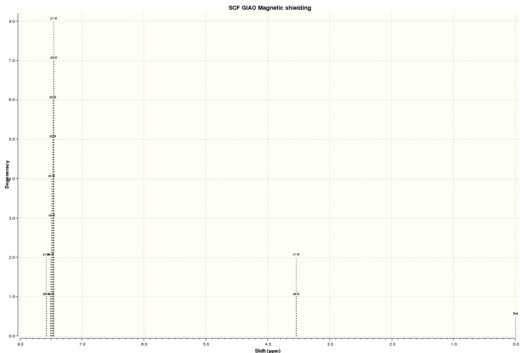
Trans stilbene oxide
Trans-Stilbene oxide link to DSPACE :DOI:10042/26529
 |
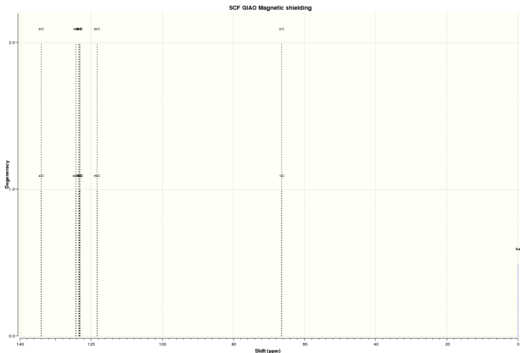 |
| Figure 16. Calculated Trans-Stibene 1HNMR | Figure 17.Calculated Trans-Stibene 13CNMR |
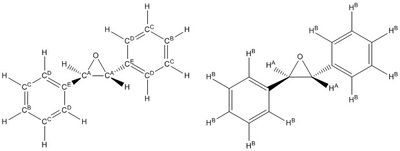
| Proton | Simulated 1HNMR chemical shifts / ppm | Literature 1HNMR chemical shifts / ppm |
|---|---|---|
| A | 3.54 | 3.87 (s, 2H) |
| B | 7.48-7.57 | 7.25-7.59 (m, 10H) |
| Carbon | Simulated 13CNMR chemical shifts / ppm | Literature 13CNMR chemical shifts / ppm |
|---|---|---|
| A | 66.4 | 62.8 |
| B | 123.1-118.1 | 125.5 |
| C | 123.5 | 128.3 |
| D | 124.2 | 128.5 |
| E | 134.1 | 137.1 |
The quantum mechanical calculated NMR for both epoxides shows very good agreement to the literature. I have preformed no corrections to the chemical shifts. No coupling has been produced in my quantum mechanical HNMR spectra. The quantum mechanical approach only produces a snapshot, but still this method has given a reliable and accurate approximation of the 1HNMR 13CNMR for both epoxides.
Assigning the absolute configuration of the epoxides
The reported literature for optical rotations
(R)-styrene oxide[4] [αD]20 = -19.5 (1 g/100ml, CHCl3, 99%ee, 10 cm)
(S)-styrene oxide[5][αD] = +19 ( 1 g/100ml, CHCl3, 91 %ee)
(R,R)-Trans stilbene[6] [αD] 22 = +296 ( 1.01 g/100ml , ethanol)
(S,S)-Trans stilbene [7][αD]20 = -278 ( 0.6 g/100ml, ethanol,10 cm)
The calculated chiroptical properties of the product
(R)-Styrene oxide [αD] = -30.44 deg. DOI:10042/26614
(S)-Styrene oxide [αD] = +30.45 deg. DOI:10042/26683
(R,R)-Trans stibene [αD] = +297.94 deg.
DOI:10042/26623
(S,S)-Trans stibene [αD] = -297.71 deg. DOI:10042/26690
On comparing the literature values for optical rotation with thmy quantum mechanical calculated values does show very good agreement, especially for the (R,R)-Trans stilbene and (S,S)-Trans stilbene. Using quantum mechanics calculations compounds with optical rotations of magnitude >|100| can be predicted more accurately and configurations assigned with confidence. As for (R)-Styrene oxide and (S)-Styrene oxide the calcualted optical rotations were not as accurate due to the magnitude of the optical rotation lying well below <|100|. In both cases the quantum mechanical approach was successful in producing the correct sign of for optical rotations, but beings to struggle to perdict absolute configuration of epoxides for optical rotations of magnitude <|100|. More calculations are needed to assign the absolute configuration of the epoxides.
ECD (Electronic Circular Dichroism)and VCD (Vibrational circular dichroism)Spectrums
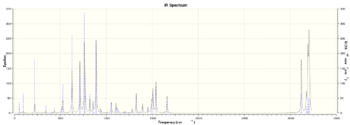
I have calculated UV/VIS, ECD,IR and VCD spectrum for (R,R)-trans stilbene oxide and (R)-styrene oxide.
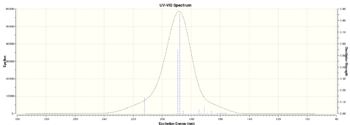 |
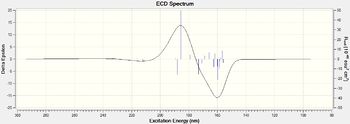 |
| Figure 19 .Calculated (R)-Styrene oxide UV/VIS spectrumDOI:10042/26657 | Figure 20.Calculated (R)-Styrene oxide ECD spectrumDOI:10042/26657 |
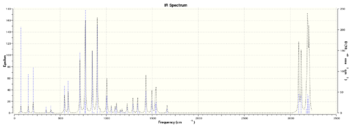 |
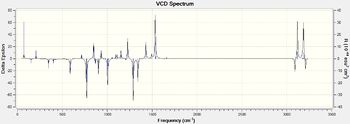 |
| Figure 21.Calculated (R)-Styrene oxide IR spectrumDOI:10042/26658 | Figure 22.Calculated (R)-Styrene oxide VCD spectrumDOI:10042/26658 |
 |
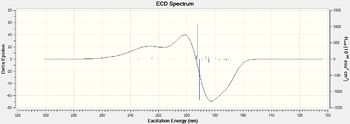 |
| Figure 23. Trans-stibene oxide UV/VIS spectrums | Figure 24.Trans-stibene oxide ECD spectrums |
 |
 |
| Figure 25. Trans-stibene oxide IR spectrums | Figure 26.Transistibene oxide VCD spectrums |
Here I have calcualted the UV/VIS and ECD spectrum of the (S,S)-trans stilbene oxide and (S)-styrene oxide, one important observation I have made is that the ECD spectrums for the alternate configurations produces a mirror image with peaks and troughs swapping around.
 |
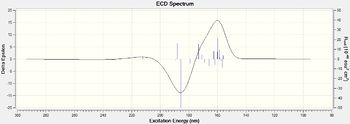 |
| Figure 27. (S)Styrene oxide UV/VIS spectrums | Figure 28.(S)Styrene oxide ECD spectrums |
 |
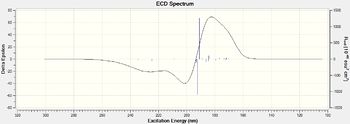 |
| Figure 29. (S,S)-Trans stilbene oxide UV/VIS spectrums | Figure 30.(S,S)-Trans stilbene oxide ECD spectrums |
Using the (calculated) properties of transition state for the reaction (β-methyl styrene only)
Shi epoxidation of β-methyl styrene
Using the lowest free energy transition state for (R,R) and (S,S) β-methyl styrene i will be able to predict the enantiomeric excess and assign the absolute configuration of the of the product.The free energy difference is used to find the ratio of concentrations of the two species K = [R]/[S]. This is done by using the equation ΔG = -RTLnK which rearranges to give K =e(ΔG/-RT) . Now the calculated value of K can be used to predict the enanotomeric excess of the one epoxide over the other ((R,R) over the (S,S)).
| Diastereomeric transition state | lowest free energy transition state (kj/mol) |
|---|---|
| (R,R)β-methyl styrene oxide | -3526131.947703 |
| (S,S)β-methyl styrene oxide | -3526111.728726 |
ΔG = -20.218977 kj/mol
K =e(ΔG/-RT) = e((-20.218977)/-(8.314472 x10-3)(298.15)) = 3485.038019 = 3485.04 (2 d.p.)
Enanotomeric excess (ee) is given by , ee = ((R-S)/(R+S))= ((K-1)/(K+1)) = ((3485-1)/(3485+1)) = 0.99942 = 99.94%
This calculation shows that the shi catalyst is 99.9% selective in producing the (R,R)-β-methyl styrene product over (S,S)-β-methyl styrene. This calculated value of ee can be compared to a literature value ee = 90%[8], which is in good agreement with the calculated value for shi epoxidation. The absolute configuration of the shi catalysed epoxidation of β-methyl styrene is (R,R)β-methyl styrene oxide
Shi epoxidation of Trans stilbene
One of my selected alkene was trans stibene, using the data from transition state for shi epoxidations of trans stibene i will calculate the enantiomeric excess of the epoxide to assign the absolute configuration of my product. This is done using the same calculations as before.
| Diastereomeric transition state | lowest free energy transition state (kj/mol) |
|---|---|
| (R,R)Trans stibene | -4029355.254084 |
| (S,S)trans stibene | -4029338.926098 |
ΔG = -16.327986 kj/mol
K =e(ΔG/-RT) = e((-116327986)/-(8.314472 x10-3)(298.15)) = 725.3308654 = 725.33 (2 d.p.)
Enanotomeric excess (ee) is given by , ee = ((R-S)/(R+S))= ((K-1)/(K+1)) = ((725.33-1)/(725.33+1)) = 0.997246434 = 99.72%
Compared this value of ee to literature value for ee of 97%[9] The absolute configuration of trans stibene oxide has been calculated to be 99.72% of (R,R)-Trans stilbene oxide when epoxidation carried out using the Shi catalyst and this agrees very well with literature.
Jacobensen epoxidation of cis and trans β-methyl styrene
Using the same calculations as done with the shi epoxidation transition state i will predict the enanotomeric excess for the jacobsen epoxidation of cis and trans β-methyl styrene.
| Diastereomeric transition state | lowest free energy transition state (kj/mol) |
|---|---|
| (S,S) transβ-methyl styrene oxide | -8882756.320518 |
| (R,R)trans β-methyl styrene oxide | -8882734.956823 |
ΔG = -21.363695 kj/mol
K = [S,S]/[R,R] =e(ΔG/-RT) = e((-21.363695)/-(8.314472 x10-3)(298.15)) = 5530.357558 = 5530.36 (2 d.p.)
Enanotomeric excess (ee) is given by , ee = (([S,S]-[R,R])/([S,S]+[R,R]))= ((K-1)/(K+1)) = ((5530.36-1)/(5530.36+1)) = 99.96%
A literature value obtained was ee = 98.5%[10] this calculation shows good agreemnet with literature, so absolute assignment of the epoxide is (S,S) transβ-methyl styrene oxide when epoxidation carried out using the Jacobsen catalyst.
| Diastereomeric transition state | lowest free energy transition state (kj/mol) |
|---|---|
| (S,R) cis β-methyl styrene oxide | -8882748.648806 |
| (R,S) cis β-methyl styrene oxide | -8882726.33468 |
ΔG = -22.314126 kj/mol
K = [S,R]/[R,S] =e(ΔG/-RT) = e((-22.314126)/-(8.314472 x10-3)(298.15)) = 8114.491886 = 8114.49(2 d.p.)
Enanotomeric excess (ee) is given by , ee = (([S,R]-[R,S])/([S,R]+[R,S]))= ((K-1)/(K+1)) = ((8114.49-1)/(8114.49+1)) = 99.98%
This value of ee = 99.98 compared to a literature value of ee = 85%,[11]. The computed value is higher than the literature but still gives the same enantiomer in excess, the absolute configuration of the epoxidation of Cis β-methyl styrene using the Jacobsen catalyst is (S,R) cis β-methyl styrene oxide.
Investigating the non-covalent interactions (NIC) in the active-site of the reaction transition state
Tabsition state selected was the (R,R)Trans-Stibene minimum energy shi epoxidation transition state. By proforming NCI analysis i am able to see any non-bonding interaction occur
 |
 |
| |||
| Figure 31. NIC of (R,R) trans stibene shi epoxidation | Figure 32. NIC Arrow 2 box enlarged | Figure 33. NIC Jmol of transition state |
In figure 31 arrow 1 points to the bond formation in the transition state between the catalyst oxygen and the alkene and , this interaction is considered half-covalent. Arrow 2 points to real NIC interaction between the shi catalyst and trans stibene seen, this being a mainly green colour indicates mildly favorable interactions. Figure 32 shows an enlarged image of the interactions pointed to in arrow 2, i have highlighted three areas that appear pale blue seen by arrows A,B and C. Arrows B and c show what look like very favourable interactions between the two of the oxygen hetrocyclic atoms in the shi catalyst with an aromatic hydrogen in B and the alkene hydrogen in C. Arrow A appears to show a very attractive interaction between an alkene H atom with a methyl H atom in the catlyst. Arrow 3 points to a moderately strong interaction between a H atoms on the catalyst with an aromatic carbon on trans stilbene, this surface spans over only one carbon so might be considered a ɳ1 hydrogen bond.
Investigating the electronic topolgy (QTAIM) in the active site of the transition state
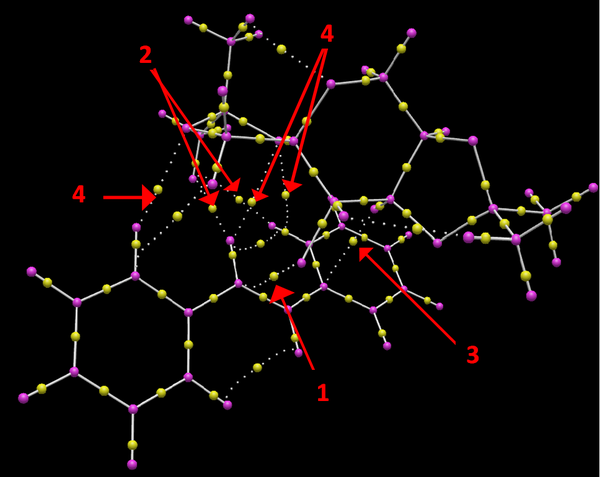
In figure 34 arrow 1 points to the BCP between the oxygen of the catalyst with the carbon in the alkene bond on trans stilbene, this BCP is asssociated with the formation of a bond between the catalyst oxygen and the alkene carbon , this is a strong covalent interaction. Arrows 2 point to the two BCP's between a methyl hydrogens in the catalyst with alkene protons and aromatic protons in trans stilbene. The relative position of the BCP's is equidistant between the hydrogen's in the catalyst and trans stilbene.This is a moderate non-covalent interaction between hydrogen's as they lie in the attractive van der waals region, between 2.1-2.6 A ( optimal distance is twice the van der waals radius of hydrogen which is h is 2.4 A). Arrow 3 points to the BCP between a proton in the catalyst with an aromatic carbon in trans stilbene, this is another weak non-covalent interaction. The relative position of the BCP lies closer to the hydrogen of the catalyst. Arrows 4 point to the BCP between oxygen atoms in the catalyst and two aromatic and an alkene hydrogen on the trans stilbene. These are all weak non-covalent BCP, the relative position of the BCP lies slightly closer to the Hydrogen atoms in all three cases.
Suggesting new candidates for investigation

A search on Reaxys was done to fine a substructure that has an optical rotation in the region of ORP.ORP<'-500' or ORP.ORP>'500'. I have chosen to pick germacrone-4,5-epoxide which is synthetically accessible [12] in the lab and corresponding alkene can be found to be commercially available though websites such as Sigma-Aldrich.com or Alibaba.com . Optical rotation [αD]16= +399(1.05g/100ml, CHCL3 16 oC) wavelength = 598 nm.
Germacrone-4,5-epoxide (26) is a natural product and is isolated from rhizomes of different species of curcuma. The alkene can epoxidised at either of the two alkene bonds. The high optical rotation means that this epoxide is a good candidate for further investigation using the computational methods explored previously, it can also be synthesised in the lab using the literature[12]
References
- ↑ W. F. Maier, P. Von Rague Schleyer, J. Am. Chem. Soc., 1981, 103, 1891. DOI:10.1021/ja00398a003
- ↑ 2.0 2.1 Spectroscopic data: L. Paquette, N. A. Pegg, D. Toops, G. D. Maynard, R. D. Rogers, J. Am. Chem. Soc.,, 1990, 112, 277-283. DOI:10.1021/ja00157a043
- ↑ 3.0 3.1 3.2 3.3 Wiles, Charlotte, Marcus J Hammond, and Paul Watts, "The development and evaluation of a continuous flow process for the lipase-mediated oxidation of alkenes","Beilstein journal of organic chemistry 5.1".2009,27,10-11.DOI:10.3762/bjoc.5.27
- ↑ Joerg H. schrittwieser, Iván Lavandera, Birgit Seisser, Barbara Mautner, Jeffrey H. Lutje Spelberg, Wolfgang Kroutil, "Shifting the equilibrium of a biocatalytic cascade synthesis to enantiopure epoxides using anion exchangers","Tetrahedron: Asymmetry".2009,20(4),483-488.
- ↑ Wei, Shengwei messerer, Redina Tsogoeva, Svetlana B, "Asymmetric Synthesis of β-Adrenergic Blockers through Multistep One-Pot Transformations Involving In Situ Organocatalyst Formation","Chemistry-A European Journal".2011,17(51),14380-14384.DOI:10.1002/chem.201102931
- ↑ A. D.-V. Arlette solladie-Cavallo, Vitomir Sunjic, Vladimir Vinkovic, "A two-step asymmetric synthesis of pure trans-(R,R)-diaryl-epoxides","Tetrahedron: Asymmerty".1996,7(6),1783-1788.DOI:10.1016/0957-4166(96)00213-3
- ↑ Capriati V, Florio S, Luisi R, Perna FM, Salomone A, Gasparrini F , "An efficient route to Tetrahydronaphthols via Addition of Ortho-Lithiated Stilbene Oxides to α,β-Unsaturated Fischer Carbene Complexes","J . Am. Chem. soc".2005,7(22),4895-4898.DOI:10.1021/ol0518176
- ↑ Wong OA, Wang B, Zhao M-X, Shi Y,Asymmertic Epoxidation Catalysed by α,α-Dimethylmorpholinone Ketone.Methyl Group Effect on Spiro and Planat Transition States. J. Org .Chem, 2009, 74(16), 6335-6338.DOI:10.1021/jo900739q
- ↑ Wong OA, Wang B, Zhao M-X, Shi Y,Asymmertic Epoxidation Catalysed by α,α-Dimethylmorpholinone Ketone.Methyl Group Effect on Spiro and Planat Transition States. J. Org .Chem, 2009, 74(16), 6335-6338.DOI:10.1021/jo900739q
- ↑ Toda H, Imae R, Itoh N,Efficient biocatalysis for the production of enantiopure (s)-epoxides using a styrene monooxygenase (SMO) and leifsonia alcohol dehydrogenase (LSADH) system,Tetrahedron: Asymmerty, 2012, 23(22-23), 1542-1549.DOI:10.1016/j.tetasy.2012.09.017
- ↑ Wang B, Wong OA, Zhao M-X, Shi Y,Asymmetric Epoxidation of 1,1-Disubstituted Terminal Olefins by Chiral Dioxirane Via a Planar-like Transition state.,Tetrahedron: Asymmerty, 2008, 73(24), 4895-4898.DOI:10.1021/jo801576k
- ↑ 12.0 12.1 Dennis P. Piet, Robert Schrijvers, Maurice C.R. Franssen* and Aede de Groot*,"Biotransformation of germacrane epoxides by< i> Cichorium intybus", Tetrahedron, 1995, 51,"22", 6303-6314.DOI:0040-4020/95

