Rep:Mod:OaB6317
Hydrogenation of Cyclopentadiene
The dimerisation of cyclcopentadiene (1) to produce dicyclopentadiene (2) proceeds via a Diels Alder, 4πs +2πs, cycloaddition reaction (Figure 1).

One molecule of 1 acts as the dienophile, and another as the diene. The stereochemistry of the reactants are maintained in the products and depending on the orientation of the dienophile, two different stereoisiomers can be formed; the endo-isomer (2a) or the exo-isomer (2b). In 2a the substituents on the dienophile are pointing towards the diene. Whereas, in 2b the substituents are pointing away from the diene.
The dimerisation of cyclopentadiene leads to the formation of a major isomer, 2a, indicating that the reaction must proceed under thermodynamic or kinetic control. The former is a reversible reaction and leads to the formation of the most stable product. The latter is an irreversible reaction and proceeds via the lowest energy pathway. Such reactions are performed rapidly at low temperature. In order to determine if the dimerisation of cyclopentadiene proceeds under thermodynamic or kinetic control, the relative energies and geometries of isomers 2a and 2b were examined.An MM2 forcefield was applied and the resulting energies are presented in Table 1.
| Molecule | Image | Minisimed Structure | Energy kcal/mol | |||
|---|---|---|---|---|---|---|
| Endo Isomer (2a) | 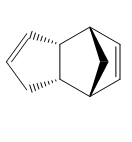 |
|
33.9775 | |||
| Exo Isomer ('2b) | 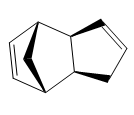 |
|
31.8765 |
From Table 1, it is noted that isomers 2a and 2b differ in energy by 2.1025 kcal/mol. Thus 2b is the more stable isomer with a lower energy. However, experimentally it is found that 2a is in fact major isomer that is formed. Therefore, the dimerisation of cyclopentadiene proceeds under kinetic control. If the reaction was controlled thermodynaically, isomer 2bwould be the major isomer observed. The preference for the formation of 2a can be explained by considering the transitions states of 2a and 2b.
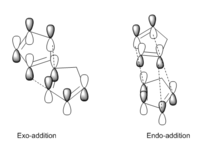
Isomer 2a is favoured due to the presence of secondary orbital interactions[1] between the HOMO of the diene and the LUMO of the dienophile in the endo transition state (Figure 2). These interactions do not lead to the formation of new bonds, but stabilise the transition state with respect to the the transition state of the exo isomer. Secondary orbital interactions are not possible in the exo transition state due to the orientation of the dienophile.
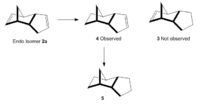
Hydrogenation of 2a (Figure 3) initially gives one of the dihydro derivatives 3 or 4. Complete hydrogenation of both C=C bonds to give the tetrahydro derivative 5 is only observed after prolonged reaction time. The relative energies of 3 and 4 were examined. An MM2 forcefield was applied to both molecules. The results are summarised in Table 2.
| Energy Term (kcal/mol) | 3 | 4 | Energy Difference (kcal/mol |
|---|---|---|---|
| Stretch | 1.2774 | 1.1293 | -0.0156 |
| Bend | 19.8597 | 13.0149 | 6.8448 |
| Stretch-Bend | -0.8344 | -0.5646 | -0.2698 |
| Torsion | 10.8118 | 12.4125 | -1.6007 |
| Non-1,4 VDW | -1.2242 | -1.4262 | -2.6504 |
| 1,4-VDW | 5.6327 | 4.4406 | 1.1921 |
| Dipole-Dipole | 0.1621 | 0.1410 | 0.0211 |
| Total Energy | 35.6850 | 29.2475 | 6.4376 |
Table 2 reveals that 4 is lower in energy than 3 by 6.4375 kcal/mol and is thus the more stable isomer. Therefore the hydrogenation of 2a proceeds with the hydrogenation of C=C in the six membered ring, followed by the double bond in the five membered ring. This observation can be explained by considering the bending and torsional energy terms for 3 and 4. Isomer 3 displays a larger bending term than 4. This indicates that one or more of the bond angles in 3 must deviate significantly from optimal bond angles. In 3, the H(1)-C(2)-C(3) bond angle at the C=C is 127°, which is significantly different from an optimal bond angle of 120.0° for a sp2 C. The corresponding H(1)-C(2)-C(3) bond angle in 4 is 110.8°, which is closer to an optimal bond angle of 109.5° for a sp3 C. Additionally, the C=C bond angle in 4 is 124.7°, which is again closer to an optimal bond angle of 120° for an sp2 C. On the other hand, 4has a larger torsion term than 3. This can be explained by considering the dihedral angles. However, despite processing a higher torsional energy term, 4 exhibits a lower stretching and bending energy terms. Thus rendering it more thermodynamically stable.
Taxol
Atropisomers have very important uses in pharmaceuticals [2]. Atropisomers are conformers that due to steric hinderance or electronic reasons, interconvert slowly (half like > 1000s) and they may be isolated. Molecules 9 and 10 (Figure 4)
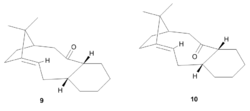
are atropisomers and are key intermediates in the total synthesis of Taxol. Taxol is a chemotherapy drug which is used to treat patients with lung, ovarian and breast cancer. 9 and 10 differ in their orientation of the carbonyl group. In 9, the carbonyl points up relative to the ring and in 10 the carbonyl group points down relative to the ring. On standing, 9 and 10 isomerise between each other, leading to the accumulation of the more thermodynamic stable atropisomer. The relative energies of 9 and 10 were determined using an MM2 forcefield (Table 3). The minimum structures of 9 and 10 were improved by adjusting the conformation so that the 6 membered ring adopted a chair conformation, instead of a higher energy boat or twist boat. The structures of 9 and 10 were also minimized using an MMFF94 forcefield (Table 4).
| Energy Iteration (kcal/mol) | Isomer 9 | Isomer 10 |
|---|---|---|
| Stretch | 2.7074 | 2.61892.l |
| Bend | 14.7207 | 11.3402 |
| Stretch-Bend | 0.2791 | 0.3430 |
| Torsion | 19.1515 | 19.6778 |
| Non 1,4 VDW | -1.7365 | -2.1700 |
| 1,4 VDW | 13.7288 | 12.8752 |
| Dipole/Dipole | -1.7570 | -2.0021 |
| Total Energy | 47.0934 | 42.6830 |
| Isomer 9 | Isomer 9 | |
|---|---|---|
| Final Energy (kcal/mol) | 67.7335 | 60.5639 |
The energies obtained from the MM2 and MMFF94 calculations indicate that isomer 10 adopts the most stable conformation by 4.4104 kcal/mol and 7.1696 kcal/mol. This implies that over time all of isomer 9 will covert to isomer 10. However, this process is slow, indicating that there a high energy barrier that must be overcome. Molecules 9 and 10 both contain fused rings which results in their slow interconversion, with respect to cyclohexane, via the corresponding boat conformation.
Both isomers 9 and 10 show a lack of reactivity. This is unexpected as an alkene is found in both structures at a bridgehead. Hence, it would be expected for such bridgehead alkenes to be highly reactive, and possible reactions would lead to the relief of strain around the alkene bond. Likewise, Bredt’s rule predict that alkenes avoid being placed at bridgeheads in a ring system. Olefinic Strain [3](OS) can explain the observed unreactivity of 9 and 10. OS is the measure of strain around an alkene compared to its parent hydrocarbon. Bridgehead alkenes have poorer π overlap and consequently a lowering of the HOMO-LUMO energy gap. Most alkenes process a positive OS but bridgehead alkenes have a negative OS, indicating that they are more stable than their parent hydrocarbons. Such alkenes are called ‘hyperstable stable alkenes. This idea of hyperstable alkenes, further supports the observed lack of reactivity of 9 and 10.
Regioselective Addition of Dichlorocarbene to a diene

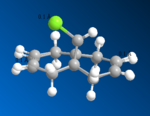
The addition of dichlorocarbene with 9-chloromethanonaphthalene (12) (Figure 5) exhibits remarkable π selectivity and orbital controlled reactivity [4]. Dichlorocarbene adds to the endo face of the ring and the regioselectivity of the reaction may be explained by considering the energies of the two alkenes present in 12. The geometry of 12 was optimised by using an MM2 force field method. A MOPAC/RM1 method was then applied to represent the optimization of the valence-electron molecular wavefunction. The valence-electron molecular wavefunction provides information about which site is the most susceptible to electrophilic attack. The optimised structures of 12 from each force field method were superimposed (Figure 6). It is noted that the MM2 force field placed the endo ring lower in energy than the MOPAC force field.
| Stretch | 0.6189 |
| Bend | 4.7376 |
| Stretch-Bend | 0.400 |
| Torsion | 7.6591 |
| Nom 1,4 VDW | -1.0674 |
| 1,4-VDW | 5.7940 |
| Dipole-Dipole | 0.1123 |
| Total Energy | 17.8945 |
The heat of formation from the MOPAC/RM1 for 12 calculation was 22.82755 kcal/mol.
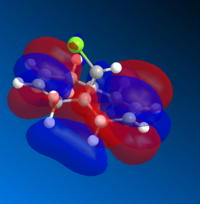
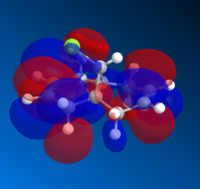
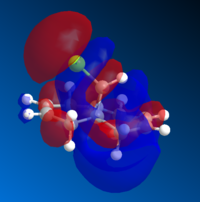
The molecular orbitals (MOs) of 12 were determined using the optimised structure from the MOPAC/RM1 force field. The calculation was performed using a DFT method with B3LYP functional and 6-31G(d,p) basis set. A selection of MOs in HOMO-LUMO region and their corresponding energies are provided in Table 5.
| MO | HOMO-1 | HOMO | LUMO | LUMO+1 | LUMO +2 |
| Energy | -9.442 | -8.682 | 4.509 | 5.308 | 5.775 |
|---|---|---|---|---|---|
| Image | 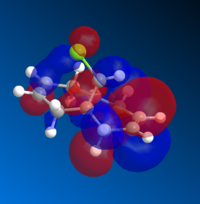 |
 |
 |
 |
|
The following observations may be noted for 12. Firstly, the HOMO may be used to distinguish between the two alkene bonds in 12. The endo alkene bond to Cl is more nucleophilic than the exo. Therefore, electrophilic attack proceeds on the more hindered endo face. Secondly, the MOPAC minimisation produced a conformation in which the distance between the the two alkene bonds and the central bridgehead carbon are of different distances. The length between the exo alkene and C brdigehead is 2.91677 Å. Whereas, the length between the endo alkene and C bridgehead is 3.08774 Å. The exo-C length is shorter due to an antiperiplanar stabilisation interaction of the exo π(HOMO-1) orbital and the Cl-C σ* (LUMO+1) orbital. This results in the stabilisation of C=C bond, which becomes less alkene like in properties (more electrophilic), and the destabilisation of Cl-C σ* orbital. Overall, the total energy of the molecule is lowered. Thus the electrophilic dichlorocarbene adds to the more nucleophilic C=C; in this case the endo alkene. Hence, the endo π bond is lower in energy and more nucleophilic than the exo π bond.
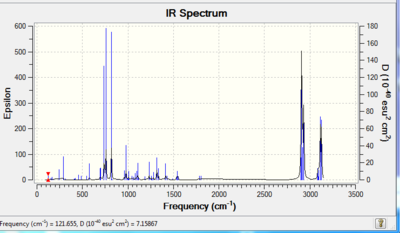
The regioselectivity is further explained by considering the stretching frequencies of the C=C bonds. The IR spectrum of 12 was calculated using a B3LYP method and 6-31G(d,p) basis set and was published to D-Space: DOI:0042/23272 The predicted IR spectrum of 12 was produced and is provided in Figure 7. The C=C vibrations are summarised in Table 6.
| Vibration | Frequency (cm-1) | Intensity | Image | |||
|---|---|---|---|---|---|---|
| exo C=C stretch | 1784 | 2 |
| |||
| endo C=C stretch | 1800 | 2 |
| |||
| C-Cl stretch | 818 | 35 |
|
The exo C=C has a lower stretching frequency than the endo C=C stretching frequency. This can be rationalised by the reduced electron density in the exo C=C bond. The frequencies for the C=C stretches are perhaps higher than expected. In order to improve the results, the structure of 12 could be optimised again to ensure that a minimum structure was obtained.

The electrostatic potential of 12 is given in Figure 8. It shows that there is more of a negative charge on the endo alkene, compared to the exo alkene. And hence, illustrates the observed selectivity of electrophilic attack. The blue colour represent areas of negative charge and the red colour represents areas of positive charge.
Monosaccharide chemistry and the mechanism of glycosidation
Glycosidation involves the loss of a leaving group at the anomeric center and the subsequent attack of the nucleophile to form the new glycosidc bond (Figure 9). Glycosidation is an SN1 reaction and proceeds via the formation of an oxenium ion. When an acetyl group is placed on the C atom adjacent to the anomeric center, a high degree of stereoselectivity is observed. The orientation of the C-OAc bond controls the stereochemistry of the new C-Nuc bond. This is due to the neighboring group effects of the acetyl group to form the second oxenium intermediate (B). The nucleophile can either attack from the top or bottom face, forming the β-anomer or α-anomer respectfully. The aim here, is the examine the stereospecificity of this reaction.

There are two configuration possibilities for the acetyl group (axial or equatorial) on the pyranose ring. Additionally, there are two conformational orientations for the carbonyl oxygen on the acetyl group; either on the top or bottom face of the oxenium cation. These four different intermediates and their corresponding second oxenium intermediates and reaction routes are provided in Figure 10.
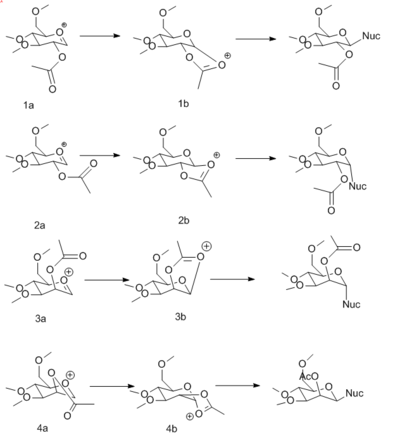
An MM2 force field was applied to each intermediate to determine its relative energy. A MOPAC/PM6 force field was then applied to each intermediate. The results for MM2 and MOPAC calculations for intermediates 1a-4a and 1b-4b are provided in Tables 7 and 8. MM2 and MOPAC are two different types of force field. An MM2 force field considers only force constants. Whereas, a MOPAC/PM6 forcefield can make or break bonds in a structure, using quantum mechanical methods, and considers through space interactions.
| Energy Iteration (kcal/mol) | 1a | 1b | 2a | 2b | 3a | 3b | 4a | 4b |
|---|---|---|---|---|---|---|---|---|
| Stretch | 2.5067 | 2.8805 | 2.409 | 2.7817 | 2.3591 | 1.8452 | 2.3916 | 1.8703 |
| Bend | 10.8928 | 17.8047 | 11.3294 | 17.0506 | 9.9735 | 14.8299 | 8.8079 | 15.4973 |
| Bend-Stretch | 0.9555 | 0.8841 | 0.9857 | 0.7749 | 0.9371 | 0.7393 | 0.8963 | 0.7111 |
| Torsion | 2.4253 | 9.0966 | 1.4014 | 6.9748 | 1.2199 | 8.1941 | 0.8963 | 6.3485 |
| Non 1,4 VDW | -0.0545 | -1.6201 | -1.8979 | -2.4974 | -0.4989 | -2.6704 | -3.6719 | -4.2537 |
| 1,4 vdw | 18.7789 | 19.6393 | 18.1688 | 19.0862 | 18.7930 | 17.4410 | 18.3025 | 17.2970 |
| Charge Dipole | -17.3380 | -3.7418 | -1.8366 | 5.6037 | -19.7797 | -11.5715 | 7.3526 | 5.9363 |
| Dipoe-dipole | 7.7363 | -0.5904 | 5.7424 | 0.5255 | 7.4013 | -1.5408 | 4.7076 | 0.6121 |
| Total Energy | 25.9028 | 44.3529 | 36.3009 | 50.3301 | 20.4054 | 27.2669 | 39.4196 | 44.0190 |
| 1a | 2a | 3a | 4a | 1b | 2b | 3b | 4b | |
|---|---|---|---|---|---|---|---|---|
| Heat of Formation kcal/mol | -87.87950 | -86.48559 | -90.51300 | -77.31197 | -67.91653 | -58.78601 | -91.64201 | -80.95964 |
Table 12 demonstrates that the initial oxenium cations (1a, 2a, 3a and 4a) are lower in energy than their corresponding intermediate oxenium cations (1b, 2b, 3b and 4b). This difference in energy can be attributed to the strained conformations of intermediates 1b-4b, compared to 1a-4a intermediates. Additionally intermediates 1a and 3a are lower in energy than 2a and 4a. This trend can be explained by considering the neighboring group effect of the acetyl group of each intermediate. Hence, the distances between the carbonyl oxygen atom and the anomeric center in the pyranose ring were considered and the results are presented in Table 9.
| Forcefield | 1a | 2a | 3a | 4a |
|---|---|---|---|---|
| MM2 | 2.88 | 3.01 | 2.56 | 2.93 |
| MOPAC | 1.57 | 2.33 | 1.56 | 3.35 |
Apart for 4a, the MOPAC distances are shorter than the MM2 distances. The shorter MOPAC distances can be rationalised by MOPACs ability to form and break bonds due to its quantum mechanical approach. Furthermore, the shorter distances observed for 1a and 3a are in agreement with them having the lowest energies from the MM2 and MOPAC calculations. Therefore, there is a greater neighboring group interaction in 1a and 3a. Conversely, a small neighboring group effect is observed for 2a and 4a, as demonstrated by the larger distance between the carbonyl O and the anomeric center.
Furthermore, the angle of attack of the nucleophile was also by considered. For an SN1 reaction, the optimum angle of attack of the nucleophile is 107°, which corresponds to the Burgi Dunitz angle. The MOPAC structures for intermediates 1a-4a were used to determine the angle of attack of the nucleophile on the anomeric centre. The results are provided in Table 10. The MOPAC calculations were used as it can form/break bonds.
| Intermediate | Angle of Attack (°) |
|---|---|
| 1a | 105.9 |
| 2a | 154.3 |
| 3a | 106.2 |
| 4a | 152.9 |
1a and 3a exhibit bond angles closest to the ideal Burgi Dunitz angle, highlighting again the strong neighboring group effects present.
Lastly, the 1b and 3b intermediates have a lower energy compared to 2b and 4b, as demonstrated from the MM2 and MOPAC calculations. 1b and 3b are more stable as they can be stabilised by resonance effects. Thus, to conclude, the primary route of glycosidation proceeds via intermediates 1a and 1b or 3a and 3b, which both afford the 1,2-trans product.
Mini Project: Simulation of spectroscopic data for a literature molecule
Introduction
NMR spectroscopy is one of the most powerful tools for determining the structures of complex molecules as it provides information on the chemical environment and the connectivity of the molecule. However, it is not uncommon for structures to be incorrectly assigned or spectra incorrectly interpreted. The difficulties encountered in assigning the spectrum of such challenging molecules has lead to the prediction of NMR chemical shifts by modern computational methods. In this report, the 13C NMR of a Taxol derivative (18) and 6-(2,5-Dimethylphenyl)-8-methyl-3-phenyl-1-oxa-2,6,8-triazaspiro[4.4]non-2-ene-7,9-dione (20) were determined. The results obtained were compared to experimental results to deduce if the correct molecules had been synthesised and if the NMR assignment was correct.
Spectroscopy of an intermediate in the synthesis of Taxol
Molecule 18 is a derivative of molecule 10 and a key intermediate in the synthesis of Taxol. The 13C NMR of 18 was predicted using computational software and the results were compared to literature values to determine if the 13C NMR spectrum had been correctly assigned and interpreted.
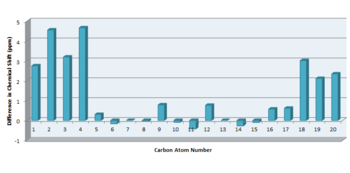
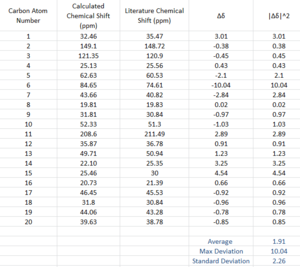
The structure of 18 was minimised using an MM2 forcefield. The output file for the MM2 minimisation of 10 was used as the starting point of the calculation, due to the structure similarities between the two compounds. The results for the MM2 minimisation of 18 can be found here The energy was determined to be 65.1649 kcal/mol. The structure of 18 was further minimised using a DFT method, B3LYP functional,6-31G(d.p) basis set and a CPCM solvation field in benzene. The optimisation file was published to D-Space: DOI:/10042/23070 The NMR spectrum was calculated using Gaussian. The following key words were used: mpw1pw91/6-31G(d,p)NMR SCRF=(CPCM,solvent=benzene) where the basis set was 6-31G(d,p). The NMR calculation was published to D-Space: DOI:10042/23071 and the predicted 13C NMR spectrum was viewed in Gaussview. The calculated 13C chemical shifts were compared to the experimental values obtained for the pure compound [5] (Figure 11). The difference in chemical shift between the calculated and experimental chemical shifts were plotted. The average deviation in chemical shift was determined to be 1.91 ppm,the standard deviation was calculated to be 2.62 ppm and the maximum deviation observed was 10.04 ppm.
 |
 |
 |
Overall, there is good agreement for the calculated and experimental chemical shifts. However, the predicted 13C chemical shift for site of sulphur attachment (C-6) was approximately 10 ppm too high. This observed deviation is due to Spin-Orbit (SO) coupling, which increases due to heavy atom effect. reference needed. However, there is good agreement for the other carbon atoms present in 18, thus indicating that the correct isomer has been identified in literature and the spectrum has been assigned accordingly.
Literature Molecule
The synthesis of spiro isoxazolines can be achieved using nitrile oxide cycloaddition (NOC) reactions on exocyclic methylene groups [6]. In this report, I will examine the 13C NMR of both atropisomers of 6-(2,5-Dimethylphenyl)-8-methyl-3-phenyl-1-oxa-2,6,8-triazaspiro[4.4]non-2-ene-7,9-dione (20). 20 is readily synthesised from the NOC reaction of 3-Methyl-1-(2,5-dimethylphenyl)-5-methyleneimidazolidine-2,4-dione (19) [7] (Figure 12), leading to a mixture of atropisomers 20a and 20b (Figure 13).
The regiochemistry of the NOC reaction is controlled by steric effects and the oxygen of the nitrile has a greater dendency to add to the disubstituted end of the dipolarophile, regardless of the polarity of the dipolarophile [8]. Additionally, NOC reactions displays high levels of facial selectivity [6], which is determined by atropisomerism along the N-aryl bond. Thus NOC reactions can be successfully applied to give the desired isomer.

Structure Minimisation of 20a and 20b
The structure of 2Oa and 20b were minimised using an MM2 forcefield. The energies was determined to be 38.5920 and 45.2149 kcal/mol. The structures were further minimised using a DFT method, B3LYP functional and 6-31G(d,p) basis set. The optimisation files were published to D-Space: DOI:10042/23173 . DOI:10042/23174 The DFT calculations forced the phenyl ring and 5 membered ring containing the N=C bond to be co planar in both 20a and 20b. Further optimisations of 20a and 20b were attempted by removing this planar geometry. However, they didn't lead to a lowering in energy of either 20a or 20b. Therefore, the optimised structures from the first DFT calculations were used for subsequent calculations.
13C NMR Analysis
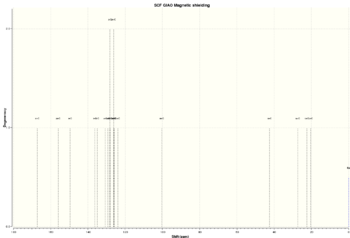
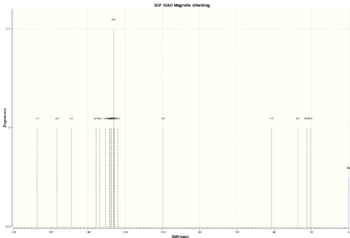
The NMR chemical shifts for 20a and 20b were calculated with GIAO options, using the Mpw1pw91/6-31G(d,p) DFT method and a chloroform solvent method. The NMR calculations were published to D-Space: DOI:10042/23175 DOI:10042/23176 The predicted 13C NMR spectra and chemical shifts are given in Table 11. The different C atoms have been numbered in Figure 13 and the calculated chemical shifts have been assigned to each C atom.

For isomer 20a, the average deviation was 1.34 ppm, the maximum deviation observed was 4.66 ppm and the standard deviation was 1.55ppm. For isomer 20b, the average deviation was 1.06 ppm, the maximum deviation was 3.38 ppm and the standard deviation was 1.04 ppm. Overall, the predicted 13C NMR data are in relatively good agreement with the experimental[7] data, suggesting that the structures of 20a and 20b have been correctly assigned.
However, it should be highlighted that there is an absence of peaks in the experimental [7] data. The absence of some signals is most probably due to the rapid rotations that that C atoms undergo. This results in them experiencing the same chemical environments and ultimately leading to one signal in the 13C NMR spectrum. No signal was observed for the quaternary carbons C-13 and C-15 in the spectra for 20a and 20b respectfully. This is most likely due to the low abundance of 13C, which often results in signals for quaternary carbons not being observed. Furthermore, no signal was observed around 124 ppm in either spectra of 20a for 20b. This peak corresponds to the C-7 in Figure 13. Additionally, no peak for C-11 was observed in the spectrum for 20b either.
In order to use the NMR data to differentiate between 20a and 20b, a common C environment for the isomers should be compared. The chemical shift difference should be large enough ( approximately 5 ppm) so that the difference can be attributed to the different chemical environmental experienced by the C atoms, and not due to an error range. Thus C-12 and C-16 of 20a were compared with C-16 and C-12 of 20b. The difference in chemical shift of these two environments were determined and compared to the difference reported in literature. This is summarised in Table 12.
 |
C-16 of 20a and C-12 of 20b, differ by 3.13 ppm. The corresponding peaks in literature [7] differ by 2.90 ppm. Likewise, C-12 of 20a and C-16 of 20b differ by 1.10 ppm. The corresponding peaks in literature [7] differ by 0.9 ppm. Hence, it can be concluded that the difference in chemical shift of C-12 and C-16 from the calculated results and that from literature, are the same and the peaks have been correctly assigned. Nevertheless, the chemical shifts of C-16 and C-12 are not diagnostic of the two isomers, as their corresponding chemical shifts do not differ by a significant amount. Consequently, they do not allow either isomer to be assigned with absolute confidence. Ideally, the difference in chemical shift between C-13 and C-15 of 20a and 20b would also be compared to literature. However, this data was not provided in literature.
Additionally, it might be expected for C-4 to show a difference in chemical shifts between the two isomers, as a result of the orientation of the N-aryl ring. Computational data shows that they differ by 1.47 ppm, which is in direct correlation to a difference of 1.60 ppm reported in literature [7]. Unfortunately, the chemical shift difference falls within the error range and consequently cannot be used as to distinguish between the two isomers.
nJHH coupling constants
The nJH-H coupling constants for 20a and 20b were calculated. The following key words were used; NMR(mixed,spinspin) and a 6-31G(d,p) basis set was used. The results were published to D-Space; DOI:10042/23195 . DOI:10042/23194 . The coupling constants and chemical shifts for the -CH2 group for each isomer were compared to literature values. The coupling constants and chemical shifts weren't compared for the aromatic protons or methyl protons as they were assigned as multiplets in literature [7]

Table 13 indicated that the chemical shifts for the protons on the -CH2 group have been incorrectly assigned to the correct isomer in literature[7]. This can be deduced by considering the difference in chemical shift between H1 and H2 and H1' and H2'. The difference between H1 and H2 is 0.23 ppm, but it is reported in literature [7] as 0.71 ppm. Similarly, the difference between H1' and H2' is 0.66 ppm but is reported in literature [7] as 0.27 ppm. This is a somewhat small discrepancy, but nonetheless the correct assignment may prove useful for future studies.
Frequency Analysis
A frequency analysis was performed on 20a and 20b to determine that a minimum structure had been obtained and not a transition state. The frequency files were published to D-Space: DOI:10042/23178 . DOI:10042/23179 . The low frequencies for both isomers fall within plus/minus 15, thus confirming that the structures have been successfully minimised. The low frequencies for 20a and 20b are provided below.
Low frequencies for 20a
 Low frequencies ---   -4.7179   -0.0005   -0.0001    0.0004    2.0524    2.7908
 Low frequencies ---   16.8959   24.5781   34.5851
Low frequencies for 20b
 Low frequencies ---   -7.4897   -4.6924   -0.0009   -0.0006   -0.0002    2.7869
 Low frequencies ---   18.2270   25.8063   34.1661
The energies of 20a and 20b are provided in Table 14. They are very similar, which is in agreement with their observed ratio of 2.6:1 in literature[7]. Equally, the IR spectrum of 20a and 20b are significantly similar and are provided below. The most intense stretching frequencies are given in Table 14 and 16 for isomers 20a and 20b.
| Isomer | Energy (a.u.) | Energy(kcal/mol) | IR spectrum |
|---|---|---|---|
| Isomer 20a | -1163.52927755 | -730114.6217 | 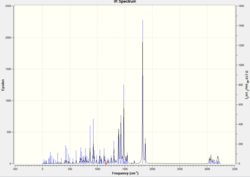 |
| Isomer 20b | -1163.53066864 | -730115.4946 |  |
| Wavenumber (cm-1) | Intensity |
|---|---|
| 1823 | 666 |
| 1480 | 297 |
| 1385 | 123 |
| 1392 | 122 |
| 1428 | 108 |
| Wavenumber (cm-1) | Intensity |
|---|---|
| 1822 | 668 |
| 1478 | 304 |
| 1383 | 139 |
| 1392 | 119 |
| 1871 | 108 |
There is insufficient data to draw relevant conclusions regarding the IR spectra of 20a and 20b. Additionally, no IR data is provided in literature. Therefore it is not possible to draw relevant conclusions from the computational IR spectra and it is not an adequate tool in differentiating between the two isomers.
Conclusion
Overall, the structures of 20a and 20b have been correctly assigned in literature [7]. There is a minor disagreement in the proton NMR spectra, but this discrepancy is very small. This task highlights how important computational NMR is, and the vital role it plays in confirming the synthesis of complex molecules.
References
- ↑ Organic Chemistry J. Clayden, N. Greeves, S. Warren and P. Wothers Oxford University Press(2001) p916-917
- ↑ Agnew. Chem. Int., 48: 6498-6401
- ↑ J. Am. Chem. Soc., 1986, 108 (14), pp 3951–3960
- ↑ J. Org. Chem., 1991, 56 (19), pp 5553–5556
- ↑ J. Am. Chem. Soc., 1990, 112 (1), pp 277–283
- ↑ 6.0 6.1 Australian Journal of Chemistry., 2009, 63(3) 445–451
- ↑ 7.00 7.01 7.02 7.03 7.04 7.05 7.06 7.07 7.08 7.09 7.10 7.11 J. Org. Chem., 2011, 76 (16), pp 6946–6950
- ↑ Org. Biomol. Chem., 2012,10, 4759-4766

