Rep:Mod:Nm2512
EX3 Molecules
Optimisation
For the following optimisations, all calculations used the B3LYP method. All calculations were also confirmed as optimised with RMS gradient less than 0.001 and all key parameter successfully converging. Further detail given below.
BH3
3-21G Basis Set
The first task required the optimisation of a BH3 molecule. GaussView was used to set up an asymmetric version of the molecule with bond lengths of 1.53 Å, 1.54 Å and 1.55 Å while maintaining its trigonal planar geometry with bond angles at 120.0°. This molecule was then optimised in a two part calculation, SCF and OPT. The first stage is an SCF calculation which gives the energies and densities of the electrons through solving the Schrödinger equation. This calculation is then repeated as the position of the nuclei are varied, the OPT stage of the optimisation. This part compares the data from the two most recent nuclei positions with the cycle continuing until a minimum energy has been achieved, the optimal confirmation.
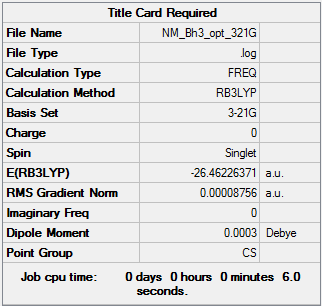
The BH3 molecule was optimised with the 3-21G basis set to give the following data:
The BH3 optimisation log can be found here.
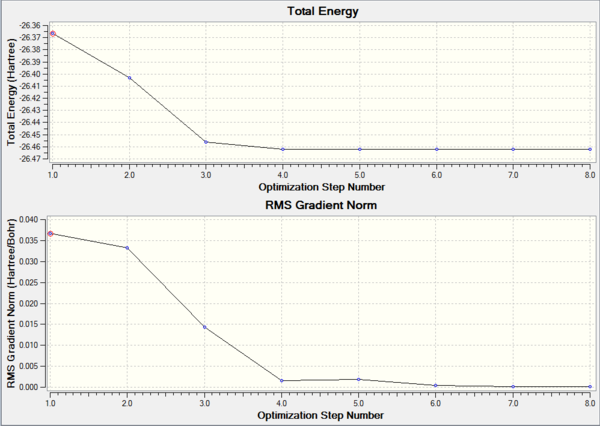
The graphs show how the energy and gradient of each optimisation varies over each step and it is clear to see that both of these values are at a minimum at the final optimisation step indicating the process has been a successful. The energy graph shows the progress the molecule makes as it moves down its potential energy surface (PES) until it reaches a minimum. This is further reaffirmed by the convergence data (see Table above) which is found within the optimisation log that GaussView generates. The table clearly shows that all the key parameters for optimisation have converged which together with a root means square gradient (RMS) being smaller than 0.001 means that the molecule has been optimised.
The final optimised bond lengths and angles are shown here:
| r(B-H) / Å | θ(H-B-H) / ° | |
|---|---|---|
| B-H (1) | 1.19 | 120.0 |
| B-H (2) | 1.19 | 120.0 |
| B-H (3) | 1.19 | 120.0 |
Again this shows clearly the the optimisation has been a success with the bond lengths identical to 2 decimal points and the the bond angles being identical to 1 decimal point, the standard requirements
6-31G(d,p) Basis set
Following an initial optimisation, the BH3 molecule was further optimised through the use of a different basis set: 6-31G(d,p). Changing the basis set allows for more accurate calculations to be made but must also be balanced with how long this process will take.
| Summary Data | Convergence | Jmol | |||
|---|---|---|---|---|---|
 |
Item Value Threshold Converged? Maximum Force 0.000005 0.000015 YES RMS Force 0.000002 0.000010 YES Maximum Displacement 0.000040 0.000060 YES RMS Displacement 0.000027 0.000040 YES |
|
The BH3 optimisation log with the 6-31G(d,p) basis set can be found here.
GaBr3
Pseudo-potentials (PP) or effective core potentials (ECP) are essential for optimisation calculations which include larger atoms. Their main purpose is to model the atoms with only the valence electrons having any significant role in the optimal structure of the molecule, thus making the calculations quicker and easier to compute. For GaBr3, the LanL2DZ basis set was used. This basis set separates out heavier and lighter atoms with D95V applying to first row atoms and Los Alamos ECP applying to all others, which were all four atoms in this computation.
| Summary Data | Convergence | Jmol | |||
|---|---|---|---|---|---|
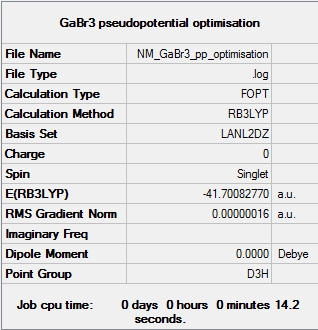 |
Item Value Threshold Converged? Maximum Force 0.000000 0.000015 YES RMS Force 0.000000 0.000010 YES Maximum Displacement 0.000003 0.000060 YES RMS Displacement 0.000002 0.000040 YES |
|
The GaBr3 optimisation log with the LanL2DZ basis set can be found here.
BBr3
In a culmination of previous changes, the BBr3 molecule required the use of a mixture of both basis sets and pseudo-potentials, done so through the use of the GEN basis set and a manual implementation of data into the input file. This simply stated that the central boron atom require a 6-31G(d,p) basis set and the bromine atoms require a LanL2DZ pseudo-potential basis set.
| Summary Data | Convergence | Jmol | |||
|---|---|---|---|---|---|
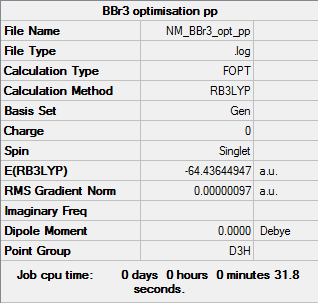 |
Item Value Threshold Converged? Maximum Force 0.000002 0.000450 YES RMS Force 0.000001 0.000300 YES Maximum Displacement 0.000009 0.001800 YES RMS Displacement 0.000006 0.001200 YES |
|
The BBr3 optimisation log with the GEN basis set can be found here.
EX3 Values and Analysis
| BH3 | BBr3 | GaBr3 | |
|---|---|---|---|
| r(E-X) / Å | 1.19 | 1.93 | 2.35 |
| θ(X-E-X) / ° | 120.0 | 120.0 | 120.0 |
Central atom
Unexpectedly an increase in central atom size results in an increase in bond length. This can be explained simply with the increase in atomic radius. The respective atomic radii for boron and gallium are 85 pm and 135 pm. The larger size of the gallium atom means that the bromine ligand can not physically be so close to the central atom, giving the longer bond length of 2.35 Å compared to 1.93 Å for BBr3. There is no difference in the bond angle with the size of the central atom not affecting the expected trigonal planar structures of the molecules.
Ligand
Varying the ligand leads to a change in the bond length, with a larger ligand resulting in a larger bond length as the atoms can not physically be as close together. The bond angle is unchanged and does not deviate from the expected value of 120.0°. This data can also tell us that the strength of the B-H bond is greater than B-Br caused by the valence electron on a hydrogen atom being more available in a less diffuse ortibal and closer in energy to the boron atoms valence electrons.
Bond
A bond can be described as electrostatic interaction between two atoms either between the sharing of electrons (covalent bond) or the formation of charged species giving a dipole attraction (ionic). While these definitions seem clear it is almost always the case that the answer lies in between, with bonds exhibiting both ionic and covalent character. This is normally dependent on the size and electronegativity of the atoms present.
These bonds can vary in strength greatly with the strongest known bond to be the triple bond present in an N2 molecule with reported bond strength value of 945 kJ mol-1[1]. An alkyl C-H bond is typically regarded as a ‘medium’ strength bond with the reported value at 410 kJ mol-1[1]. A low strength bond is a hydrogen bond with its bond strength at roughly 15 kJ mol-1[2].
The GaussView software does occasionally suffer from misplacement and lack of bonds. This is due to the calculation using a distance algorithm to determine whether or not the atoms are bonded which is why it is always important to check the values for bond length and bond angles in order to definitively determine whether or not the bond is present. It is quite possible two atoms are deemed bond simply because they’re close enough but this is not always true.
Frequency Analysis
All frequency analysis calculations used the B3LYP method and 6-31G(d,p) basis set. All frequency calculations confirmed optimisation with all low frequency values being within ± 15 cm-1 of 0 cm-1.
Vibrational or frequency analysis is the calculation of the second derivative of the potential energy surface in order to determine whether or not the molecule has indeed been optimised. This is done by seeing whether or not all the frequencies are positive. If this is the case, then a minimum has been achieved and the molecule is in its lowest energy conformation.
With these calculations, the same method and basis set must be used as otherwise different optimised conformations will be produced as seen earlier with the BH3 molecule. By changing either of these, it would mean that the results are incomparable and therefore it is not possible to determine the success of the optimisation.
BH3
| Summary Data | Low frequencies |
|---|---|
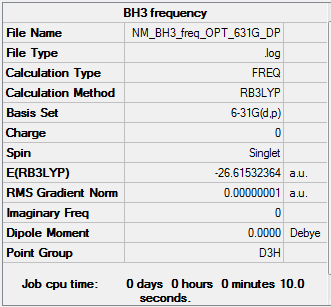 |
Low frequencies --- -9.3744 -9.3591 -0.0753 0.0005 0.5350 2.4478 Low frequencies --- 1162.9902 1213.1495 1213.1497 |
Frequency log can be found here.
| Wavenumber / cm-1 | Intensity | IR active? | Type |
|---|---|---|---|
| 1163 | 93 | Yes | Bend |
| 1213 | 14 | Very slight | Bend |
| 1213 | 14 | Very slight | Bend |
| 2583 | 0 | No | Stretch |
| 2716 | 126 | Yes | stretch |
| 2716 | 126 | Yes | Stretch |
GaBr3
| Summary Data | Low frequencies |
|---|---|
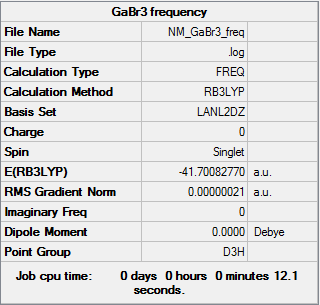 |
Low frequencies --- -1.4877 -0.0015 -0.0002 0.0096 0.6540 0.6540 Low frequencies --- 76.3920 76.3924 99.6767 |
Frequency log can be found here. DOI:10042/146815
| Wavenumber / cm-1 | Intensity | IR active? | Type |
|---|---|---|---|
| 76 | 3 | Slightly | Bend |
| 76 | 3 | Slightly | Bend |
| 100 | 9 | Slight | Bend |
| 197 | 0 | No | Stretch |
| 316 | 57 | Yes | Stretch |
| 316 | 57 | Yes | Stretch |
Comparison
| BH3 | GaBr3 |
|---|---|
 |
|
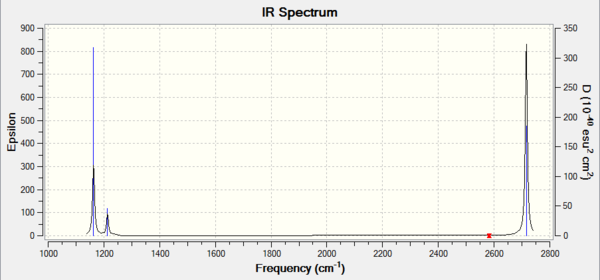
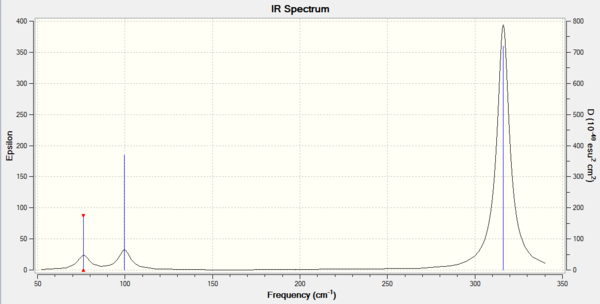
Comparing the two spectra, they share the same basic shape. The key difference is that the BH3 molecule has more intense peaks at a higher frequency. This is to be expected as ν=(1/(2πc))*√(k/μ) with the key component being µ, the reduced mass. The vibrational frequency is inversely proportional to the reduced mass so it is expected that the lighter BH3 molecule will have higher vibrational frequencies. The spring constant, k, can also explain the difference as molecules with stronger bonds will act more spring like and so will vibrate more. BH3 contains stronger bonds and so expectedly has higher frequency vibrations.
The A2” umbrella motion posses a reordering of modes between BH3 and GaBr3. In BH3, it is the hydrogen ligands which are moving the most with an intensity of 93 at 1163 cm-1 whereas in GaBr3, it is the central gallium atom which provides the most movement but at a lower intensity of 9 and a lower frequency of 100 cm-1. This can be explained by the difference in masses between the central atom and the ligands. In BH3, the boron atom is significantly heavier than the hydrogen ligands compared to in GaBr3, where the bromine ligands are slightly heavier than the central gallium atom. As it is the lighter atom which is expected to move, this explains why the modes have been reordered.
The key factors in the following analyses are first of all whether or not there are the correct number of expected frequencies. In correspondence with the 3N-6 rule, where N=4 (the number of atoms), 6 vibrational frequencies are expected which is the case in both BH3 and GaBr3. It is required that these low frequencies are as close to 0 as possible with the standard allowance being ±15 cm-1. These low frequencies are representative of the motions of the centre of mass of the molecules.
Another important value is the total energy of the molecule. This should only be different within the final two decimal places if not identical. If these values aren't in good agreement, then this means that the initial optimisation has not been successful.
Molecular Orbital Diagrams
BH3
The population file can be found here: DOI:10042/147051
The calculated MO's and the MO's predicted by LCAO generally show good agreement with each other. Where LCAO tends to suffer is in how much each fragment contributes to the overall MO. This is seen most clearly in the 2a1' MO where LCAO predicts there would be found localised areas of electron density. This is not the case however with one delocalised oribital across all atoms and bonds being calculated. It is therefore suggestible that LCAO should never be used as a definite answer or model for the anticipated MOs present and that a calculated MO would give a clearer picture as to where electron density is found.
While the BH3 molecule does show good agreement this is most likely due to the molecule itself being smaller in size, with larger molecules more likely to show greater deviations between the LCAO predictions and the calculated MO diagram.
Natural Bond Orders
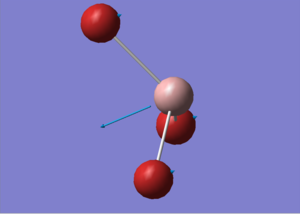
NH3
Optimisation
| Summary Data | Convergence | Jmol | |||
|---|---|---|---|---|---|
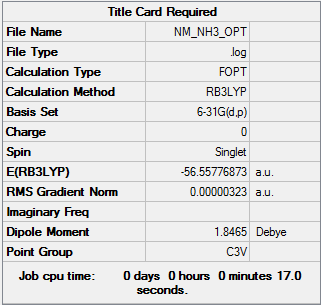 |
Item Value Threshold Converged? Maximum Force 0.000006 0.000015 YES RMS Force 0.000004 0.000010 YES Maximum Displacement 0.000012 0.000060 YES RMS Displacement 0.000008 0.000040 YES |
|
Optimisation log can be found here.
Frequency Analysis
| Summary Data | Low frequencies |
|---|---|
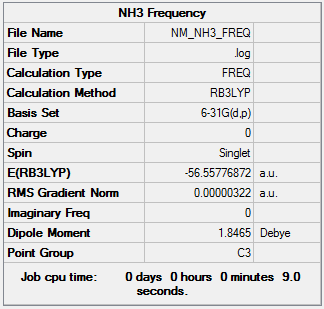 |
Low frequencies --- -0.0139 -0.0025 -0.0010 7.0781 8.0927 8.0932 Low frequencies --- 1089.3840 1693.9368 1693.9368 |
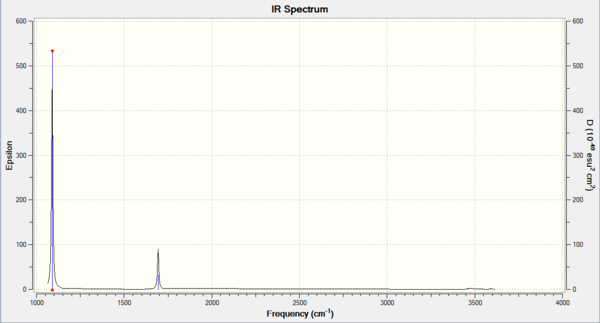
Frequency log can be found here. DOI:10042/147330
| Wavenumber / cm-1 | Intensity | IR active? | Type |
|---|---|---|---|
| 1089 | 145 | Yes | Bend |
| 1694 | 14 | Yes | Bend |
| 1694 | 14 | Yes | Bend |
| 3461 | 1 | Very slight | Stretch |
| 3590 | 0 | Very slight | Stretch |
| 3590 | 0 | Very slight | Stretch |
NBO
|
|---|
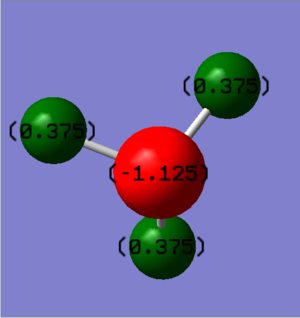
| Charge range between -1.000 and 1.000 |
The NBO diagram clearly shows that there is an equal charge distribution between the three equivalent hydrogen atoms as expected. The central nitrogen carries the negative charge which was to be expected due to nitrogen being a more electronegative atom than than hydrogen. It was also important to check the overall charge equals the expected value of 0, which in this case it does.
Dissociative Energy
NH3BH3
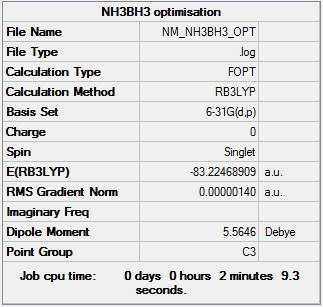
A NH3BH3 molecule was optimised and its low frequencies checked used the standard B3LYP method and 6-31G(d,p) basis set to give the below data.
Optimisation
| Summary Data | Convergence | Jmol | |||
|---|---|---|---|---|---|
 |
Item Value Threshold Converged? Maximum Force 0.000006 0.000015 YES RMS Force 0.000002 0.000010 YES Maximum Displacement 0.000036 0.000060 YES RMS Displacement 0.000016 0.000040 YES |
|
Optimisation log can be found here. DOI:10042/149357
Frequency Analysis
| Summary Data | Low frequencies |
|---|---|
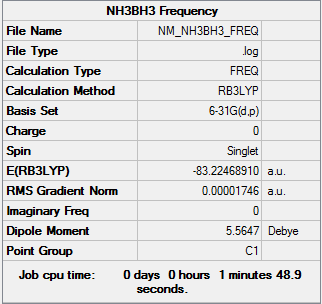 |
Low frequencies --- -0.0012 -0.0012 -0.0007 3.8927 7.4134 15.4382 Low frequencies --- 264.0365 632.9836 638.6133 |
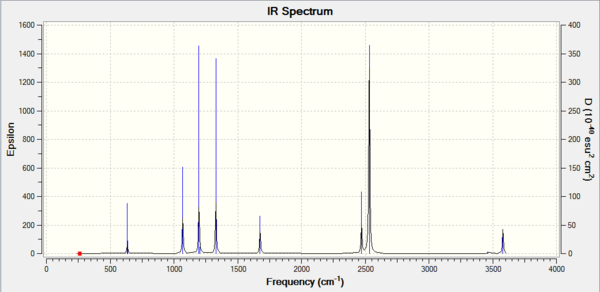
Frequency log can be found here. DOI:10042/149370
| Wavenumber / cm-1 | Intensity | IR active? | Type |
|---|---|---|---|
| 263 | 0 | No | Bend |
| 633 | 14 | Very slight | Stretch |
| 639 | 4 | Very slight | Bend |
| 639 | 4 | Very slight | Bend |
| 1069 | 41 | Yes | Bend |
| 1069 | 41 | Yes | Bend |
| 1196 | 109 | Yes | Bend |
| 1204 | 3 | Very slight | Bend |
| 1204 | 3 | Very slight | Bend |
| 1329 | 114 | Yes | Bend |
| 1676 | 28 | Yes | Bend |
| 1676 | 28 | Yes | Bend |
| 2472 | 67 | Yes | Stretch |
| 2532 | 231 | Yes | Stretch |
| 2532 | 231 | Yes | Stretch |
| 3464 | 3 | Very slight | Stretch |
| 3581 | 28 | Yes | Stretch |
| 3581 | 28 | Yes | Stretch |
Energy Calculations
| NH3 | BH3 | NH3BH3 | Dissociation Energy | |
|---|---|---|---|---|
| Energy / au | -56.55776873 | -26.61532364 | -83.22468909 | -0.05159672 |
| Energy / kJ mol-1 | -148492.42 | -69878.53 | -218506.42 | -135.47 |
The energies of the molecule along with the calculated dissociation energy were then calculated to give a final dissociation energy of -135.47 kJ mol-1. This bond can be considered to be a fairly weak bond as it is significantly lower than a typical medium bond.
Extension: Further NBO Analysis
All calculations used the B3LYP method and 6-31G(d,p) basis set. All molecules were optimised and confirmed through frequency analysis within the standard limits.
Molecules
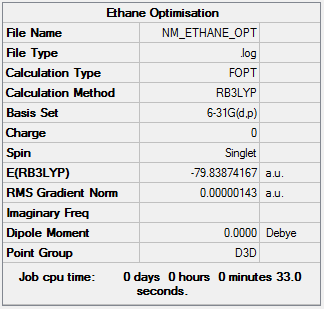
Ethane
Optimisation
| Summary Data | Convergence | Jmol | |||
|---|---|---|---|---|---|
 |
Item Value Threshold Converged? Maximum Force 0.000003 0.000015 YES RMS Force 0.000001 0.000010 YES Maximum Displacement 0.000007 0.000060 YES RMS Displacement 0.000004 0.000040 YES |
|
Optimisation log can be found here. DOI:10042/161037
Frequency
| Summary Data | Low frequencies |
|---|---|
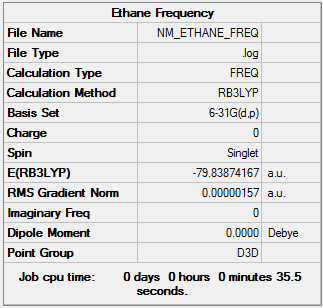 |
Low frequencies --- -1.8545 -1.8503 -0.0009 -0.0006 -0.0005 6.4037 Low frequencies --- 313.0588 828.0017 828.0018 |
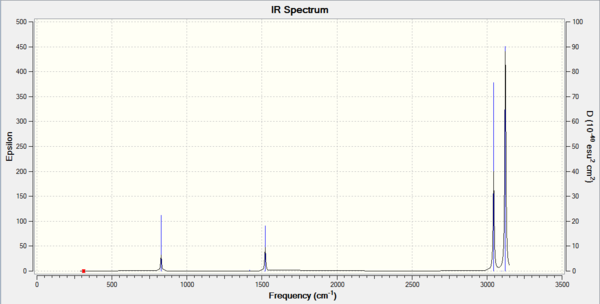
Frequency log can be found here. DOI:10042/161038
NBO
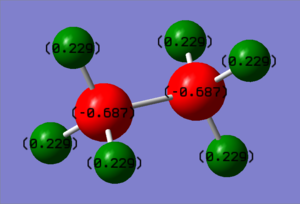
Ethane population file can be found here: DOI:10042/161040
|
|---|
| Charge range between -0.250 and 0.250 |
Ammonia borane
NBO
Aminoborane population file can be found here: DOI:10042/161041

|
|---|
| Charge range between -0.250 and 0.250 |
Comparison
| Molecule | R1 | R2 | H1 | H2 | H3 | H4 | H5 | H6 |
|---|---|---|---|---|---|---|---|---|
| Ethane | -0.687 | -0.687 | 0.229 | 0.229 | 0.229 | 0.229 | 0.229 | 0.229 |
| Ammonia borane | -0.962 | -0.171 | 0.436 | 0.436 | 0.436 | -0.059 | -0.059 | -0.059 |
In ammonia borane, R1 refers to the boron atom with H1, H2 and H3 refer to the hydrogens bonded to boron. R2 refers to the nitrogen atom and H4, H5 and H6 refer to the hydrogens bonded to the nitrogen.
The ethane charge distribution is as expected with the more electronegative carbon atoms holding the negative charge and the hydrogens holding the positive charge. Ammonia borane on the other hand doesn't show equal charge distribution with nitrogen being the most electronegative atom holding the highest negative charge. This charge is balanced by the more electropositve hydrogen atoms directly bonded to it. Despite being the most electropositve atom in the molecule, boron also holds a negative charge due to the N-B bond being a dative bond and an electron pair is donated to the boron atom from the nitrogen. This then also causes the hydrogens bonded to boron to hold a slight negative charge.
NH3BF3
Optimisation
| Summary Data | Convergence | Jmol | |||
|---|---|---|---|---|---|
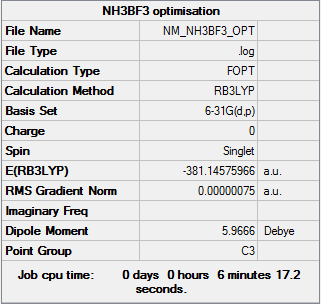 |
Item Value Threshold Converged? Maximum Force 0.000000 0.000015 YES RMS Force 0.000000 0.000010 YES Maximum Displacement 0.000008 0.000060 YES RMS Displacement 0.000003 0.000040 YES |
|
Optimisation log can be found here. DOI:10042/161059
Frequency
| Summary Data | Low frequencies |
|---|---|
 |
LLow frequencies --- -3.1916 -3.1777 -0.0190 0.1133 0.1185 4.3847 Low frequencies --- 124.2504 263.9610 263.9618 |
Frequency log can be found here. DOI:10042/161060
NBO
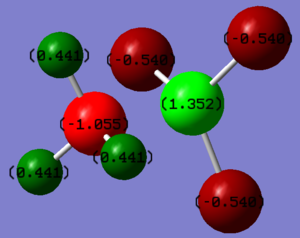
NH3BF3 population file can be found here: DOI:10042/161061
|
|---|
| Charge range between -1.000 and 1.000 |
| Molecule | R1 | R2 | H1 | H2 | H3 | H4 | H5 | H6 |
|---|---|---|---|---|---|---|---|---|
| NH3BF3 | -1.055 | -1.352 | 0.441 | 0.441 | 0.441 | -0.540 | -0.540 | -0.540 |
R1 refers to nitrogen and R2 refers to boron. One method to alter the charge distribution of a bond is to change the substituents on one of the atoms. In this example, hydrogen atoms on the boron were replaced with fluorine atoms. Despite fluorine being the most electronegative atom in existence, the negative charge has to be distributed equally between three atoms meaning they don't carry the single highest negative charge. The boron atom, the most electropositive atom in the molecule, is directly bonded to 4 more electronegative atoms and so holds the most positive charge at 1.352. Nitrogen, being electronegative, holds the most negative charge in the molecule which is balanced by the positive charges held on the hydrogens directly bonded to it.
Aromaticity Project
Introduction
The purpose of this project was to analyse the structures of four aromatic compounds. The MOs of benzene, boratabenzene, pyridinium and borazine were all computed and compared, focusing on the distribution of charge, effects of substitution on the aromatic ring as well as a direct comparison between three selected molecular orbitals.
All calculations used the B3LYP method and 6-31G(d,p) basis set. All molecules were optimised and confirmed through frequency analysis within the standard limits.
Aromatic Molecules
Benzene
Optimisation
| Summary Data | Convergence | Jmol | |||
|---|---|---|---|---|---|
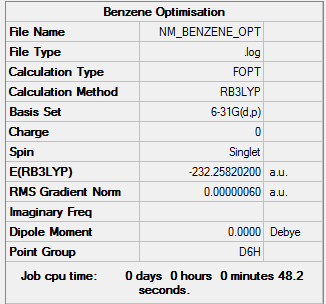 |
Item Value Threshold Converged? Maximum Force 0.000001 0.000015 YES RMS Force 0.000000 0.000010 YES Maximum Displacement 0.000002 0.000060 YES RMS Displacement 0.000001 0.000040 YES |
|
Optimisation log can be found here. DOI:10042/149755
Frequency
| Summary Data | Low frequencies |
|---|---|
 |
Low frequencies --- -10.2549 -5.6651 -5.6651 -0.0054 -0.0053 0.0008 Low frequencies --- 414.5451 414.5451 621.0429 |
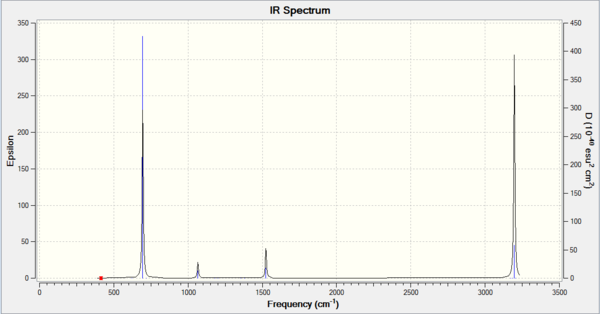
Frequency log can be found here. DOI:10042/149797
| Wavenumber / cm-1 | Intensity | IR Active? | Type |
|---|---|---|---|
| 415 | 0 | No | Bend |
| 415 | 0 | No | Bend |
| 621 | 0 | No | Bend |
| 621 | 0 | No | Bend |
| 695 | 74 | Yes | Bend |
| 718 | 0 | No | Bend |
| 865 | 0 | No | Bend |
| 865 | 0 | No | Bend |
| 975 | 0 | No | Bend |
| 975 | 0 | No | Bend |
| 1013 | 0 | No | Bend |
| 1018 | 0 | No | Bend |
| 1020 | 0 | No | Stretch |
| 1066 | 3 | Very slight | Bend |
| 1066 | 3 | Very slight | Bend |
| 1180 | 0 | No | Bend |
| 1203 | 0 | No | Bend |
| 1203 | 0 | No | Bend |
| 1355 | 0 | No | Stretch |
| 1381 | 0 | No | Bend |
| 1524 | 7 | Very slight | Stretch |
| 1524 | 7 | Very slight | Stretch |
| 1653 | 0 | No | Stretch |
| 1653 | 0 | No | Stretch |
| 3172 | 0 | No | Stretch |
| 3181 | 0 | No | Stretch |
| 3181 | 0 | No | Stretch |
| 3197 | 47 | Yes | Stretch |
| 3197 | 47 | Yes | Stretch |
| 3208 | 0 | No | Stretch |
MO
Benzene population file can be found here: DOI:10042/149838
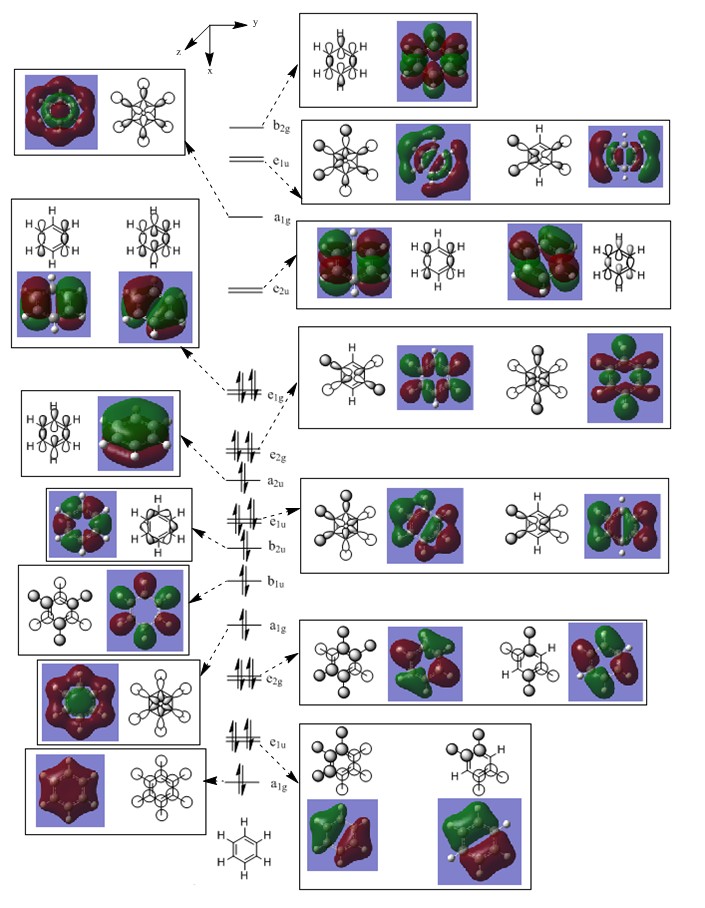
The calculated MOs show good agreement with the MOs which were predicted with LCAO. When there are discrepancies this is mostly a case of delocalisation of the MO over a larger area of the molecule as opposed to simply on and between two atoms. However it must be said in these instances the shape is still very consistent with the LCAOs.
NBO
|
|---|
| Charge range between -0.500 and 0.500 |
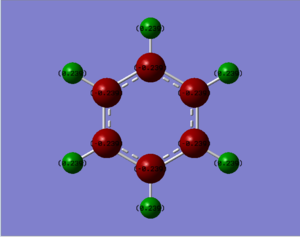
In order for a molecule to be defined as aromatic, it must comply with Hückel’s Rule, which is that there must be 4n+2 number of π electrons (where n is equal to 0 or any positive integer) found in a planar, cyclic, fully conjugated system. This is indeed the case for benzene, which can has 6π electrons present.
The MO which further supports benzene’s aromaticity is the a2u MO which features three fully bonding π MOs above and below the ring, which have go one to form one large delocalised π system. This is simply due to the molecule being cyclic nature and can be interpreted as a normal chain being joined up. This delocalised π system also leads to a carbon-carbon bond length (140 pm[3]) found between that of a typical carbon-carbon single bond (154 pm[3]) and a carbon-carbon double bond (134 pm[3]), further showing the effect the delocalised π system has on the molecule, additional to making it aromatic in nature.
The NBO analysis shows an equal charge distribution between all atoms and therefore no overall dipole moment. The carbon atoms carry the negative charge as they are more electronegative than hydrogen atoms but also support the delocalised π system.
Boratabenzene
Optimisation
| Summary Data | Convergence | Jmol | |||
|---|---|---|---|---|---|
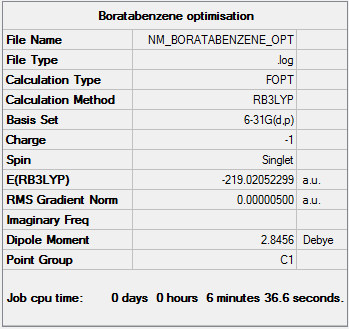 |
Item Value Threshold Converged? Maximum Force 0.000010 0.000015 YES RMS Force 0.000002 0.000010 YES Maximum Displacement 0.000045 0.000060 YES RMS Displacement 0.000013 0.000040 YES |
|
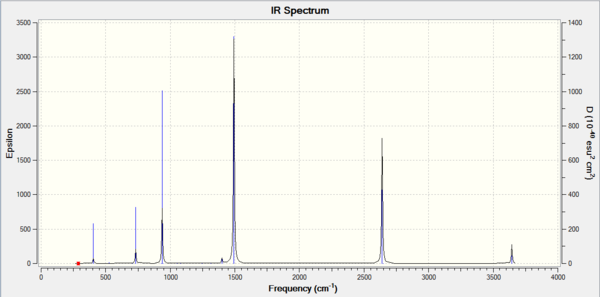
Optimisation log can be found here. DOI:10042/152296
Frequency
| Summary Data | Low frequencies |
|---|---|
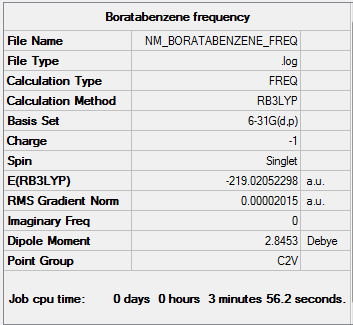 |
Low frequencies --- -7.3704 0.0009 0.0010 0.0011 0.6104 5.1479 Low frequencies --- 371.3351 404.3584 565.0615 |
Frequency log can be found here. DOI:10042/152313
| Wavenumber / cm-1 | Intensity | IR Active? | Type |
|---|---|---|---|
| 371 | 2 | Very slight | Bend |
| 404 | 0 | No | Bend |
| 565 | 0 | No | Bend |
| 568 | 0 | No | Bend |
| 608 | 11 | Slight | Bend |
| 711 | 3 | Very slight | Bend |
| 756 | 7 | Very slight | Bend |
| 815 | 0 | No | Bend |
| 874 | 28 | Yes | Bend |
| 906 | 0 | No | Stretch |
| 917 | 0 | No | Bend |
| 951 | 0 | No | Bend |
| 951 | 0 | No | Bend |
| 961 | 2 | Very slight | Bend |
| 1012 | 4 | Very slight | Stretch |
| 1085 | 3 | Very slight | Bend |
| 1175 | 1 | No | Bend |
| 1180 | 1 | No | Bend |
| 1228 | 1 | No | Stretch |
| 1333 | 31 | Yes | Stretch |
| 1449 | 9 | Very slight | Bend |
| 1463 | 14 | Slight | Bend |
| 1565 | 7 | Very slight | Stretch |
| 1592 | 40 | Yes | Stretch |
| 2447 | 368 | Yes | Stretch |
| 3027 | 108 | Yes | Stretch |
| 3029 | 0 | No | Stretch |
| 3060 | 380 | Yes | Stretch |
| 3061 | 11 | Slight | Stretch |
| 3116 | 112 | Yes | Stretch |
NBO
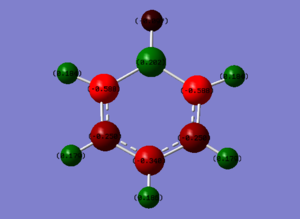
Boratabenzene population file can be found here: DOI:10042/152360
|
|---|
| Charge range between -0.500 and 0.500 |
Pyridinium
Optimisation
| Summary Data | Convergence | Jmol | |||
|---|---|---|---|---|---|
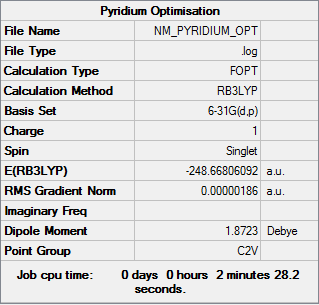 |
Item Value Threshold Converged? Maximum Force 0.000003 0.000015 YES RMS Force 0.000001 0.000010 YES Maximum Displacement 0.000007 0.000060 YES RMS Displacement 0.000002 0.000040 YES |
|
Optimisation log can be found here. DOI:10042/152439
Frequency
| Summary Data | Low frequencies |
|---|---|
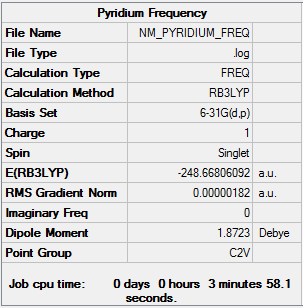 |
Low frequencies --- -9.3869 -2.9694 0.0005 0.0005 0.0007 0.9012 Low frequencies --- 391.9008 404.3425 620.1996 |
Frequency log can be found here. DOI:10042/152458
| Wavenumber / cm-1 | Intensity | IR Active? | Type |
|---|---|---|---|
| 392 | 1 | No | Bend |
| 404 | 0 | No | Bend |
| 620 | 0 | No | Bend |
| 645 | 0 | No | Bend |
| 677 | 90 | Yes | Bend |
| 748 | 82 | Yes | Bend |
| 845 | 11 | Slight | Bend |
| 883 | 0 | No | Bend |
| 992 | 2 | Very slight | Bend |
| 1006 | 0 | No | Bend |
| 1022 | 4 | Very slight | Stretch |
| 1048 | 0 | No | Bend |
| 1052 | 0 | No | Bend |
| 1082 | 3 | Very slight | Bend |
| 1087 | 4 | Very slight | Bend |
| 1200 | 3 | Very slight | Bend |
| 1229 | 2 | Very slight | Bend |
| 1300 | 3 | Very slight | Bend |
| 1374 | 11 | Slight | Stretch |
| 1416 | 3 | Very slight | Bend |
| 1524 | 21 | Yes | Stretch |
| 1580 | 48 | Yes | Stretch |
| 1657 | 32 | Yes | Stretch |
| 1677 | 34 | Yes | Stretch |
| 3224 | 0 | No | Stretch |
| 3240 | 1 | No | Stretch |
| 3242 | 11 | Slight | Stretch |
| 3252 | 20 | Yes | Stretch |
| 3254 | 0 | No | Stretch |
| 3570 | 158 | Yes | Stretch |
NBO
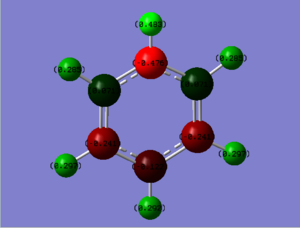
Pyridinium population file can be found here: DOI:10042/155298
|
|---|
| Charge range between -0.500 and 0.500 |
Borazine
Optimisation
| Summary Data | Convergence | Jmol | |||
|---|---|---|---|---|---|
 |
Item Value Threshold Converged? Maximum Force 0.000010 0.000015 YES RMS Force 0.000005 0.000010 YES Maximum Displacement 0.000056 0.000060 YES RMS Displacement 0.000018 0.000040 YES |
|
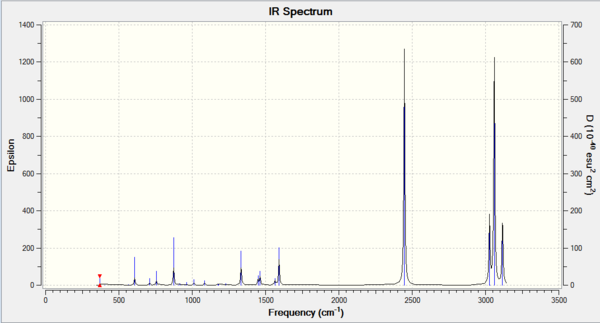
Optimisation log can be found here. DOI:10042/152509
Frequency
| Summary Data | Low frequencies |
|---|---|
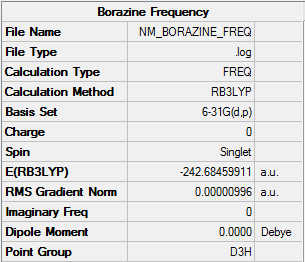 |
Low frequencies --- -4.4958 -4.4782 -3.4787 -0.0039 0.0137 0.0184 Low frequencies --- 289.7312 289.7319 404.5218 |
Frequency log can be found here. DOI:10042/152528
| Wavenumber / cm-1 | Intensity | IR Active? | Type |
|---|---|---|---|
| 290 | 0 | No | Bend |
| 290 | 0 | No | Bend |
| 405 | 24 | Yes | Bend |
| 525 | 1 | No | Bend |
| 525 | 1 | No | Bend |
| 710 | 0 | No | Bend |
| 710 | 0 | No | Bend |
| 732 | 60 | Yes | Bend |
| 865 | 0 | No | Bend |
| 928 | 0 | No | Bend |
| 928 | 0 | No | Bend |
| 937 | 236 | Yes | Bend |
| 945 | 0 | No | Bend |
| 945 | 0 | No | Bend |
| 945 | 0 | No | Bend |
| 1052 | 0 | No | Bend |
| 1081 | 0 | No | Bend |
| 1081 | 0 | No | Bend |
| 1246 | 0 | No | Stretch |
| 1314 | 0 | No | Stretch |
| 1400 | 11 | Slight | Bend |
| 1400 | 11 | Slight | Bend |
| 1492 | 494 | Yes | Bend |
| 1492 | 494 | Yes | Bend |
| 2640 | 284 | Yes | Stretch |
| 2640 | 284 | Yes | Stretch |
| 2650 | 0 | No | Stretch |
| 3642 | 0 | No | Stretch |
| 3644 | 40 | Yes | Stretch |
| 3644 | 40 | Yes | Stretch |
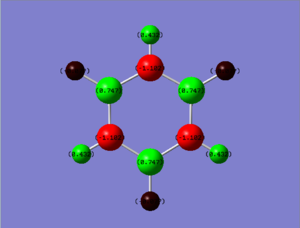
NBO
Borazine population file can be found here: DOI:10042/152560
|
|---|
| Charge range between -0.500 and 0.500 |
NBO Analysis
| Benzene | Boratabenzene | Pyridium | Borazine |
|---|---|---|---|
 |
 |
 |

|
| Molecule | R1 | R2 | R3 | R4 | R5 | R6 | H1 | H2 | H3 | H4 | H5 | H6 |
|---|---|---|---|---|---|---|---|---|---|---|---|---|
| Benzene | -0.239 | -0.239 | -0.239 | -0.239 | -0.239 | -0.239 | 0.239 | 0.239 | 0.239 | 0.239 | 0.239 | 0.239 |
| Boratabenzene | 0.202 | -0.588 | -0.250 | -0.340 | -0.250 | -0.588 | -0.097 | 0.184 | 0.179 | 0.186 | 0.179 | 0.184 |
| Pyridinium | -0.476 | 0.071 | -0.241 | -0.122 | -0.241 | 0.071 | 0.483 | 0.285 | 0.297 | 0.292 | 0.297 | 0.285 |
| Borazine | -1.102 | 0.747 | -1.102 | 0.747 | -1.102 | 0.747 | 0.432 | -0.077 | 0.432 | -0.077 | 0.432 | -0.077 |
Atoms labelled 'R' are those part of the ring. R1 is the top atom and then works clockwise onto R2 and so. It should be noted that the charge distribution of each atom is calculated by taking an average of all the resonance forms of the molecules, an ability which aromaticity allows to happen.
They key property to fully understand charge distribution is electronegativity. The values of which for each atom are as given below[4]:
| Atom | Pauling electronegativity |
|---|---|
| Carbon | 2.25 |
| Hydrogen | 2.20 |
| Boron | 2.04 |
| Nitrogen | 3.04 |
The benzene molecule exhibits equal charge distribution on account of its perfect symmetry and the very small difference in their electronegativities. The carbon atoms are slightly more electronegative and therefore hold the negative charge which is also explained by the delocalised 6 π electron system.
In boratabenzene, the key difference is the substitution of a single carbon atom with a boron atom and in order to keep the molecules isoelectronic, the addition of a negative charge. The boron atom is the most electropositive atom in the molecule and so it holds the most positive charge (0.202). The two carbon atoms adjacent to the boron hold the largest negative charge (-0.588) which can be explained with regards to the π electrons being attracted to where a more positive charge is held due to electrostatic attractive forces. The ortho, meta and para hydrogens show little variation, varying between 0.179 and 0.186 which is also lower than the hydrogens in benzene. This is to be expected as boratabenzene contains a negative charge compared to the neutral benzene. The hydrogen bonded to the boron atom, conversely holds a slight negative charge (-0.097) which indicates the strength of the boron's electropositivity.
The pyridinium molecule differs from benzene in that a single carbon atom is substituted with a nitrogen atom and in order to keep the molecule isoelectronic with benzene, an electron has been removed to give a formal positive charge. The nitrogen atom holds the largest negative charge due to it being the most electronegative atom. Such is its strength, the two closest carbons hold a positive charge which is somewhat unexpected due to the presence of 6 negatively charged π electrons delocalised within the ring. All the hydrogens carry a positive charge with the ortho, meta and para hydrogens varying between 0.285 and 0.297, slightly higher than benzene due to the pyridium's positive charge. The most highly charged hydrogen is found bonded to the nitrogen which is expected due to its strong electronegativity.
Borazine, also known as inorganic benzene, varies from benzene in that the 6 membered ring consists of 3 HB-NH repeating units. The presence of hydrogen remains the same. As expected, after discussion for the previous two molecules, the nitrogen atoms carry an unequal distribution of negative charge as the nitrogen's electronegativity is greater than boron's electropositivity. This means that the hydrogens bonded to boron hold a slight negative charge (-0.007) despite the molecule having an overall neutral charge.
MO Comparison
Comparison 1
| Benzene | Boratabenzene | Pyridinium | Borazine | |
|---|---|---|---|---|
| MO | 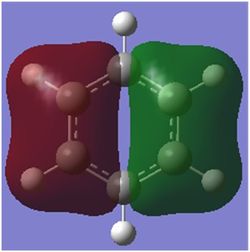
|

|

|

|
| LCAO | 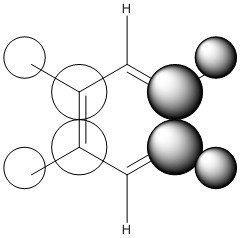
|
|
|

|
| Energy / au | -0.74000 | -0.51956 | -0.99321 | -0.83516 |
| Order | 9th | 8th | 9th | 8th |
| Degenerate? | Yes | No | No | Yes |
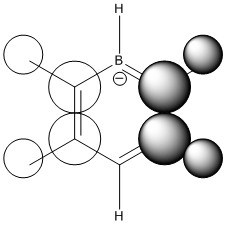
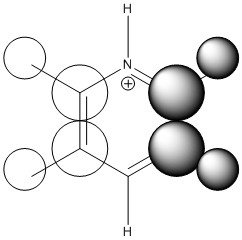
This comparison shows in general the in phase strong through space bonding between the s orbitals on the ortho and meta hydrogens and the s orbitals on the ortho and meta ring atoms. This then naturally goes along with the medium through space anti bonding of the s orbitals of the ring atoms.
Benzene, boratabenzene and pydridinium all show electron density over the ortho and meta positions. Benzene has uniform orbital distribution whereas boratabenzene and pyrdinium show more electron density over the more electronegative parts of the molecule, the para carbon atom and nitrogen atom respectively. Borazine is different as it seems to show that the meta nitrogen atoms contribute the majority of the electron density with the ortho boron atoms not contributing as much and the ortho hydrogen atoms contributing nothing.
When comparing the changes in relative energy, it is clear to see than the nitrogen's electronegativity significantly lowers the energy of the orbital which can also been seen in borazine where nitrogen orbitals contribute more towards the MO. Boron's electropositivity has the opposite effect and so brings the energy of the entire molecular orbital up, despite this MO being one of the lowest lying.
The changes in order can be explained by the loss of degeneracy in boratabenzene, as when degeneracy is lost, one orbital increases in energy and one orbital decreases in energy, such is the case this time. Borazine's change in order is simply due to how the orbitals are assigned in the GaussView software as degeneracy is maintained in this molecule.
It is also possible to see partial p orbital contribution from the atoms in the one and four position in all cases except borazine where it is solely the para ring atom. This is only a minor discrepancy from the predicted LCAO but can be expected due to LCAO being only a model and calculated MOs giving more accurate results.
Comparison 2
| Benzene | Boratabenzene | Pyridinium | Borazine | |
|---|---|---|---|---|
| MO | 
|

|
|

|
| LCAO | 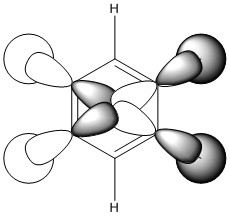
|
|
|
|
| Energy / au | -0.41653 | -0.20373 | -0.65086 | -0.43403 |
| Order | 15th | 14th | 16th | 13th |
| Degenerate? | Yes | No | No | Yes |
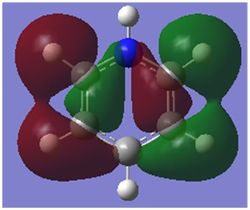
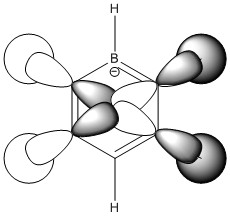
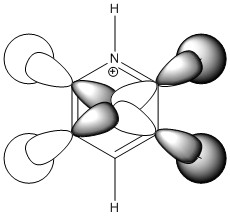
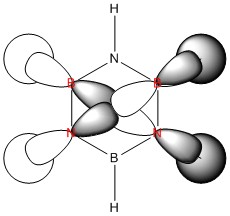
This comparison shows the in phase strong through space bonding between the s orbitals on the ortho and meta positioned hydrogen atoms and the p orbitals on the ortho and meta ring atoms as well as the strong through space anti bonding between the p orbitals on the ortho and meta ring atoms, found in the centre of the ring.
Benzene shows a uniform distribution of the orbital as expected, however boratabenzene and pyridinium show some distortion. In both cases there is a greater electron density found closer the most electronegative position of the molecule. In boratabenzene's case it is the carbon situated furthest away from the boron atom in the para position and in pyridinium it is the nitrogen atom. Borazine is different again as the greater difference in electronegativity between nitrogen and boron than of carbon means even more electron density is found closer to the nitrogen atoms.
The energies of the orbitals are affected by the atoms present in the molecule with clear stabilisation from the nitrogen atom in pyridinium and destabilisation from the boron in boratabenzene. The borazine's relative energy is slightly lower to that of benzene's as the opposing effects of the boron and nitrogen atoms balance each other out, with nitrogen's stabilising effect being greater than boron's destabilising.
The changes in order are also explained by the loss of degeneracy and with these orbitals lying in the middle, the order is also affected by loss of degeneracy of both higher and lower lying orbitals, all of which suffer a stabilisation or destabilisation through losing degeneracy.
The LCAO predicts no contribution of p orbitals in the one and four position, however from looking at the calculated MOs it is possible to see that there is a slight contribution in all four molecules, highlighting further it is best to use LCAO as a rough estimate and that calculated MOs give the most accurate results.
Comparison 3
| Benzene | Boratabenzene | Pyridinium | Borazine | |
|---|---|---|---|---|
| MO | 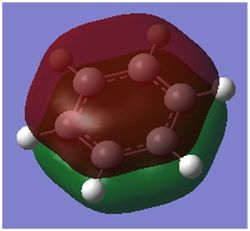
|

|
|

|
| LCAO | 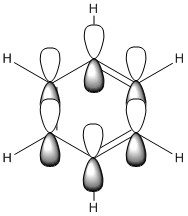
|

|

|
|
| Energy / au | -0.35994 | -0.13209 | -0.64062 | -0.36134 |
| Order | 17th | 17th | 17th | 17th |
| Degenerate? | No | No | No | No |
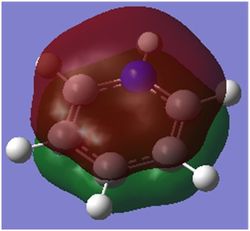
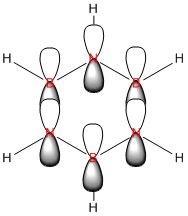
This molecular orbital shows the delocalised π system,. It constitutes entirely of px orbitals found above and below the plane of the ring giving in phase strong through space bonding with no anti bonding component present.
The calculated MOs for all four molecules show a very similar shape with the only differences being a bulging of the orbital around the respective electronegative parts of the molecule: the carbon in the four position in boratabenzene and the nitrogen atoms found in pyridinium and borazine. This is to be expected as more electronegative atoms draw electron density closer to themselves.
The relative energies of the orbitals can be explained in a similar fashion to the orbitals in Comparison 2 in that boron and nitrogen destabilise and stabilise respectively and the symmetry of the borazine atom allows for balance between these effects.
The orbitals all have the same order (17th) which is due to this orbital's contribution to the aromaticity of the molecule which is why there are also no degenerate orbitals present in each molecule.
Where the LCAO suffers in its predictive ability is that it is unable to determine how much each atom's px orbital will contribute to the overall molecular orbital, however knowledge of electronegativities does make this possible to predict without the use of LCAO. All in all, this is a further demonstration of why it is important to calculate the MOs rather than relying on LCAO theory.
Effects of substituition
Any form of alteration of the structure of the benzene molecule leads to a change in the MO. Not only due to there being different atoms present but also affecting the symmetry of the molecule and so its point group allocation.
| Molecule | Point Group |
|---|---|
| Benzene | D6h |
| Boratabenzene | C2v |
| Pyridinium | C2v |
| Borazine | D3h |
As seen above, the molecules all have a different point group from benzene which means the MOs formed will also have different symmetry labels and so will also have different structures as seen in the comparisons above.
The effect of changing a single atom in the case of boratabenzene and pyridinium means the molecule is not made entirely of a repeat unit, the eigenvalues of the orbitals change, likewise the relative energies, in such a manner that no two orbitals are degenerate. The borazine molecule is however made up of a repeat unit and so it is possible to form degenerate orbitals, as seen in the list of MOs below.
The stability of the molecule is also dependent on the atoms present. As the table below shows, pyridinium is the most stable aromatic compound, followed by borazine, benzene and finally boratabenzene which in it's aromatic form is slightly unstable. Benzene and borazine are fairly similar in their MO structure and energies (HOMOs at -0.24690 and -0.27593) which can be explained by the presence of repeat units throughout the compounds allowing for a more equal distribution of electron density. Borazine lies slightly lower in energy due to the presence of nitrogen atoms, which due to their strong electronegativity are able to hold electron density closer than the boron's slight electropositivity. The overall balance between the nitrogen and boron's electronegativities is a more stabilising effect than benzene's uniform carbon ring.
Pyridinium is the most stable molecule with its HOMO at -0.47886. The nitrogen's strong electronegativity is responsible for this value as this atom is able to draw the 6 π electron density closer towards itself and keep the molecule as a whole more stable. Even though there is a significant energy jump to its LUMO (-0.25841), this still lies lower than benzene's HOMO and means that the orbital is harder to access and so harder to be attacked by an electrophile.
Boratabenzene is the most unstable molecule with its HOMO at 0.01095 and its LUMO at 0.21473 making it a quite accessible orbital to undergo electrophilic attack. The reason why the molecule is unstable is due to the boron atom being present. Boron is an electropositive atom and so diverts electron density away from itself. The other atoms in the ring are carbon atoms and they aren't electronegative enough to stabilise the 6 delocalised π electrons well enough and so the stability of the molecule decreases.
| Benzene | Boratabenzene | Pyridinium | Borazine |
|---|---|---|---|

|

|

|

|
Conclusion
This project ultimiately showed the differences experienced in aromatic molecules. It was discovered that boratabenzene is the least stable molecule followed by benzene, borazine and pyridinium being the most stable compound. Through comparison of MOs it was also seen that the more electronegative part of the molecule will move electron density towards itself and will normally contribute more of its atomic orbital to the overall molecular orbital.
Aromaticity Project Extension: Bicyclic Molecules
All calculations used the B3LYP method and 6-31G(d,p) basis set. All molecules were optimised and confirmed through frequency analysis within the standard limits.
Introduction
Naphthalene and azulene are two bicylcic aromatic molecules which are isomers of each other. Naphthalene consists of two 6 membered rings fused together while azulene consists of a five membered ring fused to a seven membered ring. While they vary little in structure their appearances are quite the opposite with naphthalene being colourless and azulene being a deep purple. This extension investigates the reasons for this.
Molecules
Napthalene
Optimisation
| Summary Data | Convergence | Jmol | |||
|---|---|---|---|---|---|
 |
Item Value Threshold Converged? Maximum Force 0.000006 0.000015 YES RMS Force 0.000001 0.000010 YES Maximum Displacement 0.000029 0.000060 YES RMS Displacement 0.000006 0.000040 YES |
|
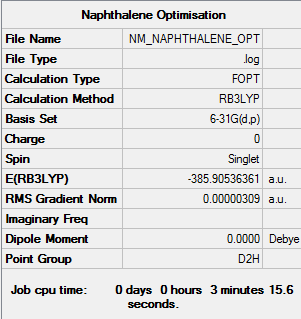
Optimisation log can be found here. DOI:10042/157732
Frequency
| Summary Data | Low frequencies |
|---|---|
 |
Low frequencies --- -6.1773 -2.4489 -1.8159 -0.0009 -0.0006 0.0005 Low frequencies --- 175.6667 189.5266 363.9601 |
Frequency log can be found here. DOI:10042/152337
NBO
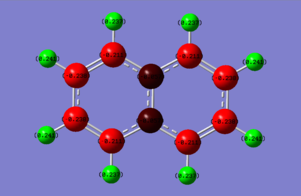
Naphthalene population file can be found here: DOI:10042/152338
|
|---|
| Charge range between -0.250 and 0.250 |
Azulene
Optimisation
| Summary Data | Convergence | Jmol | |||
|---|---|---|---|---|---|
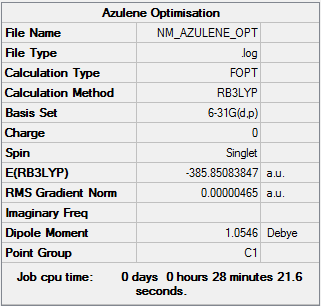 |
Item Value Threshold Converged? Maximum Force 0.000006 0.000015 YES RMS Force 0.000001 0.000010 YES Maximum Displacement 0.000029 0.000060 YES RMS Displacement 0.000006 0.000040 YES |
|
Optimisation log can be found Media:NM AZULENE OPTIMISATION.log. DOI:10042/152364
Frequency
| Summary Data | Low frequencies |
|---|---|
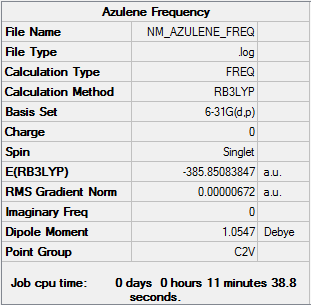 |
Low frequencies --- -5.0388 -4.1802 -3.3724 -0.0010 -0.0010 -0.0010 Low frequencies --- 166.4492 172.4915 322.5521 |
Frequency log can be found here. DOI:10042/157760
NBO
Azulene population file can be found here: DOI:10042/157762

|
|---|
| Charge range between -0.250 and 0.250 |
NBO analysis
| Molecule | C1 | C2 | C3 | C4 | C5 | C6 | C7 | C8 | C9 | C10 | H1 | H2 | H3 | H4 | H5 | H6 | H7 | H8 |
|---|---|---|---|---|---|---|---|---|---|---|---|---|---|---|---|---|---|---|
| Napthalene | -0.057 | -0.211 | -0.238 | -0.238 | -0.211 | -0.057 | -0.211 | -0.238 | -0.238 | -0.211 | 0.237 | 0.241 | 0.241 | 0.237 | 0.237 | 0.241 | 0.241 | 0.237 |
| Azulene | -0.056 | -0.160 | -0.267 | -0.193 | -0.267 | -0.160 | -0.056 | -0.277 | -0.207 | -0.277 | 0.241 | 0.241 | 0.240 | 0.241 | 0.241 | 0.238 | 0.239 | 0.238 |
In naphthalene, the top carbon atom which is part of each ring has been assigned as "C1" with "C2" being the next carbon clockwise and so on. The same pattern follows for hydrogen atoms. In azulene, the top atom which is part of both rings is designated "C1" and carbons are continued to be numbered in a clockwise direction, with hydrogen atoms following suit.
The charge distribution for naphthalene, as expected, shows a uniform distribution of charge between the two aromatic rings. The carbons are more electronegative and so carry the negative charge while the hydrogens carry the positive charge ranging between 0.237 and 0.241. As there are two delocalised systems present in the molecules, it is the two carbons which are part of both rings which have lower charges than the other carbons present at -0.057. This is due to electrostatic repulsion forces between the two delocalised systems forcing each other to either side of the molecule, leaving the central carbon atoms carrying less negative charge.
Azulene follows a similar pattern to napthalene in that all the positive charge is held on the hydrogen atoms and that the two carbons which are a part of both rings carry the least negative charge. Again this is due to the two delocalised π systems repelling each other to leave the central carbons to carry less charge.
In order to explain azulene's colour, which is uncommon for small compounds, it has been shown that azulene has a dipole moment which comes about from the donation of an electron in the seven membered ring into the five membered ring to form the cyclopentadienyl anion and the tropylium cation. This dipole moment is seen in the optimisation with a calculated value of 1.055 Debye. The NBO analysis takes an average value of the charges from each resonance form so it is not possible to see this dipole in the charge distribution.
HOMO/LUMO Gap
| Naphthalene | Azulene |
|---|---|
|
|
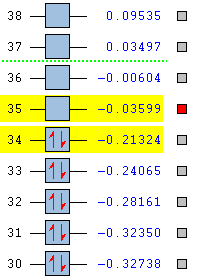
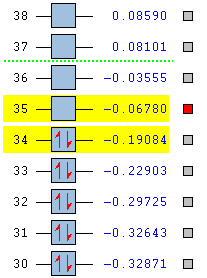
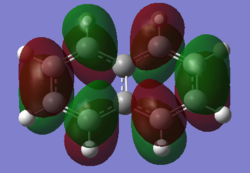
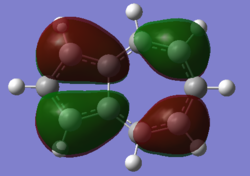
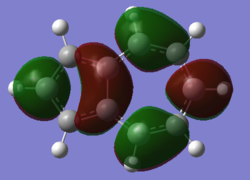
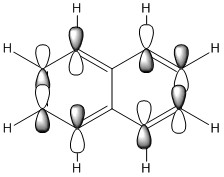
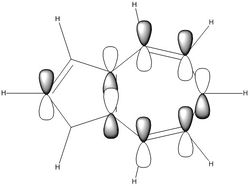
The HOMO/LUMO gap is another factor in allowing azulene to display a colour. When the gap is small, it allows electrons in the HOMO to increase its energy level, into the LUMO with enough energy supplied from a photon. As the table shows, the HOMO/LUMO gap in azulene is 0.12304 au compared to naphthalene's 0.17725 au. While the difference doesn't seem that large, it is clearly enough to allow electron energy level promotion in azulene. After further calculations, the calculated HOMO/LUMO gap gives an emission wavelength of 370 nm, which is slightly under the accepted lowest range of visible light at 380 nm. This is shows a limitation to the GaussView software as this discrepancy is due to being unable to assign a certain MO as being more important to the stability of the molecule, which is the case in this instance.
| Naphthalene HOMO | Naphthalene LUMO | Azulene HOMO | Azulene LUMO | |
|---|---|---|---|---|
| MO | 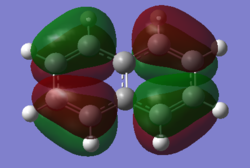
|
|
|
|
| LCAO | 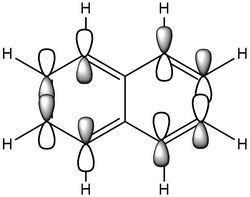
|
|

|
|
| Energy / au | -0.21324 | -0.03599 | -0.19084 | -0.06780 |
| Order | 34th | 35th | 34th | 35th |
| Degenerate? | No | No | No | No |
The HOMO and LUMO for both molecules consist entirely of p orbitals interacting with each other both strong in phase through space bonding and medium out of phase through space anti bonding.
Conclusion
Everything considered, this project has been able to demonstrate why azulene is coloured and naphthalene is not. The computations show that the HOMO/LUMO gap is smaller in azulene allowing for the promotion of electrons, when when returning to their original state emit a deep purple colour. However it has also shown a limitation to the GaussView software in that importance of an MO to overall stability can not be assigned or recognised leading to discrepancies in predictions and actual observations.
References
- ↑ 1.0 1.1 S. Blanksby, G. Ellison, "Bond Dissociation Energies of Organic Molecules", Acc. Chem. Res., 2003,36, 255-263 DOI:10.1021/ar020230d
- ↑ E. Arunan, G.R. Desiraju, R.A Klein, J. Sadlej, S. Scheiner, I. Alkorta, D.C. Clary, R.H. Crabtree, J.J. Dannenberg, P. Hobza, H.G. Kjaergaard, A.C. Legon, B. Mennucci and D.J. Nesbitt, Pure Appl. Chem., 2011, 83, 1618-1636 DOI:10.1351/PAC-REP-10-01-01
- ↑ 3.0 3.1 3.2 Fox, Marye Anne; Whitesell, James K. (1995). Organische Chemie: Grundlagen, Mechanismen, Bioorganische Anwendungen. Springer. ISBN 978-3-86025-249-9
- ↑ Shriver and Atkins' Inorganic Chemistry, Fifth Edition © 2010 P.W. Atkins, T.L. Overton, J.P. Rourke, M.T. Weller, and F.A. Armstrong

