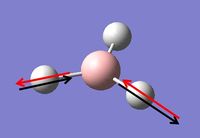
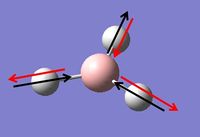
Rep:Mod:NishMeisterMod2
Nisha Mistry
Module 2: Bonding: Ab initio and density functional molecular orbital
BH3 Optimisation
BH3 is the smallest borane, and is in the gaseous state. It's is found as a dimer of B2H6, diborane, which contains bridging hydrogens. The following optimisations and molecular orbital discussions are only concerned with the BH3 monomer.
The 3 B-H bond lengths were extended to 1.5 angstroms using Gaussian. The BH3 molecule was then optimised using the B3LYP method and the 3-21G basis set. The data obtained from this optimisation is shown below.
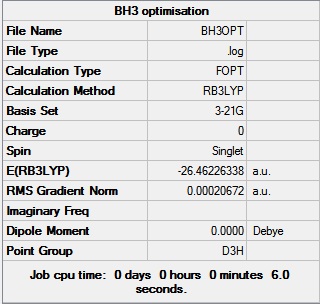
The gradient in the table above is shown to be 0.0002 a.u., which is close to 0 (i.e. less than 0.001 a.u.) and therefore shows that the optimisation is complete. The data from the log file, showing that the molecule has reached the minimum energy conformation is shown here.
        Item               Value     Threshold  Converged?
Maximum Force            0.000413     0.000450     YES
RMS     Force            0.000271     0.000300     YES
Maximum Displacement     0.001610     0.001800     YES
RMS     Displacement     0.001054     0.001200     YES
Predicted change in Energy=-1.071764D-06
Optimization completed.
   -- Stationary point found.
                          ----------------------------
                          !   Optimized Parameters   !
                          ! (Angstroms and Degrees)  !
--------------------------                            --------------------------
! Name  Definition              Value          Derivative Info.                !
--------------------------------------------------------------------------------
! R1    R(1,2)                  1.1935         -DE/DX =    0.0004              !
! R2    R(1,3)                  1.1935         -DE/DX =    0.0004              !
! R3    R(1,4)                  1.1935         -DE/DX =    0.0004              !
! A1    A(2,1,3)              120.0            -DE/DX =    0.0                 !
! A2    A(2,1,4)              120.0            -DE/DX =    0.0                 !
! A3    A(3,1,4)              120.0            -DE/DX =    0.0                 !
! D1    D(2,1,4,3)            180.0            -DE/DX =    0.0                 !
--------------------------------------------------------------------------------
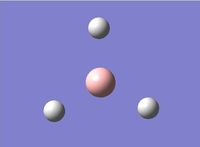
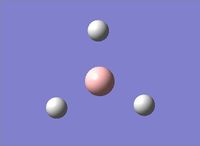
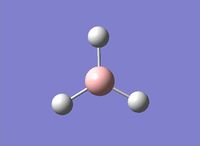
Since it has been determined that the molecule has fully converged, the energy at the different stages in the minimisation of BH3 can be displayed graphically. Below are the representations of the BH3 molecule, along with the graphs of the total energy of the molecule, and the energy of the Root Mean Square gradient at each stage.
| Step 1 | Step 2 | Step 3 | Step 4 |
 |
 |
 |
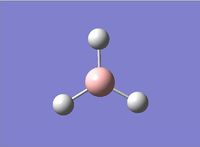 |
Table 1: A table to show the 4 steps in the optimisation of the BH3 molecule
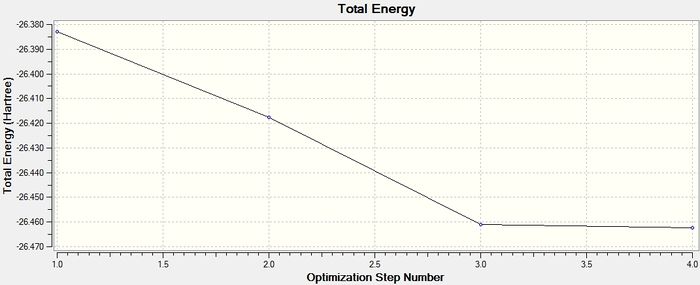
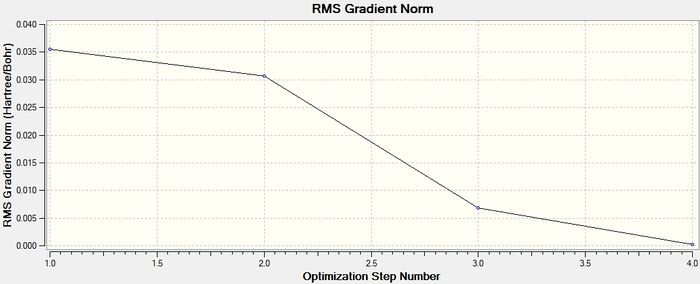
The first two representations of the BH3 molecule given by Gaussian in the minimisation have no bonds. This leads us to a discussion of what can be termed as a bond. A bond is normally thought of as an attraction between two atoms. Computationally there must be certain criteria fulfilled for Gaussian to draw in the bond. Normally there must be a certain length between the atoms, based on the sum of the Van der Waals radii of the atoms, for Gaussian to draw in the bonds and this length varies depending on whether it is an organic or an inorganic molecule, and on the type of bond (single, double and triple).[1] As this is not always accurate, even when Gaussian does not show the bond, we can assume that the bond is in fact there. The Jmol of the optimised BH3 molecule can be found here.
Vibrational Analysis of BH3
Vibrational analysis on the BH3 molecule has been carried out. This is another way to prove that we have indeed reached the true minimum energy. The data from the log file below shows that all the frequencies are positive and so a true minimum energy has been reached. If one of the frequencies was negative it would show that we had reached a transition state, if more than one of the frequencies was negative it would show that we had not reached a minimum and that optimisation had failed. The important information is contained in the lines labeled 'low frequencies', these are the motions of the center of mass of the molecule, and should be lower than the first vibration listed.[2] By looking at the data from the log file, it can be seen that this is indeed the case with this molecule.
Low frequencies ---  -66.7746  -66.3724  -66.3720   -0.0021    0.0030    0.2122
 Low frequencies --- 1144.1477 1203.6411 1203.6421
 Harmonic frequencies (cm**-1), IR intensities (KM/Mole), Raman scattering
 activities (A**4/AMU), depolarization ratios for plane and unpolarized
 incident light, reduced masses (AMU), force constants (mDyne/A),
 and normal coordinates:
                     1                      2                      3
                    A2"                    E'                     E'
 Frequencies --  1144.1477              1203.6411              1203.6421
 Red. masses --     1.2531                 1.1085                 1.1085
 Frc consts  --     0.9665                 0.9462                 0.9462
 IR Inten    --    92.8666                12.3148                12.3173
  Atom  AN      X      Y      Z        X      Y      Z        X      Y      Z
     1   5     0.00   0.00   0.16     0.00   0.10   0.00    -0.10   0.00   0.00
     2   1     0.00   0.00  -0.57     0.00   0.08   0.00     0.81   0.00   0.00
     3   1     0.00   0.00  -0.57    -0.38  -0.59   0.00     0.14   0.38   0.00
     4   1     0.00   0.00  -0.57     0.38  -0.59   0.00     0.14  -0.38   0.00
                     4                      5                      6
                    A1'                    E'                     E'
 Frequencies --  2598.4269              2737.4386              2737.4393
 Red. masses --     1.0078                 1.1260                 1.1260
 Frc consts  --     4.0092                 4.9714                 4.9714
 IR Inten    --     0.0000               103.7400               103.7332
  Atom  AN      X      Y      Z        X      Y      Z        X      Y      Z
     1   5     0.00   0.00   0.00     0.11   0.00   0.00     0.00   0.11   0.00
     2   1     0.00   0.58   0.00     0.02   0.00   0.00     0.00  -0.81   0.00
     3   1     0.50  -0.29   0.00    -0.60   0.36   0.00     0.36  -0.19   0.00
     4   1    -0.50  -0.29   0.00    -0.60  -0.36   0.00    -0.36  -0.19   0.00
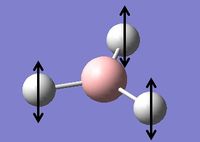
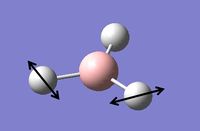
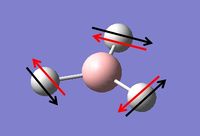
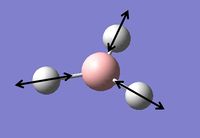
The table below contains the vibrations with a brief description of the type of movement that is giving the frequencies shown above.
Table 2: A table to show the vibrations in the BH3 molecule
The frequencies can also be shown as an IR spectrum, as shown below in figure 4.
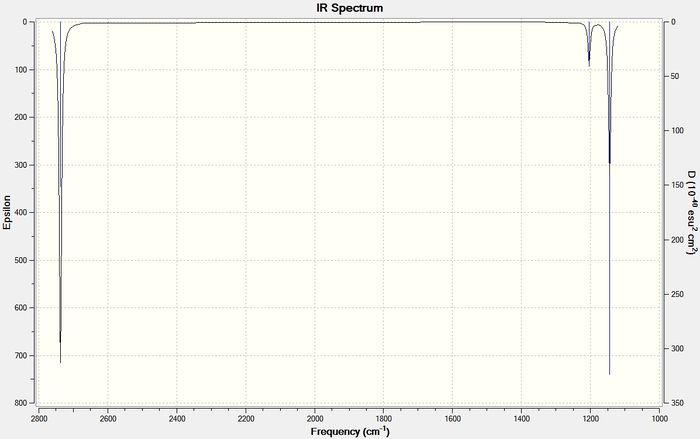
Although there are 6 vibrations there are only 3 peaks visible because one of the vibrations, vibration 4, is not IR active as it does not result in a change in dipole moment. This a requirement for a vibration to show up on an IR spectrum and therefore this vibration has no intensity. The peak at 2737 cm-1 incorporates two of the different types of vibrations, vibrations 5 and 6, as they result in the same type of change in dipole moment, therefore appear at the same frequency. The same is true for vibrations 2 and 3, which both appear at 1203 cm-1. The last remaining vibration, vibration 1, can be seen on the spectrum at 1144 cm-1
Molecular Orbital Analysis of BH3
Quantitative MOs have been obtained using Gaussian, the link to D-space can be found here:DOI:10042/to-10508 . These quantitative MOs have been compared to the qualitative MOs produced by an MO diagram. The MO diagram, drawn on ChemDraw Pro and the MOs calculated by Gaussian are both shown below in figure 5.
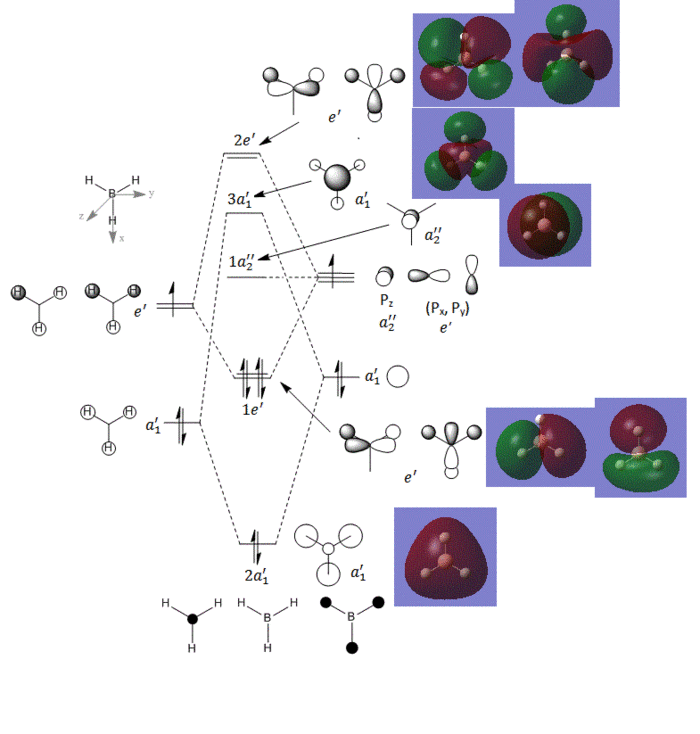
There is clearly a general agreement between the 'real' MOs as calculated by Gaussian and the MOs predicted using the LCAO method. it can be seen that electron density does not strictly fall into the shapes as predicted by the s and p orbitals but rather it is more diffuse. One major difference between the two sets of orbitals is that Gaussian predicts that the 3a'1 MO is higher in energy than the 2e' MO. This shows us that computational methods are more accurate at predicting the relative energies of the orbitals, compared to qualitative methods but that qualitative method can give a good indication of the MOs which would be expected.
Natural Bond Analysis
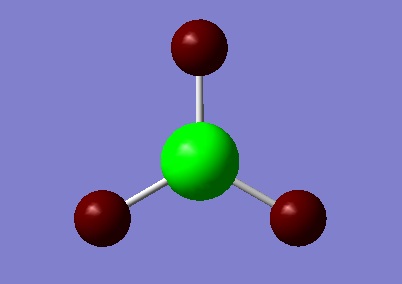
Natural bond analysis can tell us many things about the BH3 molecule. Gaussian can be used to show the charge distribution on a molecule. The data below, taken from the log file shows that the natural charge on the boron atom is +0.33161 and on each of the protons is -0.11054, which overall makes this molecule neutral. This information was also shown in the summary in figure 6, which stated that the molecule has no dipole.
                                       Natural Population
                Natural  -----------------------------------------------
    Atom  No    Charge         Core      Valence    Rydberg      Total
 -----------------------------------------------------------------------
      B    1    0.33161      1.99903     2.66936    0.00000     4.66839
      H    2   -0.11054      0.00000     1.11021    0.00032     1.11054
      H    3   -0.11054      0.00000     1.11021    0.00032     1.11054
      H    4   -0.11054      0.00000     1.11021    0.00032     1.11054
 =======================================================================
   * Total *    0.00000      1.99903     6.00000    0.00097     8.00000
The other data that can be obtained from this kind of analysis is the type of bonding in the BH3 molecule.
(Occupancy)   Bond orbital/ Coefficients/ Hybrids
 ---------------------------------------------------------------------------------
     1. (1.99853) BD ( 1) B   1 - H   2
                ( 44.48%)   0.6669* B   1 s( 33.33%)p 2.00( 66.67%)
                                            0.0000  0.5774  0.0000  0.0000  0.0000
                                            0.8165  0.0000  0.0000  0.0000
                ( 55.52%)   0.7451* H   2 s(100.00%)
                                            1.0000  0.0000
     2. (1.99853) BD ( 1) B   1 - H   3
                ( 44.48%)   0.6669* B   1 s( 33.33%)p 2.00( 66.67%)
                                            0.0000  0.5774  0.0000  0.7071  0.0000
                                           -0.4082  0.0000  0.0000  0.0000
                ( 55.52%)   0.7451* H   3 s(100.00%)
                                            1.0000  0.0000
     3. (1.99853) BD ( 1) B   1 - H   4
                ( 44.48%)   0.6669* B   1 s( 33.33%)p 2.00( 66.67%)
                                            0.0000  0.5774  0.0000 -0.7071  0.0000
                                           -0.4082  0.0000  0.0000  0.0000
                ( 55.52%)   0.7451* H   4 s(100.00%)
                                            1.0000  0.0000
     4. (1.99903) CR ( 1) B   1           s(100.00%)
                                            1.0000  0.0000  0.0000  0.0000  0.0000
                                            0.0000  0.0000  0.0000  0.0000
     5. (0.00000) LP*( 1) B   1           s(100.00%)
The data above shows that the 3 B-H bonds are made up of 33.33% s orbital and 66.67% p orbital which makes them sp3 orbitals, and that only 44.48% of the bond is made up by the boron orbitals, the other 55.52% coming from the hydrogen orbitals. The data also shows the 1s orbital of boron (4.) and the presence of a lone pair (5.).
The data below shows the interactions from bonding NBOs into non-bonding NBOs. In the case of this molecule there are very little interaction between the bonding and non-bonding NBOs, as shown by the low energies obtained for E(2) energy.
Second Order Perturbation Theory Analysis of Fock Matrix in NBO Basis

     Threshold for printing:   0.50 kcal/mol
                                                                              E(2)  E(j)-E(i) F(i,j)
         Donor NBO (i)                     Acceptor NBO (j)                 kcal/mol   a.u.    a.u.
 ===================================================================================================

 within unit  1
   4. CR (   1) B   1                / 10. RY*(   1) H   2                    1.51    7.54    0.095
   4. CR (   1) B   1                / 11. RY*(   1) H   3                    1.51    7.54    0.095
   4. CR (   1) B   1                / 12. RY*(   1) H   4                    1.51    7.54    0.095
This final set of data below shows the energy and occupation of the B-H bonds and the lone pair. It shows that there are two electrons in each of the bonds.
Natural Bond Orbitals (Summary):

                                                            Principal Delocalizations
           NBO                        Occupancy    Energy   (geminal,vicinal,remote)
 ====================================================================================
 Molecular unit  1  (H3B)
     1. BD (   1) B   1 - H   2          1.99853    -0.43712
     2. BD (   1) B   1 - H   3          1.99853    -0.43712
     3. BD (   1) B   1 - H   4          1.99853    -0.43712
     4. CR (   1) B   1                  1.99903    -6.64476  10(v),11(v),12(v)
     5. LP*(   1) B   1                  0.00000     0.67666
     6. RY*(   1) B   1                  0.00000     0.37177
     7. RY*(   2) B   1                  0.00000     0.37177
     8. RY*(   3) B   1                  0.00000    -0.04532
     9. RY*(   4) B   1                  0.00000     0.43446
    10. RY*(   1) H   2                  0.00032     0.90016
    11. RY*(   1) H   3                  0.00032     0.90016
    12. RY*(   1) H   4                  0.00032     0.90016
    13. BD*(   1) B   1 - H   2          0.00147     0.41201
    14. BD*(   1) B   1 - H   3          0.00147     0.41201
    15. BD*(   1) B   1 - H   4          0.00147     0.41201
       -------------------------------
              Total Lewis    7.99463  ( 99.9329%)
        Valence non-Lewis    0.00441  (  0.0551%)
        Rydberg non-Lewis    0.00097  (  0.0121%)
       -------------------------------
            Total unit  1    8.00000  (100.0000%)
           Charge unit  1    0.00000
TlBr3 Optimisation
TlBr3 is another small molecule with a trigonal planar structure. The molecule was drawn in Gaussian and the symmetry restricted to the D3h point group. The molecule was optimised using the DFT B3LYP method, and the LanL2DZ basis set, this is a medium level basis set which allows the calculation to be completed within a reasonable amount of time. A Jmol of the optimised structure can be found here and a link to D-space here: DOI:10042/to-10506 The data obtained from the optimisation is shown below in figure 7.
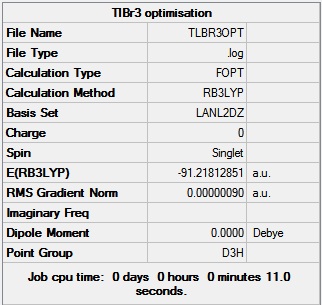
The same basis set must be used for the optimisation and frequency calculations so that they are both calculated to the same accuracy, the larger the basis set the more accurate the calculation. The LanL2DZ basis set is a medium level basis set.
The frequency must be calculated as this proves that the molecule has in fact reached the minimum energy. The link to D-space for this file can be found here:DOI:10042/to-10630 . The low frequencies obtained were extracted from the log file and are shown below along with the frequencies of the vibrations.
Low frequencies ---   -3.4213   -0.0026   -0.0004    0.0015    3.9367    3.9367
Low frequencies ---   46.4289   46.4292   52.1449
The frequencies of each of the vibrations have be tabulated below.The lowest "real" normal mode is 46.43 cm-1.
| Number | Frequency (cm-1) | Intensity |
| 1 | 46.43 | 3.7 |
| 2 | 46.43 | 3.7 |
| 3 | 52.14 | 5.8 |
| 4 | 165.27 | 0.0 |
| 5 | 210.69 | 25.5 |
| 6 | 210.69 | 25.5 |
Table 3: A table to show the frequencies and intensities of the vibrations in TlBr3
This data shows that since the low frequencies are all an order of magnitude smaller than the frequencies and all the frequencies are positive, the molecule has been minimised correctly.
The optimised Tl-Br bond length was 2.65 angstroms and the optimised Br-Tl-Br bond angle was 120° The literature value was 2.51 angstroms for the bond length which compares very well to the computed length.[3] The bond angle of 120° is exactly what would be expected for a trigonal planar molecule.
As noted above, Gaussian can, in some structures, not draw in the bond. However this does not mean that the bond is not there, it simply means that the atoms are further apart than Gaussians predefined, required lengths, in order for a bond to be drawn in. Inorganic bonds are typically longer than organic bonds and so do not fulfill the criteria needed in order for Gaussian. A bond can be defined as an electrostatic attraction between the electrons and nuclei of atoms. When atoms are too close together, there are high energy repulsive forces between the electrons of the atoms, and the two nuclei of the atoms. When the atoms are too far apart there are not enough attractive forces to hold them together. Between these two extremes there is a distance at which the two atoms are a certain distance apart as to give a minimum energy. This is defined as the optimum bond length. The change in energy with bond length can be described by the Lennard-Jone potential.
Isomers of Mo(CO)4L2
Cis-Mo(CO)4(PCl3)2 and trans-Mo(CO)4(PCl3)2 have been optimised using the B3LYP method and the LANL2MB basis set. The links to D-space for these first optimisations can be found here - Cis:DOI:10042/to-10633 and Trans:DOI:10042/to-10634 . These optimised structure were then modified so that the for the cis conformer, one of the Cl points up, parallel to the axial bond, and the other down. For the trans conformer, the structure was modifies so that both the PCl3 groups were eclipsed, and one of the P-Cl bonds lay parallel to a Mo-C bond. The optimisations were then carried out using the B3LYP method and LANL2DZ pseudo-potential and basis sets. LANL2DZ is a better basis set and gives a much more accurate minimum energy. The completed optimisations were deposited in D-space, the links can be found here - Cis:DOI:10042/to-10635 and Trans:DOI:10042/to-10635 .
The data from the final optimisations of the cis and trans conformers are shown below.
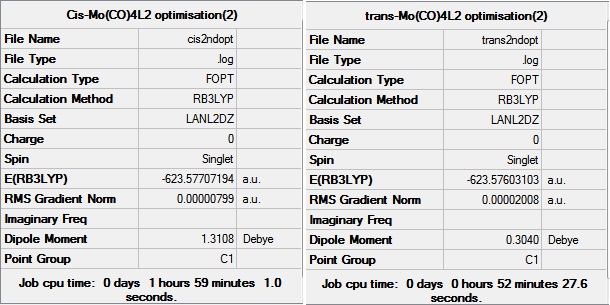
The Jmols for the two structures are here:
Data taken from the log files showed that the structures have converged, however the frequencies are computed to ensure that the molecules are at the true minimum.
The geometries of the two optimised molecules, as computed by Gaussian, have been compared with those found in literature.
| Cis Conformer | Trans Conformer | |||||||
| Bond lengths (angstroms) | Angles (°) | Bond lengths (angstroms) | Angles (°) | |||||
| Gaussian | Literature | Gaussian | Literature | Gaussian | Literature | Gaussian | Literature | |
| Mo-P | 2.51 | 2.58 | - | - | 2.44 | 2.50 | - | - |
| C=O | 1.17 | 1.15 | - | - | 1.17 | 1.16 | - | - |
| Mo-C | 2.10 | - | - | - | 2.06 | 2.01 | - | - |
| P-Mo-P | - | - | 94.15 | 104.62 | - | - | 177.38 | - |
| P-Mo-C | - | - | - | - | - | - | 90.00 | 87.2 |
Table 4: A table to show the frequencies and intensities of the CO stretches in the cis and trans conformers[4][5]
From these values it can be seen that the bond lengths and angles obtained via computational method strongly agree with the data obtained from crystal structures. The data has been taken from compounds containing the PPh3 ligand, not the PCl3 ligand, as PCl3 has been used in this case to make the computational chemistry easier and faster. The Mo-P bond lengths appear to be shorter in the trans conformer, compared to the cis conformer. This is due to reduced steric hindrance.
The final energy of the two conformers has been obtained from the data from the frequency calculations.
| Cis Conformer | Trans Conformer | |
| Energy (a.u.) | -623.577 | -623.576 |
Table 5: A table to show the energies of the two conformers
The difference in energies was 0.00104 a.u. which is 2.73 kJ mol-1. This is a very small energy difference, and the cis conformer appears to be more stable than the trans conformer. Since it is known that, experimentally, the cis conformer isomerises to the trans conformer at room temperature, it would be expected that the trans conformer is lower in energy. A more accurate basis set can be used, because we know that phosphorous has low lying d atomic orbitals and likes to by hypervalent. The d atomic orbital functions can be added by editing the Gaussian input file. The keyword 'extrabasis' was added to the line beginning with a # and the following text was added to the bottom of the file.
P 0
D  1  1.0
0.55  0.100D+01
****
The data obtained from these optimisations are shown in figure 9.
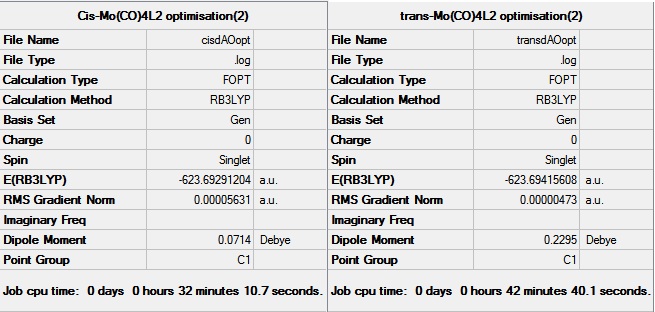
The links to D-space for these optimisations can be found here: Cis - DOI:10042/to-10880 and Trans - DOI:10042/to-10884 .
The energy of the two molecules from these calculations are shown in the table below and it can be seen that they are very similar. The trans conformer is now the more stable with the difference in energy now being 3.27 kJ mol-1.
| Cis Conformer | Trans Conformer | |
| Energy (a.u.) | -623.69 | -623.69 |
Table 6: A table to show the energies of the two conformers after taking d atomic orbitals into consideration
The Jmols for the two conformers obtained in this optimisation are shown below. The Jmols for the two structures are here:
Frequency Calculations
Below is data from the log files for the frequency calculations, taking the dAOs into account. This data shows that since none of the frequencies are negative, a true minimum has been reached for both conformers. The data is shown below.
For the cis conformer, the lowest "real" mode is 11.75 cm-1.
Low frequencies ---   -1.3028   -0.0004    0.0004    0.0008    0.7993    1.9474
Low frequencies ---   11.7516   20.2818   45.8825
For the trans conformer, the lowest "real" mode is 4.59 cm-1.
Low frequencies ---   -2.3116   -1.9751   -0.0001    0.0002    0.0003    2.8935
Low frequencies ---    4.5912    7.0172   40.4809
The frequencies for the two conformers can be shown as IR spectra.
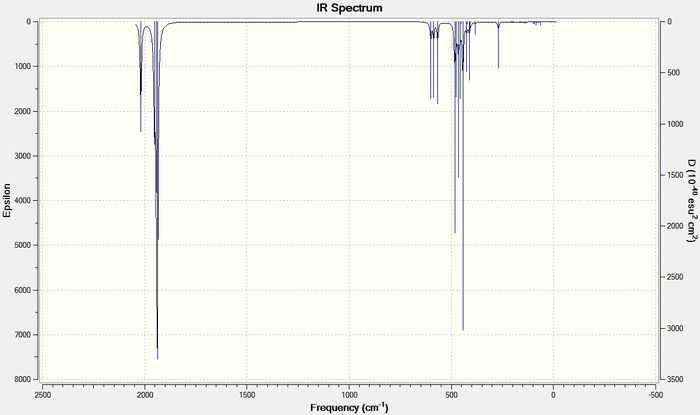
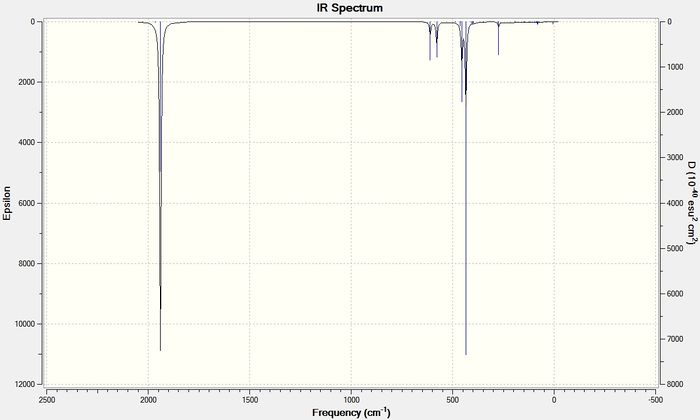
From these spectra it can be seen that for the cis conformer there are 4 bands for the carbonyl stretches and for the trans conformer there is only 1 band for the carbonyl stretches. The frequencies and intensities for these bands are shown in the table below.
| Cis Conformer | Trans Conformer | |||
| Number | Frequency (cm-1) | Intensity | Frequency (cm-1) | Intensity |
| 42 | 1938.06 | 1605.1 | 1939.19 | 1605.59 |
| 43 | 1941.50 | 813.1 | 1939.90 | 1605.99 |
| 44 | 1952.35 | 588.3 | - | - |
| 45 | 2019.11 | 544.7 | - | - |
Table 7: A table to show the frequencies and intensities of the CO stretches in the cis and trans conformers
The vibrations and rotations with a very low energy, i.e. a very low frequency, indicates that the bond responsible for that frequency is only rotating or vibrating very slowly at room temperature.
By looking at the IR spectra, it seems as though there are only 2 bands observed for the cis conformer and 1 band for the trans conformer. This is because, for both the complexes, some of the modes of vibration cause bands at very similar frequencies. In the spectrum of cis-Mo(CO)4(PCl3)2 modes 42, 43 and 44 all have very similar frequencies of 1938 cm-1, 1942 cm-1and 1952 cm-1 and so appear as one band on the IR spectrum. The IR spectrum for the trans conformer shows one band as expected. There are two vibrational modes that contribute to this band but they appear at exactly the same frequency of 1939 cm-1. This data matches the literature data, in that 4 bands would be expected for the cis conformer and 1 band is expected for the trans conformer. For the PPh3 ligand the literature values for the stretching frequencies in the cis complex were 1897 cm-1, 1908 cm-1, 1927 cm-1, and 2023 cm-1. For the trans conformer the literature value for the stretching frequency was at 1901 cm-1.[6]
Mini Project
An investigation into the effect of having Ga, In or Tl in place of one B atom in B2H6
The aim of this project was to take diborane, B2H6 and look at the effect on the structure, MOs (of BGaH6) and vibrations when one of the borones is exchanged for a heavier atom of the same group. Aluminium was not included in this investigation. The molecules investigated were diborane, BGaH6, BInH6 and BTlH6. The four molecules have been optimised using the DFT B3LYP method and the 6-311G basis set. For the heavy atoms, pseudo-potentials have been used. This was done by choosing GEN as the basis set in Gaussian and by adding the following to the bottom of the input file, where M is Ga, In or Tl.
M 0
LanL2DZ
****
B H 0
6-311G(d,p)

M 0
LanL2DZ
Below is the summary from the optimised calculations. It shows that the molecules have been optimised since the gradients are all very close to 0. Frequencies were used to confirm this optimisation, the results of which are shown further below.

Links to D-Space for the optimisation calculations:
B2H6 - DOI:10042/to-10781
BGaH6 - DOI:10042/to-10782
BInH6 - DOI:10042/to-10783
BTlH6 - DOI:10042/to-10784
The summaries show that on addition of the heavier atoms the dipole moment increases. The energies of the molecules have been shown below with the difference in energy compared to diborane. The Jmols for each molecule are also shown in the table. As explained above Gaussian can misplace bond on the optimised molecules. Experimentally it is known that there is no bond between the two boron atoms (or boron and heavy atom), but rather that there are two bridging hydrogens. The optimised structures were altered for the purpose of providing Jmols, the remainder of the structure have been unaltered and so contain the 'wrong' bonds. Also below in table 7 are the bond lengths for the terminal and bridging hydrogens, where M is Ga, In or Tl.
| Molecule | ||||
| Energy (a.u.) | -53.3 | -30.5 | -30.3 | -80.0 |
| Energy difference compared to diborane (a.u) | - | 22.8 | 22.5 | -26.7 |
| Terminal B-H bond lengths (angstroms) | 1.19 | 1.19 | 1.19 | 1.20 |
| Bridging B-H bond lengths (angstroms) | 1.32 | 1.28 | 1.28 | 1.27 |
| Terminal M-H bond lengths (angstroms) | - | 1.55 | 1.71 | 1.79 |
| Bridging M-H bond lengths (angstroms) | - | 1.78 | 1.96 | 2.13 |
Table 8: A table to show the energies and geometric properties of the 4 molecules
Table 4 shows that, on replacing a boron atom with a gallium or indium atom, the molecule becomes less stable by almost 23 hartrees, whereas on replacing a boron atom with a thallium atom, the molecule becomes more stable by almost 27 hartrees. In kJ mol-1 these are very large energy differences.
It can be seen that on changing the heavy atom, the bond length of the terminal B-H bonds do not change, however there is a significant change in the bridging B-H bond length. As the heavy atom gets larger (i.e. down the group) the B-H bridging bond distance gets shorter but the M-H bridging bond distance gets significantly longer. The compound containing thallium has a M-H bridging bond length of almost double the B-H bond length. This is because as the heavy atom gets larger there is a poorer overlap between its large diffuse orbitals and the small s orbital of the hydrogen atom, resulting in a very long and therefore weak bond.
The bond distances for the B2H6 molecule agree strongly with literature values of 1.19 angstroms and 1.33 angstroms for the terminal and bridging hydrogens respectively.[7]
The bond distance for the BGaH6 molecule also strongly agree with the literature values of 1.56 angstroms and 1.79 angstroms for the terminal and bridging hydrogens respectively.[8]
No literature data could be found for the BInH6 and BTlH6 molecules.
Frequency Calculations
The frequency calculations were also carried out for these molecules. As well as ensuring that the molecules had been correctly minimised the frequencies give important information about the vibrations in the molecule.
Below are the links to D-space for frequency calculations:
B2H6 - DOI:10042/to-10785
BGaH6 - DOI:10042/to-10786
BInH6 - DOI:10042/to-10787
BTlH6 - DOI:10042/to-10788
The low frequency data from the log files shows that the molecules are at the true minimum. This data is shown below.
B2H6:
Low frequencies ---    0.0004    0.0004    0.0004   17.8747   18.5544   28.1715
Low frequencies ---  357.7416  797.2208  848.7550
BGaH6:
Low frequencies ---  -39.9029  -10.2122   -8.5789   -0.0001    0.0002    0.0003
Low frequencies ---  222.5957  456.2486  469.0738
BInH6:
Low frequencies ---  -29.6669   -7.6840    0.0001    0.0001    0.0001    1.7635
Low frequencies ---  173.2788  361.0489  417.6341
BTlH6:
Low frequencies ---   -0.0002   -0.0001    0.0002    4.9655   14.6088   37.8099
Low frequencies ---  162.0004  300.8713  356.1554
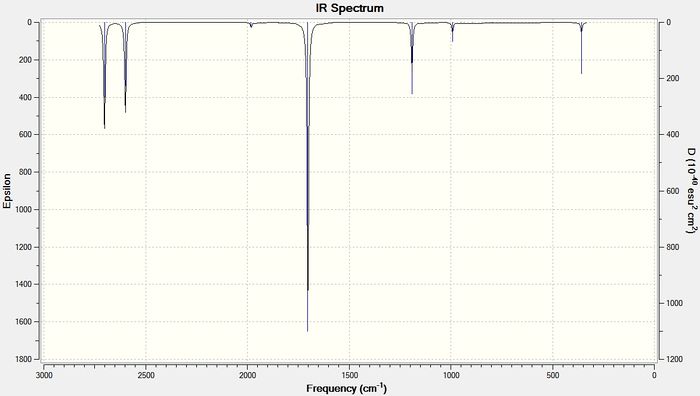
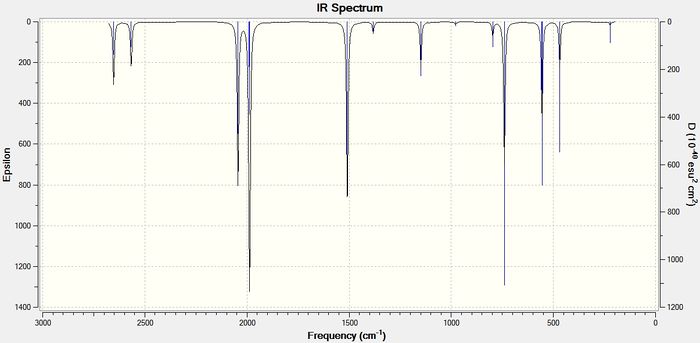
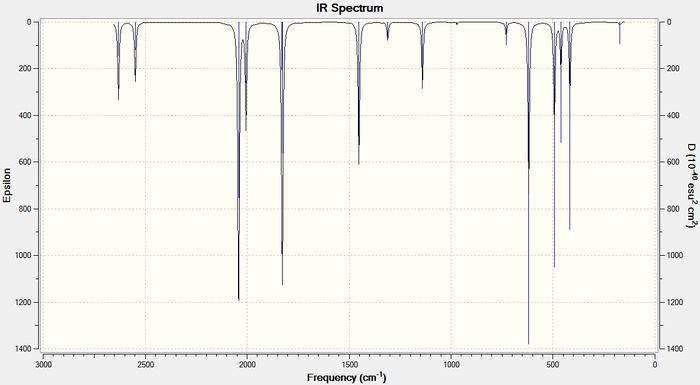
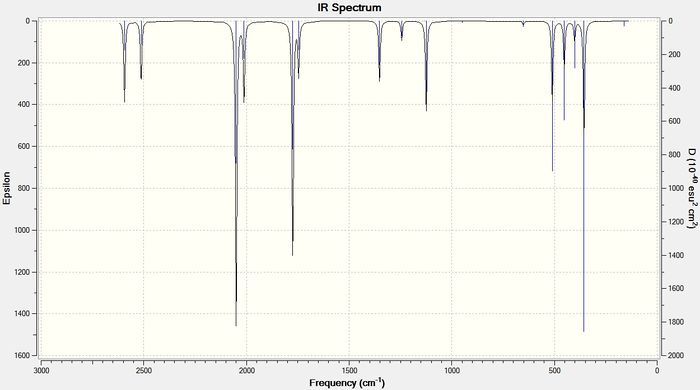
The bond length data has already shown that on increasing the size of the heavy atom, the bridging hydrogen bonds get weaker due to poorer orbital-orbital overlap between the group 13 atom and the hydrogen 1s orbitals. The vibrational frequency of the bridging hydrogens reflect this trend. Table 8 below shows the IR stretching frequencies of the bridging hydrogens in each molecule.
| Molecule | Frequency (cm-1) |
| B2H6 | 1702.35 |
| BGaH6 | 1508.53 |
| BInH6 | 1452.03 |
| BTlH6 | 1351.75 |
Table 9: A table to show the IR stretching frequencies of the bridging hydrogen bonds
As the size of the heavy atom is increased the frequencies of the stretches get lower. A lower stretching frequency means a weaker bond. This agrees with the bond length data described above. The four IR spectra for the compounds are shown below in figures 13-16
Diborane:
BGaH6:
BInH6:
BTlH6:
Molecular Orbital Analysis
Below is the molecular orbital diagram for diborane, drawn on ChemDraw Pro, using the LCAO method. The molecular orbitals of diborane and BGaH6 have been calculated using Gaussian.
The links to D-Space for the MO analysis are:
Diborane - DOI:10042/to-10798
BGaH6 -DOI:10042/to-10912
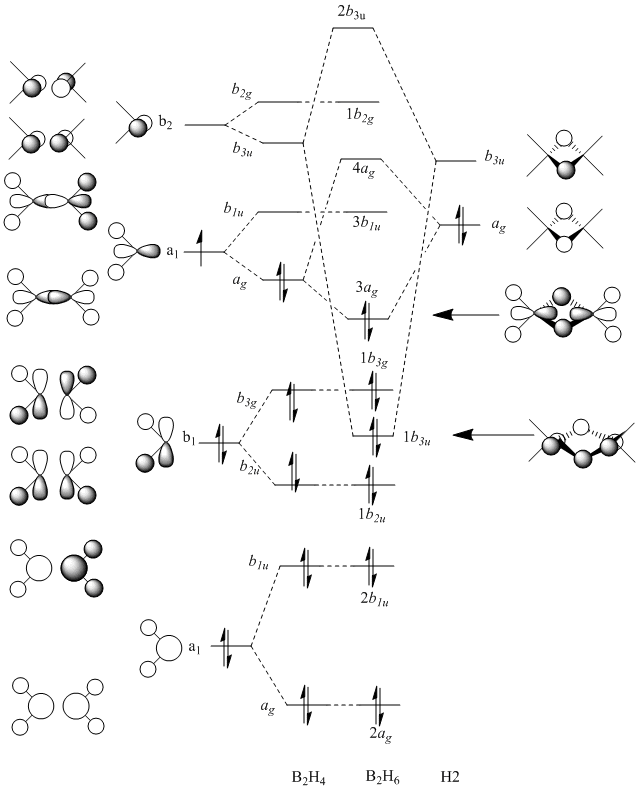
The table below shows the MOs for diborane and BGaH6 calculated by Gaussian. According to gaussian the HOMO and LUMO for diborane were orbitals 8 and 9 respectively, and for BGaH6 were orbitals 7 and 8 respectively. Where possible the symmetry has been assigned to the computed MOs, to match those in the molecular orbital diagram above.
| MO number according to Gaussian | 2 | 3 | 4 | 5 | 6 | 7 | 8 | 9 | 10 | 11 | 12 |
| B2H6 MOs | - |  |
 |
 |
 |
 |
 |
 |
 |
 |
 |
| BGaH6 MOs |  |
 |
 |
 |
 |
 |
 |
 |
- | - | - |
Table 10: A table to show the MOs of diborane and
The unoccupied orbitals are poorly represented by the methods used in this report and so will therefore be mostly discounted in the discussion. In general the occupied orbitals computed by Gaussian for diborane agree with the orbitals predicted by the LCAO method. There are two sets of orbitals which appear reversed in the Gaussian calculations, compared to the MO diagram. Gaussian put MO 8, with 1b3g symmetry as the HOMO, whereas in the MO diagram, the 3ag orbital is the HOMO.
For BGaH6, more of the orbitals as calculated by Gaussian do not match the relative energies as predicted by the LCAO method. It would be expected that since Ga and B are in the same group in the periodic table, that the MO diagrams would be very similar, hence the comparison between the LCAO MO diagram for diborane and the MOs calculated by Gaussian for BGaH6.
Calculations by Gaussian showed that the 1b3u orbital (orbital 4 as calculated by Gaussian) would be lower in energy than the 1b2u orbital (orbital 5 as calculated by Gaussian). The MO diagram shows the opposite. Gaussian also shows orbital 7, which has 1b3g symmetry, as the HOMO, where as the LCAO method has the 3ag orbital as the HOMO.
Gaussian has also calculated that there are another 2 bonding orbitals (not shown on the MO digram) with a lower energy than the 2ag orbital (the lowest energy orbital as shown on the MO digram) for diborane, whereas for the BGaH6 molecule there is only one extra bonding orbital calculated by Gaussian, that is not shown on the MO diagram.
Overall there appears to be general agreement between the LCAO method and the orbitals calculated by Gaussian, but Gasussian appears to be a more accurate method for calculating the relative energies of the orbitals.
Natural Bond Orbital Analysis
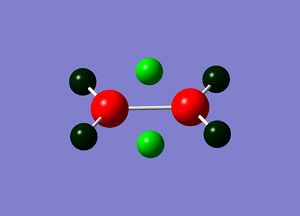
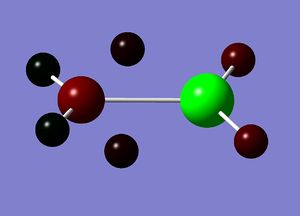
Natural bond orbital analysis gives more information about the atomic charges. The figures below show the charge distribution over the four molecules where red is areas of high electron density and green are areas of low electron density. The summaries of Natural Population Analysis has been taken from the log files of each of the molecules.
Links to D-space for NBO analysis:
In - DOI:10042/to-10905
Tl - DOI:10042/to-10906
Diborane:
Summary of Natural Population Analysis:

                                       Natural Population
                Natural  -----------------------------------------------
    Atom  No    Charge         Core      Valence    Rydberg      Total
 -----------------------------------------------------------------------
      B    1   -0.08489      1.99904     3.08037    0.00548     5.08489
      H    2   -0.00392      0.00000     1.00221    0.00170     1.00392
      H    3   -0.00392      0.00000     1.00221    0.00170     1.00392
      H    4    0.09272      0.00000     0.90396    0.00332     0.90728
      B    5   -0.08489      1.99904     3.08037    0.00548     5.08489
      H    6   -0.00392      0.00000     1.00221    0.00170     1.00392
      H    7   -0.00392      0.00000     1.00221    0.00170     1.00392
      H    8    0.09272      0.00000     0.90396    0.00332     0.90728
 =======================================================================
   * Total *    0.00000      3.99808    11.97749    0.02442    16.00000
BGaH6:
Summary of Natural Population Analysis:

                                       Natural Population
                Natural  -----------------------------------------------
    Atom  No    Charge         Core      Valence    Rydberg      Total
 -----------------------------------------------------------------------
      H    1   -0.30757      0.00000     1.30537    0.00219     1.30757
      H    2   -0.30757      0.00000     1.30537    0.00219     1.30757
      H    3   -0.05723      0.00000     1.05368    0.00355     1.05723
      B    4   -0.47676      1.99918     3.47217    0.00541     5.47676
      H    5    0.01590      0.00000     0.98255    0.00155     0.98410
      H    6    0.01590      0.00000     0.98255    0.00155     0.98410
      H    7   -0.05723      0.00000     1.05368    0.00355     1.05723
     Ga    8    1.17455     28.00000     1.82495    0.00050    29.82545
 =======================================================================
   * Total *    0.00000     29.99918    11.98033    0.02049    42.00000
BInH6:
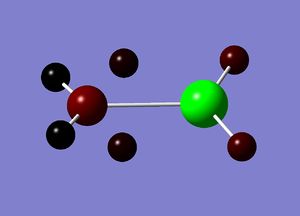
Summary of Natural Population Analysis:

                                       Natural Population
                Natural  -----------------------------------------------
    Atom  No    Charge         Core      Valence    Rydberg      Total
 -----------------------------------------------------------------------
      H    1   -0.36134      0.00000     1.35940    0.00194     1.36134
      H    2   -0.36134      0.00000     1.35940    0.00194     1.36134
      H    3   -0.07022      0.00000     1.06712    0.00310     1.07022
      B    4   -0.54205      1.99923     3.53718    0.00564     5.54205
      H    5    0.01518      0.00000     0.98328    0.00153     0.98482
      H    6    0.01518      0.00000     0.98328    0.00153     0.98482
      H    7   -0.07022      0.00000     1.06712    0.00310     1.07022
     In    8    1.37481     46.00000     1.62480    0.00039    47.62519
 =======================================================================
   * Total *    0.00000     47.99923    11.98160    0.01918    60.00000
BTlH6:
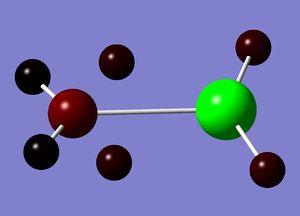
 Summary of Natural Population Analysis:

                                       Natural Population
                Natural  -----------------------------------------------
    Atom  No    Charge         Core      Valence    Rydberg      Total
 -----------------------------------------------------------------------
      H    1   -0.31614      0.00000     1.31397    0.00217     1.31614
      H    2   -0.31614      0.00000     1.31397    0.00217     1.31614
      H    3   -0.06849      0.00000     1.06545    0.00304     1.06849
      B    4   -0.58197      1.99923     3.57652    0.00622     5.58197
      H    5    0.00846      0.00000     0.98984    0.00170     0.99154
      H    6    0.00846      0.00000     0.98984    0.00170     0.99154
      H    7   -0.06849      0.00000     1.06545    0.00304     1.06849
     Tl    8    1.33430     77.96120     1.70216    0.00233    79.66570
 =======================================================================
   * Total *    0.00000     79.96043    12.01720    0.02237    92.00000
Table 11 shows the change in charge on the boron atom and on the bridging hydrogens. Since the group 13 elements are essentially electron deficient it would be expected that boron, as the most electronegative, of the 4 elements, would carry the majority of the charge.
| Natural Charge | |||
| Molecule | Boron | Heavy Atom | Bridging Hydrogens |
| B2H6 | -0.08489 | -0.08489 (B) | 0.09272 |
| BGaH6 | -0.47676 | 1.17455 | -0.05723 |
| BInH6 | -0.54205 | 1.37481 | -0.07022 |
| BTlH6 | -0.58197 | 1.33430 | -0.06849 |
Table 11: A table to show the change in charge distribution on addition of a heavy atom
The results in the table above show that as the heavy atom gets larger, the charge density decreases and the charge on the remaining boron increases. The charge on the bridging protons, while positive in diborane is negative in the the molecules containing the heavy atoms. There is very little literature on these type of measurements, and further study is needed.
The Natural Bond Orbital analysis shows that the molecules area all neutral and if time were to permit would give a good indication of the type of bonding in each of the molecules.
Conclusion
Four molecules, diborane, BGaH6, BInH6 and BTlH6 have been analysed using Gaussian. The energies were minimised and it was found that the thallium containing compound was more stable, whereas the gallium and indium containing compounds were less stable compared to diborane. The M-H (M=Ga, In, Tl) bridging bond lengths were shown to increase. This would be the expected result due to the heavier atoms having larger and more diffuse orbitals which therefore have a poorer overlap with the 1s orbital of the proton, so forming longer and weaker bonds. The frequencies of the four molecules were calculated and the results from this also showed that the bond strength from the heavy atom to the bridging hydrogen decreased, due to a decrease in the stretching frequency. Molecular orbital analysis has been carried out on diborane and BGaH6. It showed that in general there was a good correlation between the orbitals drawn by Gaussian and those predicted by the LCAO method. Gaussian appeared to give a better indication of the change in energy levels on addition of a heavier atom. The Natural Bond Orbital analysis showed that on addition of the heavy atoms the electron density was increasing found on the boron atom.
References
- ↑ http://www.gaussian.com/g_tech/gv5ref/build.htm
- ↑ http://www.huntresearchgroup.org.uk/teaching/teaching_comp_lab_year3/6_freq_analysis.html
- ↑ J. Glaser, G, Johansson, Acta Chemica Scandinavica A, 1982, 36, pp125-135, http://actachemscand.dk/pdf/acta_vol_36a_p0125-0135.pdf
- ↑ G. Hogarth, T. Norman, Inorganica Chimica Acta, 1997 254(1) pp167-171 DOI:10.1016/S0020-1693(96)05133-X
- ↑ F. A. Cotton, D. J. Darensbourg, S. Klein, B. W. S. Kolthammer, Inorg. Chem., 1982, 21 (1), pp 294–29 DOI:10.1021/ic00131a055
- ↑ D. J. Darensbourg, R. L. Kump, Inorg. Chem., 1978, 17 (9), pp 2680–2682 DOI:10.1021/ic50187a062
- ↑ L.T. Redmon, G. D. Purvis III, R. J. Bartlett, J. Am. Chem. Soc., 1979, 101 (11), pp 2856–2862 DOI:10.1021/ja00505a009
- ↑ C. W. Bock, M.Trachtman, C. Murphy, B. Muschert, G. J. Mains, J. Phys. Chem., 1991, 95 (6), pp 2339–2344DOI:10.1021/j100159a041

