Rep:Mod:NMA2703
Introduction
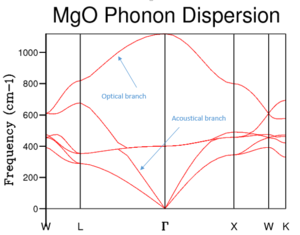
In order to be able to calculate the properties of a crystal solid, its so called lattice dynamics must be considered. These arise from the vibrations of the atoms in the lattice due to their interactions with one another. Considering the crystal as a whole, when the vibrations of all the atoms in question are added up, the result is a wave that has a particular energy and thus a specific frequency as well. This 'total' wave characterising the vibrations in the whole lattice can also be treated as a particle called phonon.
In reciprocal space, a wave vector k characterises each lattice vibration (phonon) and is written as , so it can be seen how k increases as the wavelength decreases (i.e. as the frequency and energy increase). A Dispersion Curve is the plot of frequency as a function of k. The way the energy of a lattice is estimated in Lattice Dynamics (LD) is by calculating the normal modes of vibration of the lattice. There are two types of normal modes: translational (vibration perpendicular to the direction of wave propagation) and longitudinal (vibration in the direction of wave propagation). Furthermore, there are two types of branches that appear in dispersion curves: optical and acoustic. The former are caused by folding of the dispersion curve and only appear when there is more than one atom in the unit cell and for N atoms, there will be 3 acoustical branches and 3N-3 optical branches. [1] The reason folding happens is because if we increase the number of atoms per unit cell, the lattice parameter (in real space) increases, thus in reciprocal space, decreases because , so the part of the band that falls within the region beyond of the larger unit cell is folded into the Brillouin zone, creating the optical branch (figure 1).
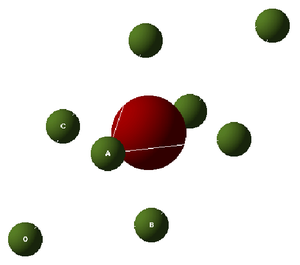
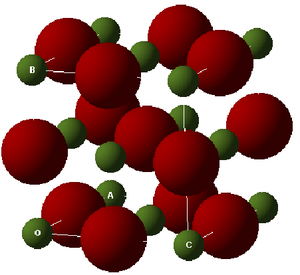
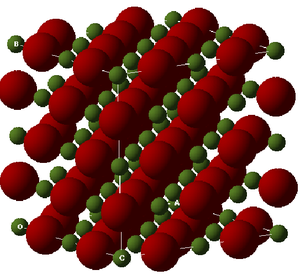
In this experiment the focus was on MgO, thus there will be 6 branches in the dispersion curve. These can be seen in the region between points W and L on the curve, but in other regions there appears to be less branches; this occurs when two branches join because they are degenerate. The system which is focused on in this experiment is MgO, a Face Centered Cubic Lattice (FCC) consisting of and ions. The Primitive Cell (smallest repeat unit) of an FCC contains 2 atoms (figure 2). However, the so-called Conventional Cell (figure 3) allows to visualizse the symmetry of the structure more easily. A Super cell (figure 4) is a group of conventional cells. Each type of cell is shown below. The usefulness of the different types of cells is explained below, after a discussion of the types of simulations that were used.
 |
 |
 |
This experiment was performed using Linux Operating System with DLV as the visualiser system. The simulation methods used were Harmonic Lattice Dynamics, Quasi-Harmonic Lattice Dynamics and Molecular Dynamics. Lattice Dynamics simulations are based on expanding the expression for the lattice energy into a Taylor series; in the harmonic approximation, only the quadratic term is considered for simplicity. The other terms are called anaharmonic. [2] [3] The quasi-harmonic model takes into account the change in vibrational frequency due to thermal expansion, [4] and was used to compute the thermal expansion of MgO over a range of temperature from 0 K to 1000 K. Finally, Molecular Dynamics is based ona combination of Newtonian laws of motion and a model for particle interactions. The model used here is ionic. This allows to predict trajectories of the particles over time, which is then used to calculate quantities such as average energy and average volume, which can then be used to estimate the thermal expansion coefficient within this model. The steps involved in the experiment were to initially optimise the MgO crystal using the harmonic model to find the energy minimum. Using the Harmonic model in this case is not an issue as the harmonic model is a good approximation as long as the region of interest on the potential energy curve is very close to the equilibrium separation. This was followed by using QHA and MD to model thermal expansion and compare between the two simulation methods. The conventional cell was used in QHA but the super cell was necessary in MD calculations as it would not be realistic to assume that atoms will move in exactly the same way in every conventional cell. So a bigger system was needed to model the motion of atoms.
Calculating the internal Energy of an MgO crystal
The lattice energy (i.e. its binding energy) was initially calculated using an ionic model and was found to be -41.0753 eV; this is obtained by adding the repulsive term, which was found to equal 6.7212 eV, and the attractive term equivalent to -47.7965 eV.
This is in accordance with literature, where MgO lattice energy has been reported to be 40.94 eV. [5]
Lattice vibrations - computing the phonons
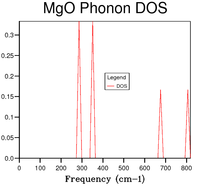
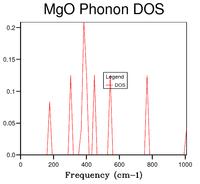
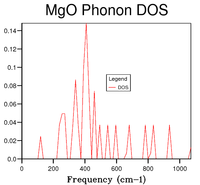
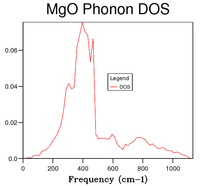
After computing the phonon dispersion curve (Figure 1), the DOS was obtained for a 1x1x1 grid in the first instance (Figure 5, Table 1).
To find the k value to which this specific DOS corresponds to, comparison with Figure 2 shows that the point where states occur at frequencies of ~ , , and is point L (accurate values were obtained from the log file). Furthermore, the points at and are points where two branches converge, hence each point corresponds to a pair of degenerate levels. This is illustrated in the DOS curve by the fact that the peaks at these frequencies are double the height of those at and which are not degenerate (i.e. DOS = 0.333 for the two lower frequencies and 0.167 for the higher ones). Using a 1x1x1 grid means that the DOS computation is performed for 1 k point. Looking at the log file, the coordinates for that point are defined as (0.5, 0.5, 0.5), meaning that the point is in the centre of the conventional cell (i.e. where an ion sits).
As the grid size increases, more k values are sampled, instead of only looking at the frequencies occurring at one k point. In fact, using a 2x2x2 grid means dividing each of the orthogonal axes from the origin into 2 and sampling the k point at the intersection and that at the origin (note that in 3D, the total number of points sampled will not just be 2); a 4x4x4 grid means diving by 4, and so on.
On the one hand, the phonon dispersion curve (Figure 1) shows the frequency of the vibration at every k point; the shape of the curve shows that the lowest frequency occurs at the origin (point Γ), where all the vibrations are in phase, then the energy increases on either side of that point as the amount of out-of-phase vibrations increases. On the other hand, the DOS gives the number of phonon states at a specific frequency. A qualitative shape of the DOS can be obtained by drawing a horizontal line on the dispersion curve (i.e. a line corresponding to one frequency value) and observing how many times it intersects with the dispersion curve; if there are many intersection points, the DOS peak will be high (and vice-versa). Hence, by looking at figure 1, it can be observed that the region where there are a lot of branches is that between and , which is also where the highest DOSs are found, whereas above and below these frequencies, less branches are present in the dispersion curve and so DOSs are lower. From the DOS curves shown in table 1, it can be seen that a grid size of 18x18x18 is a good approximation of the DOS. By computing the DOS at grid sizes 30x30x30 and 32x32x32, it was noted that the shape of the DOS did not change between these two trials; moreover, comparing with 18x18x18, this size is appropriate for capturing the most important features of the DOS but takes less time.
| grid size | 30x30x30 |
|---|---|
| DOS curve |  |
This optimal grid size can also be used for CaO lattice, which also adopts the NaCl structure, involves a and an ion and most importantly has a lattice parameter of 4.800 Å, [6] similar to that of MgO which is 4.211 Å. [7]. As for a Faujasite, the cell parameter in this case varies between 24.669 and 24.996 Å [8], which is a lot larger then in the case of MgO, meaning that the reciprocal space constant a* will be much smaller, so a smaller grid size will be enough for good resolution. The situation is different for a metal, where there are no positively and negatively charged ions, rather positive ions with a sea of electrons. these electrons are attracted to the nuclei, and thus dampen the vibrations of the nuclei which result from repulsive inter-nuclei interaction. Hence, the dispersion curve of this system will be flatter, so a smaller grid will be sufficient.
Computing the free energy: the harmonic approximation
Looking at table 2 and comparing the calculated Helmholtz free energy (A), it can be seen that its value converges to -40.9265 eV. The grid size that allows to obtain a value accurate to 1 meV is 3x3x3, while an accuracy to 0.5 meV is given by 4x4x4 and that to 0.1 eV is given by 8x8x8. It is worth noting that, from the computations performed and shown in table 2, a grid size of 16x16x16 provides a very good approximation (accuracy to 0.001 meV), even though it does not yield the value at which the energy converges. However, the advantage of using 16x16x16 rather than 18x18x18 is that it includes the same k points used in 2x2x2, 4x4x4 and 8x8x8, which makes it more useful when comparing between grid sizes, rather then using larger grids but which don't include the points in the smaller grids. The same optimal grid size can be used for CaO but not for faujasite or Li metal, for the same reasons detailed earlier.
| Grid size | Helmholtz free-energy (eV) |
|---|---|
| 1x1x1 | -40.930301 |
| 2x2x2 | -40.926609 |
| 3x3x3 | -40.926432 |
| 4x4x4 | -40.926450 |
| 8x8x8 | -40.926478 |
| 10x10x10 | -40.926480 |
| 16x16x16 | -40.926482 |
| 18x18x18 | -40.926483 |
| 30x30x30 | -40.926483 |
| 32x32x32 | -40.926483 |
MgO thermal expansion: Quasi-Harmonic simulations
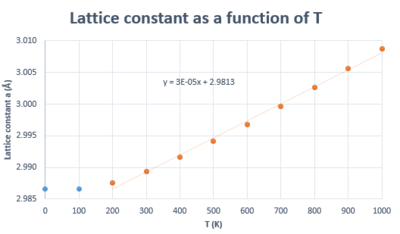
Thermal expansion is the result of the increase in inter-atomic spacing (i.e. cell parameter) arising from larger vibration amplitudes caused by increase in temperature. Using the variation in lattice parameter as a function of temperature (Figure 12), the linear thermal expansion coefficient was calculated within the Quasi-harmonic approximation and was found to be , where is the initial lattice parameter. This value is in accordance with literature (, measured at 273 K). [9] The volume expansion coefficient for a solid is approximately three times its linear expansion coefficient as combining the increase in cell parameter along three perpendicular axes describes an increase in volume. [10]. In fact, using the plot of volume as a function of temperature within the QHA (figure 14), the volumetric thermal expansion coefficient was found to be , which is almost three times the value obtained when the lattice parameter variation was used (note that to obtain the volumetric thermal expansion coefficient, the same equation as for the linear expansion coefficient is used, but the is substitued for ).
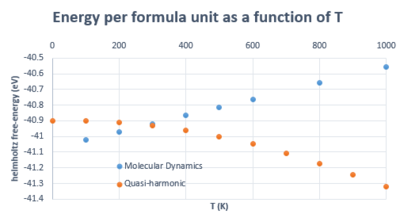
In order to explain why the free energy A decreases as temperature increases (figure 13), we must consider the equation used to calculate A which is [11]:
As the temperature increases, the internal energy increases as well but this is offset by an increase in entropy, making A decrease overall. [2] [3] This increase in entropy can be rationalised by considering the frequency of the vibrations: knowing that in the anharmonic oscillator potential, the oscillator frequency decreases as internuclear separation increases, we can apply the same to the lattice in question: as the volume increases, so does the lattice parameter (i.e. inter-atomic separation) and so the frequency of the vibration will decrease. Harmonicity (implying constant energy level separation) still applies at each volume, but as we move from equilibrium separation to larger separations, the energy spacing between vibrations will be smaller as we go from one harmonic potential to the other. As the energy separation decreases, the number of accessible states increases as well, which leads to an increase in entropy.
 |
 |
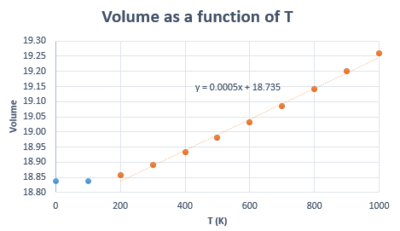 |
In the harmonic model, the equilibrium position about which the atoms vibrate does not change, which means no expansion would occur. Hence, Harmonic Lattice Dynamics can be used to calculate vibrational frequencies only when the atom displacement is small relative to the inter-atomic spacing (i.e. when the vibrations don't affect the volume of the system). [4] Hence, it can be seen how thermal expansion is in fact a result of the anharmonicity of the vibrations, and this is taken into account in the quasi-harmonic approximation (or quasi-harmonic Lattice Dynamics). In the QHA, it is assumed that the harmonic model holds for every volume as the crystal expands (or contracts) but the frequencies are volume-dependent. [10] This thermal expansion is shown by the shapes of the curves in figures 12 and 14, where lattice parameter and volume increase with T. If the temperature reached the melting point of MgO, we would not be able to model the system in the same way as it looses its periodicity when it becomes a liquid. However, this does not affect the region we are interested in as the melting point of MgO has been reported to be 3100 K [12]
As the temperatures increases, the application of the harmonic potential at every volume no longer holds as phonons begin to interact. [13] If the additional resultant anharmonicity is small, it can be solved using perturbation theory to estimate the amount by which the measurements deviate from QHA (the property in question in this case is the thermal expansion coefficient); from a mathematical point of view, Perturbation Theory allows to express the property (thermal expansion) as a series of terms called formal power series, where the first term is the accurate result obtained from the QHA and the other terms account for the deviation from this value, which in this case arises from interaction between phonons. [14] The main limitation of the QHA is the limited number of terms in the perturbation series. [14] Furthermore, if the anharmonicity is large, combining QHA and perturbation theory is not enough and Molecular Dynamics can then be used. [13] [14]
MgO thermal expansion: Molecular Dynamics simulations
 |
 |
The data in figure 15 shows the deviations between MD and QHA in estimating the free-energy A. The trends are very different: as previsouly described, QHA shows a decrease in energy whereas MD shows the opposite, and it is worth noting that MD predicts more negative energies than QHA below 300 K. This can be rationalised by initially considering the fact that MD is not based on a formal power series, as was previously discussed in the introduction; rather, it provides an 'exact' estimation of the properties in question because it is based on classical mechanics; however, this means it neglects effects arising from quantum behaviour such as zero-point energy. [14] [4] This is why it gives a more negative energy value at low T. Moreover, as the temperature increases, so does the free-energy in MD as the kinetic energy of atoms increases in the solid. We have discussed that the decrease in A in the QHA is related to its dependance on the decrease in the frequency of the vibrations , whereas A in MD is not a function of .
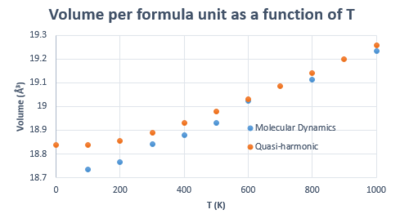
Figure 16, which compares the variation in volume as a function of T, shows that the two methods coincide between 300 and 1000 K. Deviations below that are attributed, once again, to the failure of MD in predicting the zero point energy, meaning it underestimates the volume at low T.
Using the same method as previously, the volumetric thermal expansion coefficient from MD was found to be . This coefficient was calculated earlier in QHA, where it was found that and . It can be seen that volumetric thermal expansion coefficient from MD is in better agreement with 3 times the linear one from QHA, which is .
This is in agreement with literature, [15] where it has been explained that QHA deviates strongly from predicting properties accurately at high temperatures because the anharmonicity of the vibrations changes significantly with temperature. The range we were interested in was between 0 and 1000 K, so it can be assumed that QHA didn't deviate very strongly within this range, which is also supported by its agreement with MD as shown in figure 16. However, it can be concluded that it provides a more accurate estimation of the linear thermal expansion coefficient rather than its volumetric counterpart because there is more phonon coupling (i.e. anharmonicity of vibrations) in the 3D case. Moreover, according to Matsui et al. (1994), if the temperature is increased further, deviations between the two methods will be observed, such that QHA will over-estimate the volume as it fails to take into account the increasing anharmonicity, so MD will be a better approximation in this case.
We have seen that a grid size of 16x16x16 allows to make a very good approximation in QHA, and this grid size implies sampling 16 k points along each orthogonal axis from the origin. Using the argument presented in the introduction, we know that the reciprocal lattice parameter of the lattice used in MD is smaller than that of the conventional cell (in fact it is half). If we assume that the same level of accuracy can be obtained in MD by having half the number of 'points' (which in this case are atoms, not k points) on each axis, then we would need 8 atoms along each axis. However, this would mean we would be considering 2.5 conventional cells along each axis; to make that 3 whole conventional cells, 9 atoms should be used. This implies a 3x3x3 cell involving 27 MgO units.
Conclusion
This experiment has allowed to illustrate the difference between MD and QHA: at low temperatures, MD deviates from accurate values in predicting properties such as volume and helmholtz free energy as it fails to take into account quantum effects, whereas QHA does take these into account. Quasi Harmonic Lattice Dynamics is based on harmonic LD but is modified to account for the phenomenon of thermal expansion, however, QHA fails to account for phonon coupling (or anharmocicity of vibrations) which become increasingly significant at higher temperatures, so in this range MD is more accurate. In the exmaple of MgO, QHA accurately estimated the linear thermal expansion coefficient but MD was more accurate in estimating the volumetric counterpart. Further studies could include comparison between Anharmonic Lattice Dynamics and Molecular Dynamics, as well as the effect of changing pressure on the accuracy of the simulations methods.
References
- ↑ T. Kolodiaynyi, Normal Modes of Crystal Vibrations, 1997, http://www.chemistry.uoguelph.ca/educmat/chm729/phonons/modes.htm [Accessed: February 2016]
- ↑ 2.0 2.1 M. T. Dove, Introduction to Lattice Dynamics, Cambridge University Press, Cambridge, 1993
- ↑ 3.0 3.1 M. Prieto and C. Brime (eds.), Computer Methods in Mineralogy and Geochemistry, Gráficas Cano, Asturias, 2008. Available from: http://www.ehu.eus/sem/seminario_pdf/SEM_SEM_4_7-37.pdf [Accessed February 2016]
- ↑ 4.0 4.1 4.2 J. E. Turney, E. S. Landry, A. J. H. McGaughey and C. H. Amon, Phys. Rev. B, 2009, 79, 064301 DOI:10.1103/PhysRevB.79.064301
- ↑ E. V. Bogatyreva and A. G. Ermilov, Inorg. Mater., 2011, 44, 197-202 DOI:" 10.1134/S0020168508020210"
- ↑ O. Madelung, U. Rössler, M. Schulz (ed.), Calcium oxide (CaO) crystal structure, lattice parameters, thermal expansion, Springer, Germany, 1999 DOI:10.1007/10681719_224
- ↑ O. Madelung, U. Rössler, M. Schulz (ed.), Magnesium oxide (MgO) crystal structure, lattice parameters, thermal expansion , Springer, Germany, 1999 DOI:10.1007/10681719_206
- ↑ E. Dempsey, G. H. Kuhl, D. H. Olson, J. Phys. Chem., 1969, 73, 387 DOI:10.1021/j100722a020
- ↑ Crystran, http://www.crystran.co.uk/optical-materials/magnesium-oxide-mgo, [Accessed February 2016]
- ↑ 10.0 10.1 R.S. Krishnan, R. Srinivasan, S. Devanarayanan, Thermal expansion of Crystals, Pergamon Press, Oxford, 1979
- ↑ N. Harrison, presented as a lecture in the Department of Chemistry at Imperial College, London, August, 2006. Available from: http://www.ch.ic.ac.uk/harrison/Teaching/L4_Vibrations.pdf [ Accessed February 2016]
- ↑ A. A. Yar, M. Montazerian, H. Abdizadeh and H. R. Baharvandi, J. Alloys Compd., 2009, 484, 400-404 DOI:10.1016/j.jallcom.2009.04.117
- ↑ 13.0 13.1 Q. Zhu, Crystal Structure Prediction and its Application in Earth and Materials Sciences, Stony Brook University, 2013. Available from: http://uspex.stonybrook.edu/qzhu-thesis/sect0027.html [Accessed February 2016]
- ↑ 14.0 14.1 14.2 14.3 G. Cardini, P. Procacci and R. Righini, Chem. Phys., 1987, 117, 355-366 DOI:10.1016/0301-0104(87)80188-X
- ↑ M. Matsui, G. D. Price and A. Patel, Geophys. Res. Lett., 1994, 21, 1659-1662 DOI:10.1029/94GL01370

