Rep:Mod:NB1C
Third Year Synthesis and Modelling Lab. Startup for Computational experiment 1C
Part 1
This section uses molecular mechanics to analyse the outcome of reactions. Molecular mechanics is used to predict structures of molecules and calculate thermodynamic properties. It optimises geometries by adjusting bond angles and bond lengths to obtain a conformation of minimum energy, as ultimately the lowest energy conformation is favoured. The energy as a result of geometries and conformations is referred to as the steric energy. This means the optimised geometry is extremely sensitive to the geometry of the input molecule as this method finds a local minimum as opposed to a global minimum. Thus the slight movement of atoms on input is likely to have an effect of the energy of the optimised output.
The Hydrogenation of the Cyclopentadiene Dimer

The Diels Alder reaction of the dimerisation of cyclopentadiene selectively forms the endo dimer 2 rather than the exo dimer 1. Calculating the relative stabilities of each dimer using molecular mechanics (Avogadro) gives an indication of which product is less strained/hindered from a thermodynamic perspective. Therefore the product with the lowest energy would be the thermodynamic product. To proceed, the geometries of 1 and 2 were optimised to obtain the relative energies.
The dimerisation of cyclopentadiene results in two dimers as the reactants can approach in different orientations as shown by the following diagram. On comparison of the product energies, 2 has a higher energy than 1, but as we know that 2 is specifically formed this suggests the reaction is under kinetic control as opposed to thermodynamic control. The thermodynamic product would be the product with lowest energy, the kinetic product would arise as a result of a lower energy transition state and could, therefore be higher in energy than the thermodynamic product. When a potential energy surface of the reaction was plotted using a B3LYP/6-31G* basis set, the lowest energy points were the endo transition state at 21.0 kcal/mol and the exo transition state which was 2.9 kcal/mol higher in energy than the endo.[1] Therefore the conclusion that this reaction is under kinetic control is concordant with the literature result and provides an explanation as to why when the endo dimer is heated there is some formation of the exo dimer.
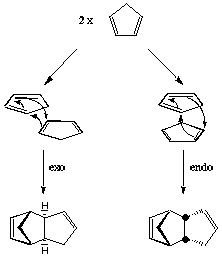
[2]
The next part discusses the hydrogenation of the endo dimer 2 and whether the reaction proceeds via kinetic or thermodynamic control by analysing the relative stabilities of 3 and 4.
On hydrogenation of either alkene bond, interactions of the introduced hydrogens change the relative stabilities of each product. Therefore it is these interactions that should be analysed to rationalise the differences in energy between the two products. The energy contributions to be discussed are the 'total angle bending energy' and the 'total van der Waals energy' as the remaining contributions differ very slightly. The 'total angle bending energy' is the energy required to bend a bond from its equilibrium angle, thus the higher contribution for 3 indicates the bonds are increasingly strained as they are further from equilibrium. The 'total vdw energy' is a referred to as a non-bonded interaction and often plays a significant role in the adopted conformation of the molecule. The vdW energy is a function of distance between two atoms - at a greater distance attractive forces are present and at smaller distances repulsive forces are significant. The lowest energy interaction is determined by the sum of the van der Waal's radii of the atoms involved, any distance smaller than the sum becomes repulsive. Thus the greater 'total vdw energy' of 3 shows the geometry of conformation is such that the hydrogenation at the particular olefinic bond results in repulsive forces between the introduced hydrogens and other surrounding atoms. The products differ in energy by 9.87 kcal/mol and with 4 being lower in energy this indicates it is less strained/hindered.
Atropisomerism is the phenomenon that occurs as a result of restricted rotation about one or more single bonds, resulting in energy barriers high enough to isolate the conformers. The isolation of these isomers is possible due to the steric barriers. The objective of this section is to explore which of the following two atropisomers are more stable and discuss the results. [3]
To calculate which atropisomer is more stable both were computed to obtain their total energies. Acknowledging the presence of the 6 member ring, it is apparent that there are different conformations for the ring which will affect the relative energy of each isomer. On comparison of the relative energies of each isomer, the 6 member rings were in the same conformation i.e. both chair up, both chair down, both twist-boat up, both twist-boat down. The larger ring is not of concern and does not need to be adjusted manually as typically in the presence of a smaller ring with a set conformation, the larger ring adapts its geometry to favor the smaller ring best.[4]
| Carbonyl up chair down | Carbonyl up chair up | Carbonyl up twist-boat down | Carbonyl up twist-boat up | |||||||||
| Total energy (kcal/mol) | 76.203 | 82.660 | 66.806 | 89.246 | ||||||||
| Mol image |
| Carbonyl down chair down | Carbonyl down chair up | Carbonyl down twist-boat down | Carbonyl down twist-boat up | |||||||||
| Total energy (kcal/mol) | 74.772 | 60.552 | 66.288 | 66.319 | ||||||||
| Mol image |
Chair and twist-boat conformers facing up and down relative to the carbonyl were computed for each atropisomer and on comparison the downward facing carbonyl configurations were lower in energy. With regards to the carbonyl facing downwards, the chair conformations were lower than the twist-boat conformations as expected with reference to the below diagram. The chair conformation adopted does not experience any torsional strain making it the most stable. The twist-boat conformation involves unfavourable interactions such as 1,3-diaxial repulsion which results in its higher energy. Overall the carbonyl down chair up conformation was the lowest in energy.
The olefin strain energy is the difference between the strain energy of the olefin and its corresponding alkane (saturated hydrocarbon), where the 'olefinic strain' is calculated using heats of hydrogenation. Usually the the olefin is more strained than the alkane but in the case where the energy of the corresponding alkane is higher than that of the olefin, these structures are referred to as hyperstable olefins. These hyperstable olefins are thermodynamically stabilised and is expected to be unreactive. The reasons behind their reduced reactivity (i.e. why the alkene reacts slowly) is not chemically known and cannot be put down to the usual factors of steric hindrance or p-bond energy.[4] The relative difference in energy for the olefin and corresponding alkane of the carbonyl down chair up structure (lowest energy conformation) has been calculated below.
| Olefin energy | Alkane energy | Energy difference |
| 60.552 | 71.440 | 10.888 |
Spectroscopic Simulation using Quantum Mechanics
The DOI for the chair down conformation is DOI:10042/195148 . The DOI for the chair up conformation is DOI:10042/195149 . The DOI for the twist-boat down conformation is DOI:10042/195147 . The DOI for the twist-boat up conformation is DOI:10042/195146 .
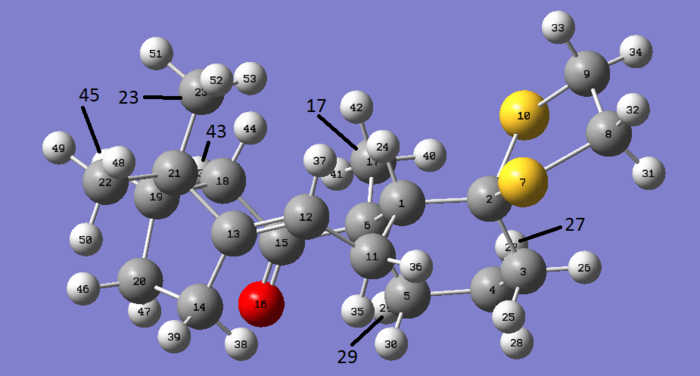
Keeping in mind what was learnt from the previous section the molecule chosen for the purposes of analysis is molecule 18 with the carbonyl down. From the previous section the lowest energy configurations were the carbonyl down conformations in comparison to the carbonyl up conformations. The lowest energy conformation from these when considering the 6 member ring was the chair up, thus we'd expect this to be the lowest in energy for the taxol intermediate too. HPC calculations have been run for the four carbonyl down conformations - chair up, chair down, twist-boat up and twist-boat down to enable the comparison of the isomeric configurations of the molecule.
The script indicates we should append the solvation model with the basis set B3LYP/6-31G(d,p) and the solvent as chloroform, but on reading the literature and exploring the use of Gaussian to load the NMR the more suitable basis set is B3LYP/6-311G+(2d,p) and the solvent used in literature is benzene. For this reason HPC calculations were adjusted to include these parameters to prevent a constant error in chemical shift values. Unfortunately the calculations attempted with this new basis set were very time consuming and did not always work. The old basis set of B3LYP/6-31G(d,p) was used but the solvent was amended to be benzene.
On examination of the .log files, the free energies ΔG were obtained by identifying the label 'Sum of electronic and Thermal free energies'. The results are below and unlike previously where the chair up conformation was lowest in energy, the chair down confirmation is lower in energy. We can hypothesize this is to do with the added thiol ring having slightly more unfavourable interactions when the cyclohexane ring was chair down in comparison to when it was chair up.
| Conformation of cyclohexane ring | Energy (au) |
| Chair down | -1651.455839 |
| Chair up | -1651.461137 |
| Twist-boat down | -1651.460604 |
| Twist-boat up | -1651.458875 |
The NMR of the carbonyl down chair down conformation has been analysed below as a result of this being the lowest energy configuration.
13C NMR
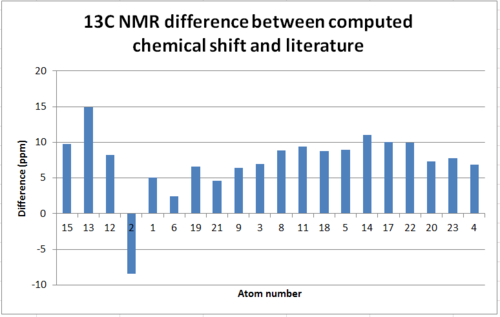
For 13C NMR each carbon is in its own environment and thus no 'averaged chemical shift' is needed and the literature values assign quite well.
| Atom | Chemical Shift(ppm) | Literature chemical shift(ppm)[1] | Difference(ppm) |
| 15 | 201.68 | 211.49 | 9.81 |
| 13 | 133.76 | 148.72 | 14.96 |
| 12 | 112.65 | 120.9 | 8.25 |
| 2 | 83.05 | 74.61 | -8.44 |
| 1 | 55.48 | 60.53 | 5.05 |
| 6 | 48.85 | 51.3 | 2.45 |
| 19 | 44.35 | 50.94 | 6.59 |
| 21 | 40.89 | 45.53 | 4.64 |
| 9 | 36.83 | 43.28 | 6.45 |
| 3 | 33.90 | 40.82 | 6.92 |
| 8 | 29.90 | 38.73 | 8.83 |
| 11 | 27.35 | 36.78 | 9.43 |
| 18 | 26.66 | 35.47 | 8.81 |
| 5 | 21.90 | 30.84 | 8.94 |
| 14 | 19.00 | 30.00 | 11.00 |
| 17 | 15.55 | 25.56 | 10.01 |
| 22 | 15.39 | 25.35 | 9.96 |
| 20 | 14.85 | 22.21 | 7.36 |
| 23 | 13.58 | 21.39 | 7.81 |
| 4 | 13.00 | 19.83 | 6.83 |
The carbon NMR was not particularly difficult to assign but the chemical shift values obtained differed from the literature values by an average of 7.283ppm. As chemical shifts for 13C NMR are a lot larger than 1H NMR this difference is in fact relatively small in this context. It should be noted that carbon bonded to heavier atoms, in this case sulphur, cause upfield shifts and require calculation corrections for spin orbit coupling to be considered.[17] If atom 2 is considered it can be seen the difference between literature and the computed result is the only negative difference in the list. This implies the calculations do not account for the effect mentioned and if it were to be implemented the difference would be more on trend.
1H NMR
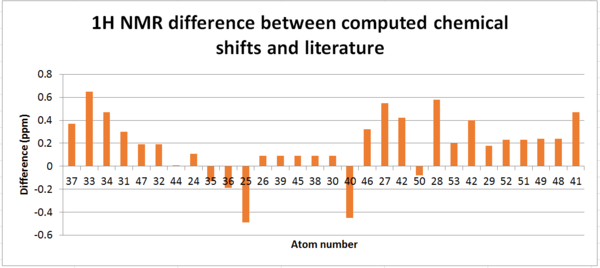
For the H NMR the assignment was done differently. From the HPC NMR assingment, the chemical shift of each proton was taken - this corresponds to the 'Chemical Shift' column in the following table. As can be seen when looking at the labelled image and the chemical shifts of the 1H spectra, protons we would typically expect to have the same chemical shifts, i.e. protons on a methylene group, have considerably different chemical shifts. The 'Averaged Chemical Shift' was then determined; in light of the differing chemical shifts I did not feel it was appropriate to assign environments for each methylene as axial and equatorial hydrogens may have very different shifts, thus the only environments which resulted in an averaging of the chemical shift of the proton signals were the methyl hydrogens as these have free rotation. Although plausible with this method of calculation, realistically protons in different environments are not likely to have the same chemical shift. The 'Literature Chemical Shifts' were assigned by arranging the atoms in order of descending chemical shift and using the literature multiplicities to match the corresponding literature chemical shift to each proton. This means the comparison is vague - the the literature chemical shift assigned does not necessarily match the calculated chemical shift. In order to be able to calculate a difference between the obtained values and literature values an 'Averaged Literature Chemical Shift' was determined for each multiplet as some were stated as a range.
| Atom | Chemical Shift(ppm) | Averaged Chemical Shift(ppm) | Literature Chemical Shift(ppm)[1] | Average Literature Chemical Shift(ppm) | Difference(ppm) |
| 37 | 5.58 | 5.58 | 5.21 | 5.21 | 0.37 |
| 33 | 3.50 | 3.50 | 3 - 2.7 | 2.85 | 0.65 |
| 34 | 3.32 | 3.32 | 3 - 2.7 | 2.85 | 0.47 |
| 31 | 3.15 | 3.15 | 3 - 2.7 | 2.85 | 0.30 |
| 47 | 3.04 | 3.04 | 3 - 2.7 | 2.85 | 0.19 |
| 32 | 3.04 | 3.04 | 3 - 2.7 | 2.85 | 0.19 |
| 44 | 2.86 | 2.86 | 3 - 2.7 | 2.85 | 0.01 |
| 24 | 2.64 | 2.64 | 2.7 - 2.35 | 2.53 | 0.11 |
| 35 | 2.40 | 2.40 | 2.7 - 2.35 | 2.53 | -0.13 |
| 36 | 2.34 | 2.34 | 2.7 - 2.35 | 2.53 | -0.19 |
| 25 | 2.04 | 2.04 | 2.7 - 2.35 | 2.53 | -0.49 |
| 26 | 2.04 | 2.04 | 2.2 - 1.7 | 1.95 | 0.09 |
| 39 | 2.04 | 2.04 | 2.2 - 1.7 | 1.95 | 0.09 |
| 45 | 2.04 | 2.04 | 2.2 - 1.7 | 1.95 | 0.09 |
| 38 | 2.04 | 2.04 | 2.2 - 1.7 | 1.95 | 0.09 |
| 30 | 2.04 | 2.04 | 2.2 - 1.7 | 1.95 | 0.09 |
| 40 | 2.04 | 1.50 | 2.2 - 1.7 | 1.95 | -0.45 |
| 46 | 1.90 | 1.90 | 1.58 | 1.58 | 0.32 |
| 27 | 1.90 | 1.90 | 1.5 - 1.2 | 1.35 | 0.55 |
| 42 | 1.77 | 1.77 | 1.5 - 1.2 | 1.35 | 0.42 |
| 50 | 1.68 | 1.27 | 1.5 - 1.2 | 1.35 | -0.08 |
| 28 | 1.68 | 1.68 | 1.10 | 1.10 | 0.58 |
| 53 | 1.57 | 1.30 | 1.10 | 1.10 | 0.20 |
| 42 | 1.41 | 1.50 | 1.10 | 1.10 | 0.40 |
| 29 | 1.25 | 1.25 | 1.07 | 1.07 | 0.18 |
| 52 | 1.25 | 1.30 | 1.07 | 1.07 | 0.23 |
| 51 | 1.07 | 1.30 | 1.07 | 1.07 | 0.23 |
| 49 | 1.07 | 1.27 | 1.03 | 1.03 | 0.24 |
| 48 | 1.07 | 1.27 | 1.03 | 1.03 | 0.24 |
| 41 | 0.70 | 1.50 | 1.03 | 1.03 | 0.47 |
The mean difference in between the calculated chemical shifts and the literature values is 0.182ppm but there are many sources of error to explain this. Firstly the literature values used are stated in ranges, forcing an average value for each multiplet to be calculated and used in finding the difference – if specific shifts were found this may have reduced the average chemical shift discrepancy. Secondly, with the use of molecular mechanics, the technique is very sensitive to the positioning of atoms and through optimisation only finds the local minima not the global minimum thus despite creating four conformers in the attempt to find the lowest energy conformation, the conformation obtained may not be the lowest energy. Thus the NMR chemical shift values computed should have been an average of many conformations to minimise the difference in comparison to literature but the practicality of doing this using this method was low. Additionally, ideally the basis set used should have been B3LYP/6-311G+(2d,p) but as the calculations failed other data had to be retrieved.
Analysis of the properties of the synthesised alkene epoxides
The two catalytic systems
The Shi Fructose-derived chiral catalyst
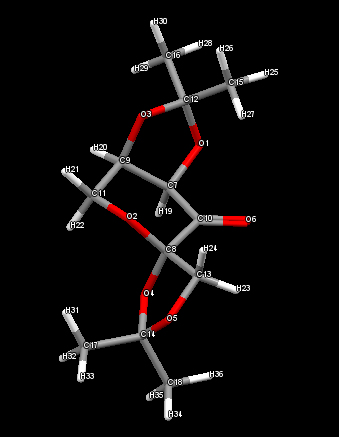
An anomeric centre is a result of the anomeric effect where the lone pairs on oxygen adopt an axial position. In the Shi catalyst this fixes the conformation of the 5 member ring containing the anomeric centre. The anomeric centre can be identified by considering the O-C-O bond lengths – as the oxygen’s lone pair overlaps with the antibonding orbital of the C-O bond the bond would weaken and thus lengthen.
Looking at the diagram it would be expected the O2 - C8 and C8 - O4 bonds involved in the anomeric centre should be longer than O4 - C14 and O5 - C14. Although for the structure obtained from PubChem this does not appear to be the case. This may be a result of not optimising the molecule as it was assumed this was the case when taking the structure from PubChem.
| Atom 1 | Atom 2 | Bond length (Å) |
| O1 | C7 | 1.4220 |
| O1 | C12 | 1.4369 |
| O2 | C8 | 1.4242 |
| O2 | C11 | 1.4277 |
| O3 | C9 | 1.4321 |
| O3 | C12 | 1.4254 |
| O4 | C8 | 1.4266 |
| O4 | C14 | 1.4337 |
| O5 | C13 | 1.4300 |
| O5 | C14 | 1.4329 |
In a reaction on approaching the catalyst the cis-alkene would experience steric hindrance due to the fixed conformation of the 5 member ring, whereas a trans-alkene would not. For this reason the Shi catalyst is enantioselective. [5]
The Jacobsen salen-derived chiral catalyst
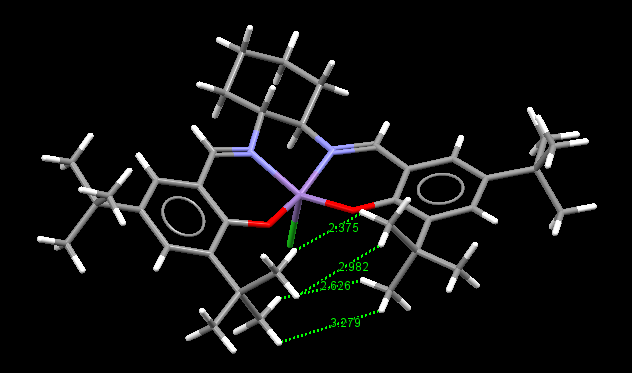
The epoxidation of unfunctionalised alkenes was made possible by the work of Jacobsen and his colleagues by the use of manganese(III) salen -type chiral complexes as catalysts. Side-on the complex appears planar, with an axial Mn-Cl bond and ortho t-butyl groups. Therefore, mechanistically, the structure of the catalyst is such that only one direction of approach is favoured being that of a side-on approach opposite to the face of the t-butyl groups. The close proximity of the t-butyl groups is the cause of this and this idea is used to explain the enantioselectivity. Without the t-butyl groups the enantiomeric excess of the resulting products is considerably lower.[6]
The van der Waals radii of hydrogen is 1.20Å, thus the length at which optimal attractive interactions occur between two hydrogens is 2.40Å, at distances shorter than this interactions become increasingly repulsive.[7] It can be inferred that the distances of 3.279Å and 2.982Å do not play a role in attractive or repulsive interactions and therefore can be ignored. However the interaction between hydrogens at a distance of 2.375Å is likely to be strongly attractive, with the distance of 2.626Å likely to be weakly attractive. Therefore we can conclude the overall interaction between the t-butyl groups is attractive by analysing the picture above, although it should be noted not all distances between the groups have been labelled so these need to be considered in order to evaluate the repulsive interactions too. To confirm the attraction between the hydrogens a NCI analysis could be carried out where we'd expect to see a region of green between the t-butyl groups indicating a weak attraction. This attraction is reason for the close proximity of the t-butyl groups, explaining why the alkene approaches the Jacobsen catalyst from the opposite face.
The calculated NMR properties of the chosen epoxides
Styrene oxide
The DOI used for computing the NMR is DOI:10042/195144 .
13C NMR
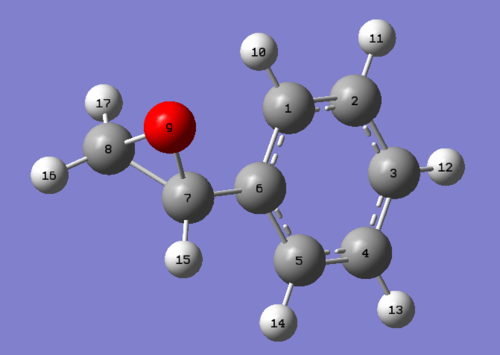
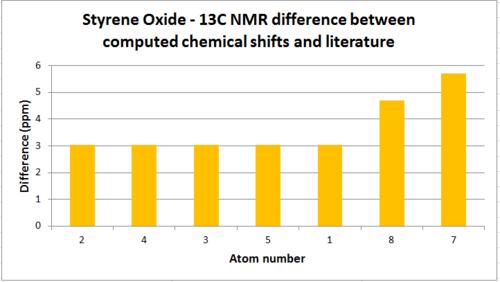
The NMR analysis of Styrene Oxide is provided below. On assigning the molecule, the chemical shifts of the aromatic ring were not as necessarily expected - where it would be expected the para positions to have a different chemical shift to the ortho positions, the HPC simulated NMR does not follow this pattern, instead the aromatic carbons show various shifts randomly assigned. For this reason the literature shifts were difficult to match with a logical explanation and thus was rewritten as a range for the aromatic ring as this seemed more appropriate. With the 'Literature value' being a range an averaged value was calculated to aid the calculation of a 'difference'.
Despite carbon 6 having a signal in the calculated NMR, as there is not bonded to a proton the shift would not usually appear as indicated in the literature values obtained.
| Atom | Chemical Shift(ppm) | Averaged Chemical Shift - environments(ppm) | Literature value(ppm)[8] | Averaged Literature value(ppm) | Difference(ppm) |
| 6 | 145.625 | - | - | - | - |
| 2 | 133.199 | 131.300 | 128.4 - 128.1 | 128.25 | 3.050 |
| 4 | 132.435 | 131.300 | 128.4 - 128.1 | 128.25 | 3.050 |
| 3 | 132.235 | 131.300 | 128.4 - 128.1 | 128.25 | 3.050 |
| 5 | 131.922 | 131.300 | 128.4 - 128.1 | 128.25 | 3.050 |
| 1 | 126.711 | 131.300 | 128.4 - 128.1 | 128.25 | 3.050 |
| 8 | 56.890 | 56.890 | 52.2 | 52.2 | 4.69 |
| 7 | 56.711 | 56.711 | 51 | 51 | 5.711 |
1H NMR
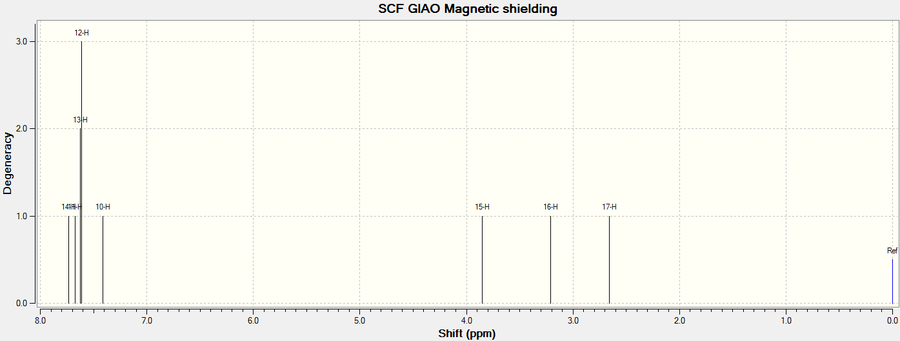
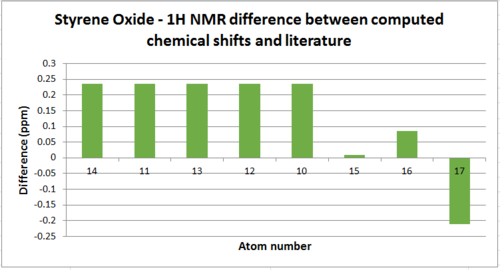
As explained previously for the 13C NMR, the aromatic protons were assigned a corresponding range for the literature due to the reasons outlined.
| Atom | Chemical Shift(ppm) | Averaged Chemical Shift - environments(ppm) | Literature value(ppm) | Averaged Literature value(ppm)[8] | Difference(ppm) |
| 14 | 7.733 | 7.593 | 7.357-7.255 | 7.357 | 0.236 |
| 11, 13, 12 | 7.636 | 7.593 | 7.357-7.255 | 7.357 | 0.236 |
| 10 | 132.435 | 7.411 | 7.357-7.255 | 7.357 | 0.236 |
| 15 | 132.235 | 3.850 | 3.841 | 3.841 | 0.009 |
| 16 | 131.922 | 3.207 | 3.122 | 3.122 | 0.085 |
| 17 | 126.711 | 2.660 | 2.871 | 2.871 | -0.211 |
Trans β-methylstyrene oxide
The DOI used for computing the NMR is DOI:10042/195145 .
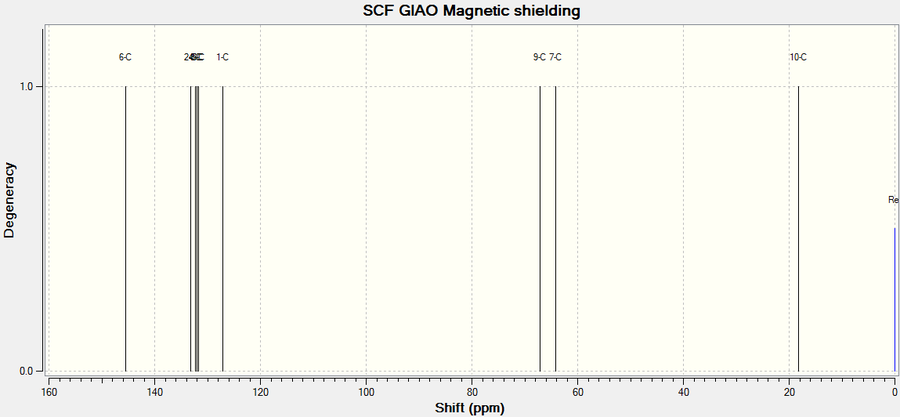
13C NMR
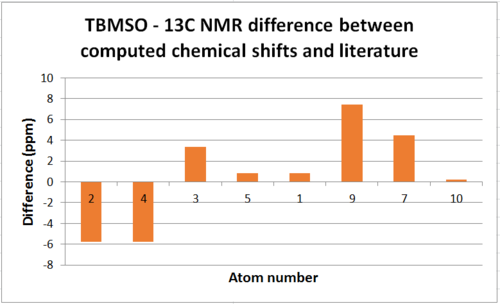
| Atom | Chemical Shift(ppm) | Averaged Chemical Shift - environments(ppm) | Literature value(ppm)[9] | Averaged Literature value(ppm) | Difference(ppm) |
| 6 | 145.512 | - | - | - | - |
| 2 | 133.246 | 132.144 | 137.9 | 137.9 | -5.7565 |
| 4 | 132.304 | 132.144 | 137.9 | 137.9 | -5.7565 |
| 3 | 131.983 | 131.983 | 128.6 - 125.7 | 128.6 | 3.383 |
| 5 | 131.76 | 129.412 | 128.6 - 125.7 | 128.6 | 0.812 |
| 1 | 127.064 | 129.412 | 128.6 - 125.7 | 128.6 | 0.812 |
| 9 | 67.136 | 67.136 | 59.7 - 59.2 | 59.7 | 7.436 |
| 7 | 64.154 | 64.154 | 59.7 - 59.2 | 59.7 | 4.454 |
| 10 | 18.291 | 18.291 | 18.1 | 18.1 | 0.191 |
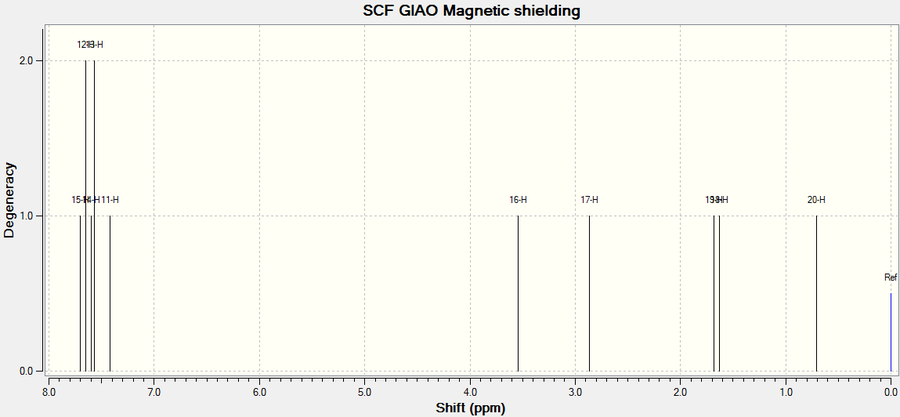
1H NMR
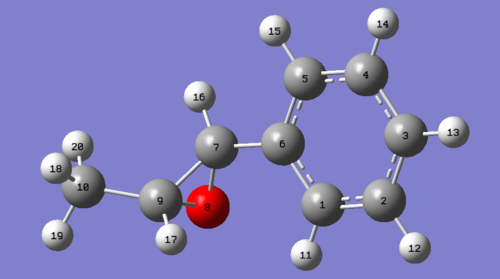
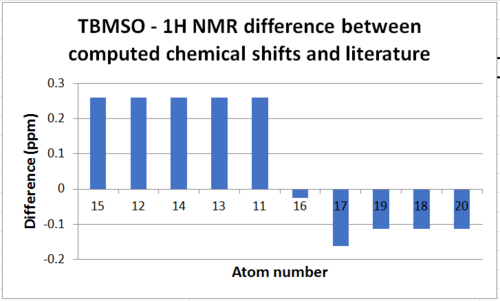
The aromatic protons were given a range for the literature value for the reasons explained previously. The protons labelled 18/19/20 would be expected to have the same shift usually as, as a methyl group they are in one environment - this is shown in literature. Strangely from the computed NMR, 18 and 19 have similar shifts but 20 is significantly different. These trends that should be seen but are not provide reason to question the validity of the computed NMR.
| Atom | Chemical Shift(ppm) | Averaged Chemical Shift - environments(ppm) | Literature value(ppm)[9] | Averaged Literature value(ppm) | Difference(ppm) |
| 15, 12 | 7.677 | 7.56 | 7.20-7.40 | 7.3 | 0.26 |
| 14, 13 | 7.582 | 7.56 | 7.20-7.40 | 7.3 | 0.26 |
| 11 | 7.421 | 7.56 | 7.20-7.40 | 7.3 | 0.26 |
| 16 | 3.544 | 3.544 | 3.57 | 3.57 | -0.026 |
| 17 | 2.869 | 2.869 | 3.03 | 3.03 | -0.161 |
| 19 | 1.68 | 1.338 | 1.45 | 1.45 | -0.112 |
| 18 | 1.628 | 1.338 | 1.45 | 1.45 | -0.112 |
| 20 | 0.706 | 1.338 | 1.45 | 1.45 | -0.112 |
Assigning the absolute configuration of the product
The calculated chiroptical properties of the product
The chiroptical properties of the original enantiomer product were computed. The enantiomer was then created to obtain its chiroptical properties to aid understanding and for comparison.
Optical Rotation Calculation Results and Vibrational Circular Dichroism Spectra
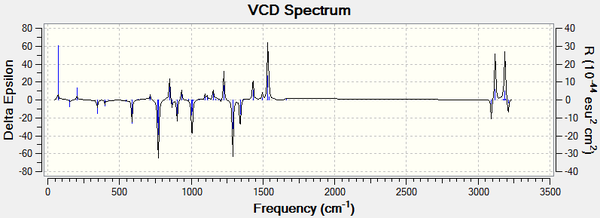
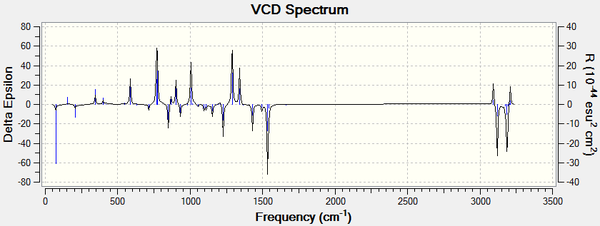
Enantiomers have identical physical properties but can be differentiated by their optical rotation. The optical rotations for each enantiomer are the same in value but opposite in sign as expected. It should be noted that the (+) or (-) are not assigned to absolute configurations of R and S. For the enantiomers below, ChemBio3D was used to designate S and R accordingly.
VCD is a spectroscopic technique used to provide 3D structural information and thus allowing the absolute configuration of molecules to be identified. It is defined as the difference in absorption of a molecule for left and right polarised infrared light. For enantiomers you would expect the spectra to be a reflection as these absorption's would be opposite for each enantiomer, this can be seen from the spectra below. VCD spectra are very useful but rarely done and thus literature spectra could not be found for comparison.[10]
Styrene Oxide
DOI for optical rotation of the R enantiomer is DOI:10042/195135 . DOI for the optical rotation of the S enantiomer is DOI:10042/195136 . DOI for the VCD spectra of the R enantiomer is DOI:10042/195139 . DOI for the VCD spectra of the S enantiomer is DOI:10042/195140 .
| Wavelength | R | S | Literature[15] |
| 589nm | -219.44 | 219.44 | -33 |
| 365nm | -833.53 | 833.53 | - |
TBMSO
DOI for optical rotation of the R,R enantiomer is DOI:10042/195137 . DOI for the optical rotation of the S,S enantiomer is DOI:10042/195138 . DOI for the VCD spectra of the R,R enantiomer is DOI:10042/195142 . DOI for the VCD spectra of the S,S enantiomer is DOI:10042/195141 .
| Wavelength | R, R | S, S | Literature[14] |
| 589nm | 29.62 | -29.62 | 45.3, -48.5 |
| 365nm | -27.07 | 27.07 | - |
On comparison of the literature optical rotation values with the computed values it is clear they are not in agreement. It needs to be considered that the optical rotation is very sensitive to temperature and literature should not be presumed correct. Although in this case as the values differ greatly it seems the method used is not very reliable.
Transition States analysis
From each file the 'Sum of electronic and Thermal free energies' was read and put into the following tables. From these the minimum free energy was determined for each enantiomeric transition state in order to compute the enantiomeric excess in the follwing steps.
Shi Catalyst
| Transition state | R, R | S, S |
| 1 | -1343.02297 | -1343.017942 |
| 2 | -1343.019233 | -1343.015603 |
| 3 | -1343.029272 | -1343.023766 |
| 4 | -1343.032443 | -1343.024742 |
| Transition state | R | S |
| 1 | -1303.730703 | -1303.733828 |
| 2 | -1303.730238 | -1303.724178 |
| 3 | -1303.736813 | -1303.727673 |
| 4 | -1303.738044 | -1303.738503 |
Jacobsen's Catalyst
| Transition state | S, S | R, R |
| 1 | -3383.262481 | -3383.253816 |
| 2 | -3383.257847 | -3383.254344 |
| Transition state | S | R |
| 1 | -3343.969197 | -3343.960889 |
| 2 | -3343.963191 | -3343.962162 |
Enantiomeric excess calculations[11]
The starting materials resulting in each enantiomer are the same and thus their free energy is the same - this can be calculated by finding the difference.
Using this, the enantiomeric excess can then be calculated using
| R, R transition state energy (au) | S, S transition state energy (au) | Free energy difference ΔG‡ (kJ/mol) | e.e(%) | Literature e.e.(%) |
| -1343.019233 | -1343.015603 | -9.530565 | 95.83 | 88[12] |
| R transition state energy (au) | S transition state energy (au) | Free energy difference ΔG‡ (kJ/mol) | e.e(%) | Literature e.e. (%) |
| -1303.730238 | -1303.724178 | -15.91053 | 99.68 | 13.6[12] |
| S, S transition state energy (au) | R, R transition state energy (au) | Free energy difference ΔG‡ (kJ/mol) | e.e(%) | Literature e.e. (%) |
| -3383.257847 | -3383.253816 | -10.5833905 | 97.25 | 48[13] |
| S transition state energy (au) | R transition state energy (au) | Free energy difference ΔG‡ (kJ/mol) | e.e(%) | Literature e.e. (%) |
| -3343.963191 | -3343.960889 | -6.043901 | 83.97 | 48[13] |
In determining the e.e. it would be expected the transition state of the enantiomer with the lowest energy would be the enantiomer produced in excess. Thus the enantiomeric excess given is with respect to the lowest energy transition state between the two enantiomers; Shi catalyst Styrene oxide – S enantiomer TBMSO – S, S enantiomer Jacobsen catalyst Styrene oxide – R enantiomer TBMSO – R, R enantiomer
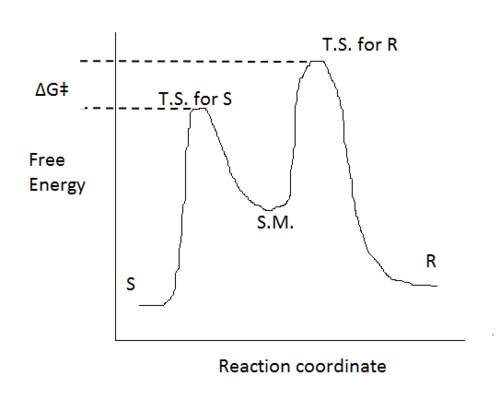
i.e. an example reaction co-ordinate would be as follows - in this example the S enantiomer would be in excess.
From literature, the primary drawback to quantum mechanical calculations in comparison to computational force field methods is the calculation time, besides this the method tends to be widely accurate for modelling of enantiomers.[11] On analysis of the results obtained for this section, unfortunately they do not follow the expected trend.
As discussed previously, the Jacobsen catalyst is enantioselective towards cis and unfunctionalised alkenes whereas the Shi catalyst is partial towards trans alkenes. Thus we would expect a large e.e. for TBMSO with the Shi catalyst and a small e.e. for TBMSO with the Jacobsen catalyst. From the computed results obtained, this is not the case and both e.e. results are very large i.e. they are in agreement with the Shi catalyst but not for Jacobsen. On comparison with literature the values tend to differ greatly suggesting the quantum mechanical methods of e.e. determination are not greatly accurate.
Additionally on comparison of the relative ΔG‡ values calculated for TBMSO and Styrene with the Shi catalyst, TBMSO has a smaller value which does not support explanation. As e.e. is calculated using ΔG‡ values the magnitude of ΔG‡ for TBMSO should be larger than Styrene as the Shi catalyst favours trans-alkenes. For the Jacobsen catalyst we would expect ΔG‡ to be larger for Styrene as it is less selective towards trans-alkenes but again the magnitude of ΔG‡ is larger for TBMSO than Styrene. This again indicates the computed data is not entirely reliable, the reasoning is discussed below.
It is important to note that as the e.e. is calculated using the difference of free energies, the free energy calculated for each molecule originally plays a large role in the error. As mentioned previously, as the nature of quantum mechanical calculations, a slight variation in the conformation of the molecule could result in the location of a different minima thus affecting the free energy and in practice affecting the computed e.e.. In particular for the Jacobsen catalyst a mechanism and transition state have not been concluded and therefore computing the energy of a hypothesised transition state cannot be entirely accurate.
Unfortunately in this case the e.ee values do not correspond to the literature or follow the trend we would predict.
Investigating the non-covalent interactions in the active-site of the reaction transition state
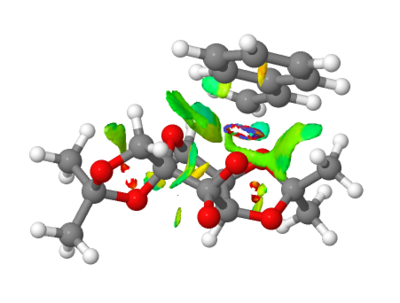
The second transition state for the Shi Catalyst mechanism for the epoxidation of Styrene (R) is used for the following NCI anaylsis.
Non covalent interactions anaylsis is a good display of the attractive and repulsive nature of interactions i.e. the attractive interactions could be hydrogen bonds, vdW attractions and the repulsive could be close proximity of electronegative atoms or lone pairs. The colours are used to distingusih between the nature of interactions: blue - very attractive, green - mildly attractive, yellow - mildly repulsive and red - strongly repulsive.
The slightly blue coloured ring indicates a region of strong attraction, thus it is assumed a bond is forming in a transition state (which can be considered half-covalent) as expected. Although, as mentioned in the script this type of NCI interaction is normally dismissed. The green surface around it displays the mild attraction between the catalyst and substrate.
In this second image the arrow labelled 1 pointing to two regions of strong repulsion appear between the oxygens in the 5 member rings of the Shi catlayst, indicating a slightly repulsive approach of the two electronegative atoms due to closer proximity than their van der Waals radii. Arrow 2 points to a mildly attractive region between a hydrogen and the electronegative oxygen, possibly indicative of a hydrogen bond.
Investigating the Electronic topology (QTAIM) in the active-site of the reaction transition state
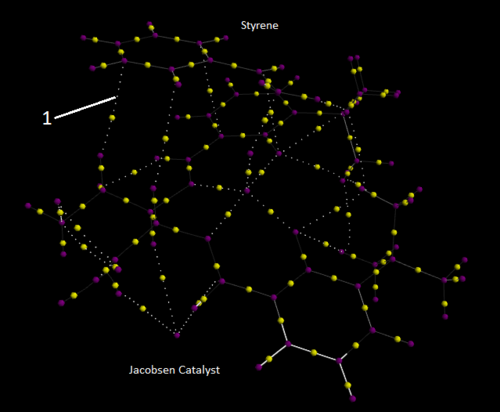
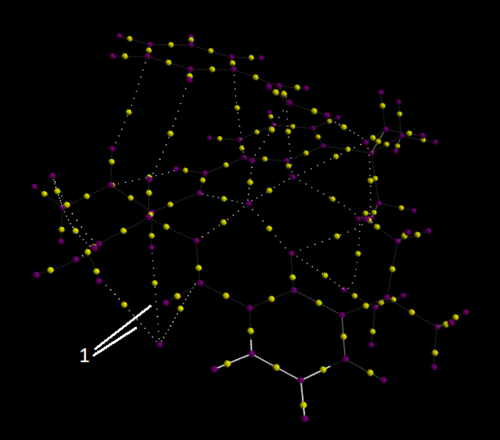
QTAIM analysis focuses on imaging the electron density. The purple spheres identify atoms and the yellow spheres between indicate bonds i.e. where electron density is strongest. The smaller white spheres show interactions which are not defined as bonds. The transition state being analysed is the second transition state of the Jacobsen catalyst epoxidation of Styrene (S).
The arrow labelled 1 indicates an interaction between a carbon and hydrogen.
The arrow labelled 1 in this picture indicates several interactions between hydrogens and a single Cl atom (the lower purple sphere) which could potentially represent hydrogen bonds.
Suggesting new candidates for investigation[16]
Using Reaxys the parameters input were molecular weight<200.0 AND '-15<OPR<15', this returned many results and the chosen candidate for investigation was decided to be (S)-(−)-Glycidol.
This molecule has a molecular weight of 74.08, an optical rotation of -15θ, and an e.e. of 98%. As expected, its enantiomer (R)-(+)-Glycidol has an optical rotation of +15θ. From considering the analysis done for this computational lab, this molecule seems acceptable to undergo the extensive analysis employed. The corresponding alkene, 2-propen-1-ol is readily available from Sigma Aldrich at a slightly expensive price of £69.80 for 500ml.
References
1) Caramella, P., Quadrelli, P., & Toma, L. (2002). An unexpected bispericyclic transition structure leading to 4+2 and 2+4 cycloadducts in the endo dimerization of cyclopentadiene. Journal of the American Chemical Society, 124(Figure 2), 1130–1131. doi:10.1021/ja016622h
2) http://www.ch.ic.ac.uk/motm/porphyrins/introDA.html
3) Larger rings and Atropisomers. Henry S. Rzepa, 2010-2014. http://www.ch.ic.ac.uk/local/organic/conf/c1_atrop.html
4) J. Am. Chem. SOC. 1981, 103, 1891-1900. (1981). Society, 1891–1900.
5) Enantioselective epoxidation of alkenes using the Shi Fructose-based catalyst. An undergraduate experiment. http://www.ch.imperial.ac.uk/rzepa/blog/?p=12308
6) Rispens, M. T., Meetsma, A., & Feringa, B. L. (1994). Crystal and Molecular Structure and Reactivity of Jacobsen Epoxidation Catalyst N , N ’ -di ( 3- t -butyl-5-methyl salicylidene ) cyclohexanediamine manganese ( III ) chloride · MeCN. Recueil Des Travaux Chimiques Des Pays-Bas, 415(September), 413–415.
7) Bondi, a. (1964). van der Waals Volumes and Radii. The Journal of Physical Chemistry, 68, 441–451. doi:10.1021/j100785a001
8) Shi, Z.-Q., Jiao, L.-X., Sun, J., Chen, Z.-B., Chen, Y.-Z., Zhu, X.-H., … Li, R. (2014). Cobalt nanoparticles in hollow mesoporous spheres as a highly efficient and rapid magnetically separable catalyst for selective epoxidation of styrene with molecular oxygen. RSC Advances, 4, 47. doi:10.1039/c3ra45383a
9) ASYMMETRIC EPOXIDATION OF trans-β-METHYLSTYRENE AND 1-PHENYLCYCLOHEXENE USING A D-FRUCTOSE-DERIVED KETONE: (R,R)-trans-β-METHYLSTYRENE OXIDE AND (R,R)-1-PHENYLCYCLOHEXENE OXIDE. Org. Synth. 2003, 80, 9. DOI: 10.15227/orgsyn.080.0009
10) Urbanova, M., Setnicka, V., Volka, K., & Technology, C. (n.d.). Application Note AN # 52 Fourier Transform Vibrational Circular Dichroism FT-VCD Spectroscopy. http://www.bruker.com/fileadmin/user_upload/8-PDF-Docs/OpticalSpectrospcopy/FT-IR/PMA_50/AN/AN52_VibrationalCircularDichroism_EN.pdf
11) Schneebeli, S. T., Hall, M. L., Breslow, R., & Friesner, R. (2009). Quantitative DFT modeling of the enantiomeric excess for dioxirane-catalyzed epoxidations. Journal of the American Chemical Society, 131(c), 3965–3973. doi:10.1021/ja806951r
12) Wang, Z.-X., Tu, Y., Frohn, M., Zhang, J.-R., & Shi, Y. (1997). An Efficient Catalytic Asymmetric Epoxidation Method. Journal of the American Chemical Society, 119(97), 11224–11235. doi:10.1021/ja972272g
13) Hanson, J. (2001). Synthesis and Use of Jacobsen’s Catalyst: Enantioselective Epoxidation in the Introductory Organic Laboratory. Journal of Chemical Education, 78(9), 1266. doi:10.1021/ed078p1266
14) Besse, P., Renard, M. F., & Veschambre, H. (1994). Chemoenzymatic synthesis of chiral epoxides. Preparation of 4-phenyl-2,3-epoxybutane and 1-phenyl-1,2-epoxypropane. Tetrahedron: Asymmetry, 5(7), 1249–1268. doi:10.1016/0957-4166(94)80167-3
15) Optical rotation of Styrene Oxide - Sigma Aldrich. http://www.sigmaaldrich.com/catalog/product/aldrich/540099?lang=en®ion=GB
16) Allyl alcohol - Sigma Aldrich. http://www.sigmaaldrich.com/catalog/product/aldrich/240532?lang=en®ion=GB
17) Carbon-13 Nuclear Magnetic Resonance Spectroscopy. Hans J. Reich 2010. http://www.chem.wisc.edu/areas/reich/nmr/notes-6-cmr.pdf


