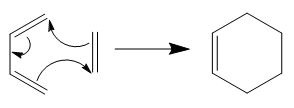
Rep:Mod:Mtn113
Transition States and Reactivity
Introduction
Transition states possess the highest energy levels in a reaction pathway, reflected as saddle points in potential energy surfaces. While transition states cannot be isolated and observed experimentally due to the instability of these transition states and their short lived nature, these transition states can be computationally modeled under different levels of theory. Using the Gaussian program, different computational methods (levels of theory) exist, of which we would employ three: Hartree Fock/3-21G, Density Functional Theory/B3LYP/6-31G* or Semi-Empirical/AM1. The fastest and most basic method would be the semi-empirical method, more specifically the Austin Model 1(AM1), followed by the Hartree Fock (HF) method and Density Functional Theory (DFT) method which is the most accurate and widely used mode of calculation. This follows from the fact that the AM1 method does not work from atomic orbital basis sets, while the HF method assumes that many-electron wavefuntions take the form of a determinant of single-electron wavefunctions, which means electronic correlations are neglected and thus electrons of the same spin can theoretically occupy the same orbital. As a result, energies estimated by HF tend to be overestimated as compared to DFT. However, in the DFT method, many-electron wavefunctions are replaced by considering electron density, and by including an electron exchange-correlation functional (B3LYP) [1], this means that interactions between electrons are taken into account, reflecting more accurate (and usually lower) energy values. Because of the aforementioned differences in the basis sets of the different levels of theory, it is not meaningful to compare energy values across varying methods.
In this exercise, locating of transition states is done via one out of the two following methods: making a guess of the transition state and positioning the molecules as such before optimising the overall structure with the TS Berny method; or by inputting the reactant and product structures and finding the transition state by studying the reaction pathway and identifying the structure where the highest energy level was reached between the two inputs. Two classes of pericyclic reactions would be explored in this exercise, namely the Cope Rearrangement and Diels Alder Cycloaddition.
Nf710 (talk) 23:19, 20 January 2016 (UTC)Good introduction. You have a good understanding of the methods. The methods cant be compared because of the different basis sets, but also because the hamaltonian is different in each case. AM1 stil uses orbitals it just has come of the calculations to derive them parameterised.
The Cope Rearrangement
Background
The Cope Rearrangement reaction has been studied as a classic example of a [3,3]-sigmatropic rearrangement, which falls under a class of pericyclic reactions. Involving 4π electrons, under the Woodward-Hoffmann rules, the rearrangement occurs with a conrotatory displacement of terminal atomic orbitals. With the rotation around the single C-C bonds in 1,5-hexadiene, there are many possible conformations of the molecule and it is possible that the transition state goes through a Boat or a Chair conformation. It is largely agreed that this rearrangement proceeds via a concerted mechanism through the chair conformation preferentially due to its lower energy and this claim shall be elucidated through this computational experiment.
A 1,5-hexadiene was first drawn as the anti- conformation, which is expected to be the most stable conformation as the most sterically demanding groups are anti-periplanar to each other with a dihedral angle of 180. Another conformation was drawn with a 60 degree change in the dihedral angle, which was the synclinal (gauche) conformation. Both conformations are drawn and subsequently optimized using HF (3-21G) and DFT (B3LYP/6-31G*).
Conformational Analysis
1,5-hexadiene (Anti1 Conformation)
The anti- conformation was symmetrized and was found to possess a C2 point group symmetry (anti1[2] ). The energy was found to correspond to the reference value of -231.69260 hartree units.
| Conformation | Level of Theory | Optimised Structure | Point Group | Results Summary | Log File | ||
|---|---|---|---|---|---|---|---|
| Anti1 | HF/3-21G |
|
C2 | 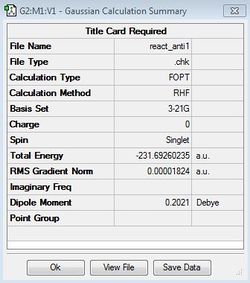 |
Anti1 log |
1,5-hexadiene (Gauche3 Conformation)
| Conformation | Level of Theory | Optimised Structure | Point Group | Results Summary | Log File | ||
|---|---|---|---|---|---|---|---|
| Gauche3 | HF/3-21G |
|
C1 |  |
Gauche3 log |
A gauche conformation was then drawn by varying the dihedral angle by 60 degrees. It was expected that the gauche conformation would possess a higher energy than the anti conformation due to steric repulsion due to closer proximity of alkene groups and the groups' electron density. The molecule was symmetrized to C1 point group symmetry. After optimisation, it was found that this gauche3 conformation has the lowest energy of -231.69266 Hartree units [2]. This experimental result proved to be contrary to the hypothesis, which only considered steric repulsions. This suggests that electronic reasons predominate over steric reasons in this case.
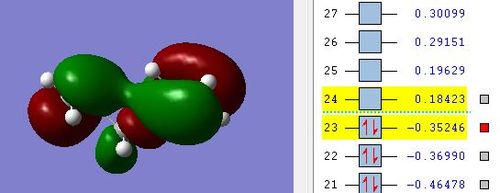
As observed from the highest occupied molecular orbitals above of gauche3 conformation, pi electron clouds of the alkene groups are seen to overlap, leading to stabilising secondary orbital interactions. This overlap will lead to an overall lowering of the energies of the molecular orbitals for the pi electrons[3].
Nf710 (talk) 23:23, 20 January 2016 (UTC) Good use of orbitals to show the ordering of energies
1,5-hexadiene (Anti2 Conformation)
Another conformation was drawn to obtain the anti2 conformer. In order to reach this conformer quickly, the molecule was symmetrised and made to adopt the Ci point group symmetry before optimisation was carried out. The energy value obtained was compared and verified with reference value to be -231.69254 Hartree units [2].
| Conformation | Level of Theory | Optimised Structure | Point Group | Results Summary | Log File | ||
|---|---|---|---|---|---|---|---|
| Anti2 | HF/3-21G |
|
Ci | 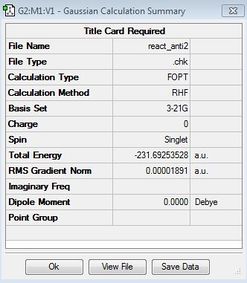 |
Anti2 HF log | ||
| Anti2 | DFT (B3LYP)/
6-31G* |
|
Ci | 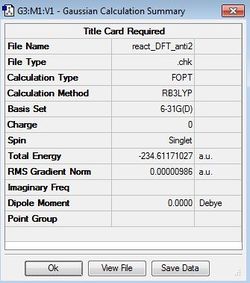 |
Anti2 DFT log |
Comparing Level of Theory
The difference in computational methods is shown in this example by running optimisation of anti2 via both HF/3-21G and DFT/B3LYP/6-31G*. The stark discrepancy is shown in the energy values obtained for each of the methods. While it is meaningless to compare the quantified values, this result obtained is in accordance with what was predicted, where the less accurate method, HF, would be expected to overestimate the energy as compared to DFT.
HF: -231.69254 Hartree units
DFT: -234.61171 Hartree units
| Level of Theory | Point Group | Dihedral Angle ° | Bond Lengths Å | ||
|---|---|---|---|---|---|
| C12-C1-C4-C7 | Terminal C13-C12 | C12-C1 | Central C1-C4 | ||
| HF/3-21G | Ci | -180.00000 | 1.32 | 1.51 | 1.55 |
| DFT (B3LYP)/6-31G* | Ci | 180.00000 | 1.33 | 1.50 | 1.55 |
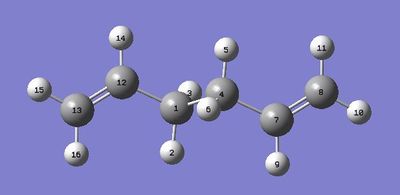
The geometrical analysis was carried out by comparing bond distances (rounded off to 2 decimal places to minimise errors in program) between adjacent carbon atoms and the dihedral angles. While there are slight differences, the discrepancies are not significant. This suggests that for simple molecules, computing with less precise basis sets can yield reasonable results at a lower computational cost and at a much faster rate.
Nf710 (talk) 23:26, 20 January 2016 (UTC) You missed a dihedral, but well concluded about the basis sets
Frequency Analysis
An Opt+Freq calculation was run on the anti2 conformer to ensure that the lowest energy conformation was obtained in each method. This was done by checking the vibration frequencies from the conformation and making sure there were no imaginary frequencies present (negative values). If all frequencies are positive, this would suggest that a minimum point was reached in the optimisation and not an inflection point or a maximum point. This is because the second derivative of the energy gives a force constant k, that is included in the calculation of vibrational frequencies in the form of the root of the force constant. If there was a maximum point present, the negative second derivative obtained would give a negative k value, and thus the root will be imaginary. The Infrared Spectrum is also recorded and compared with reference spectrum.
Nf710 (talk) 23:27, 20 January 2016 (UTC) Good explanation but you should have included an equation.
| IR Spectrum | Frequency calculation |
|---|---|
 |
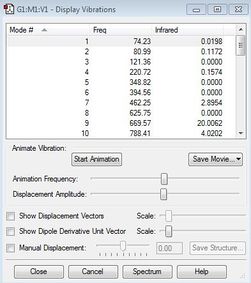 |
All 42 vibrational frequencies were positive, showing that a minimum point has indeed been reached in the optimisation.
| Results Summary | Optimised structure | Log File | ||
|---|---|---|---|---|
 |
|
DFT_Freq_Log |
| Thermochemical data |
|---|
 |
Thermochemical data was obtained from the log file. The first energy value obtained, which is the sum of electronic potential energy and zero point energy, was calculated at a temperature of 0 K. The rest of the energy values were calculated at 298.15 K and 1 atm. As the bonds in 1,5-hexadiene are modelled by a quantum harmonic oscillator, we can infer that at 0 K, the zero point energy would be measuring the vibrational energy that is present in the molecule at 0 K, because translational and rotational energies would be absent at 0 K. The second energy value calculated at 298.15 K would include all modes of energy present: electronic, rotational, translational and vibrational modes. The third energy value includes thermal enthalpy which is incorporated in the form of an additional term RT in H = E + RT (where R is the gas constant and T is temperature). At 0 K, RT = 0 and therefore H = E. The last energy value takes into account the free energy of the system with the inclusion of the entropy term H = G + TS. As the calculations are conducted at a constant pressure, any increase in temperature will lead to an increase in enthalpy H correspondingly.
Chair/ Boat Transition State Optimisation
In this part of the tutorial, the Chair and Boat transition states would be optimised in a variety of ways, all done at HF/3-21G level of theory. The chair transition states would be optimised using TS Berny and by freezing coordinates while the boat transition states would be optimised using QST2 and QST3 methods.
Optimisation via TS Berny
The molecule 1,5-hexadiene was redrawn as two separate 3 carbon allylic fragments. They were optimised at HF/3-21G basis set and then combined and positioned such that they resemble a chair transition state and the terminal carbons were 2.2 Å apart. In this method, the structure drawn and positioned must be roughly accurate to the actual transition state if not the optimisation will not be successful. A Gaussian optimisation was set up using TS Berny and force constants were chosen to be calculated once. An additional keyword "Opt=noeigen" was added to ensure the program does not crash in the event that more than one imaginary frequency was located. As explained above, an imaginary frequency observed means that the second derivative of the energy measured is negative, which shows the curvature of the potential energy surface and implies that the energy of the structure at that point is at a local maximum, ie a transition state at a maximum energy level has been reached.
| Results Summary | Optimised structure | Log File | ||
|---|---|---|---|---|
 |
|
Chair TS Berny log |
| Imaginary Frequency cm-1 | Frequency calculation | Transition state |
|---|---|---|
| -817.92 | 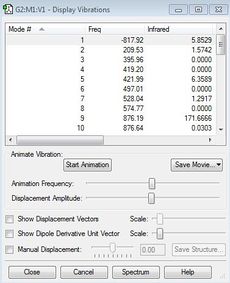 |

|
An imaginary frequency was observed to be at -817.92cm-1, confirming the transition state has been reached.
Optimisation via frozen coordinates
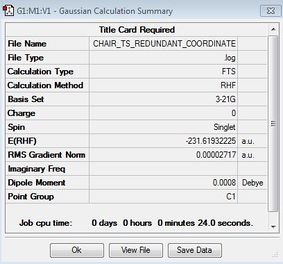
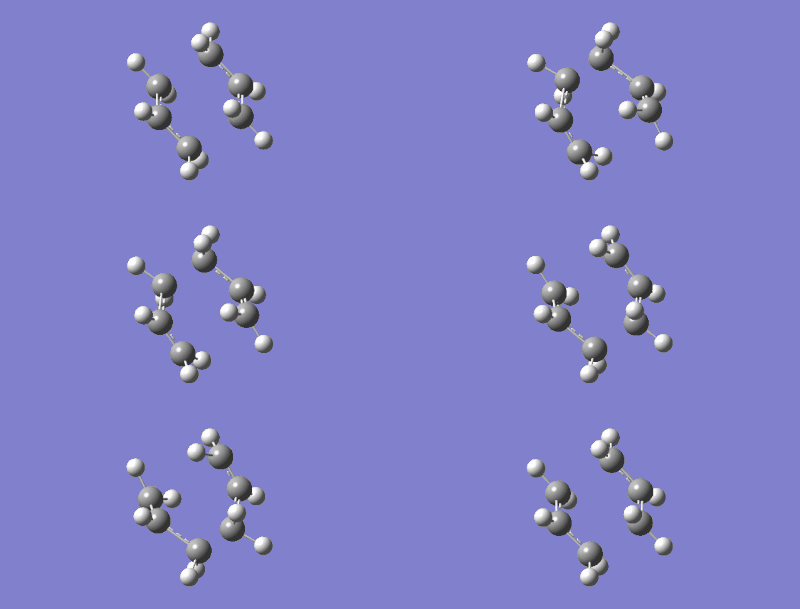
In this alternative pathway, the distance between terminal carbons are kept constant (or 'frozen') at 2.2 Å using the Redundant Coordinates editor, and the rest of the molecule was then optimised to a minimum with no force constants calculated. This might be a better way to conduct an optimisation since it does not rely as much on the way the molecule was drawn and positioned as the previous method with TS Berny. Once again, an imaginary frequency was obtained at -817.85cm-1, showing that a transition state had been obtained.
| Results Summary | Optimised structure | Log File | ||
|---|---|---|---|---|
 |
|
Frozen coordinate log |
| Imaginary frequency cm-1 | Frequency calculation | Transition state |
|---|---|---|
| -817.85 |  |
|
Comparison of methods
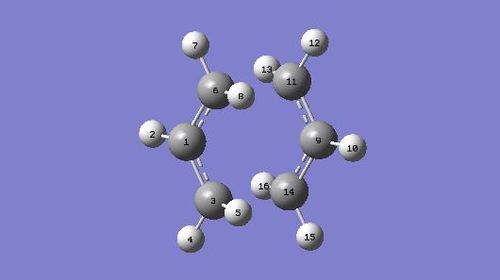
In comparison of the above two methods, it can be seen that the energy values obtained are very close (-231.61932244 vs -231.61932225); hence there is no difference in using either method in leading to the same chair transition state. When the geometries of the resulting molecules were compared, it can be seen that the frozen coordinates method seem to have a more symmetrical molecule as the intermolecular distances are closer to each other than those in TS berny. However, this does not seem to have a significant effect on the resulting transition state.
| Atoms | TS Berny/(Å) | Frozen Coordinate/(Å) |
|---|---|---|
| C3-C14 | 2.02036 | 2.02042 |
| C6-C11 | 2.02067 | 2.02052 |
Optimisation via QST2/QST3
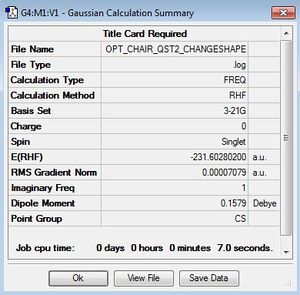
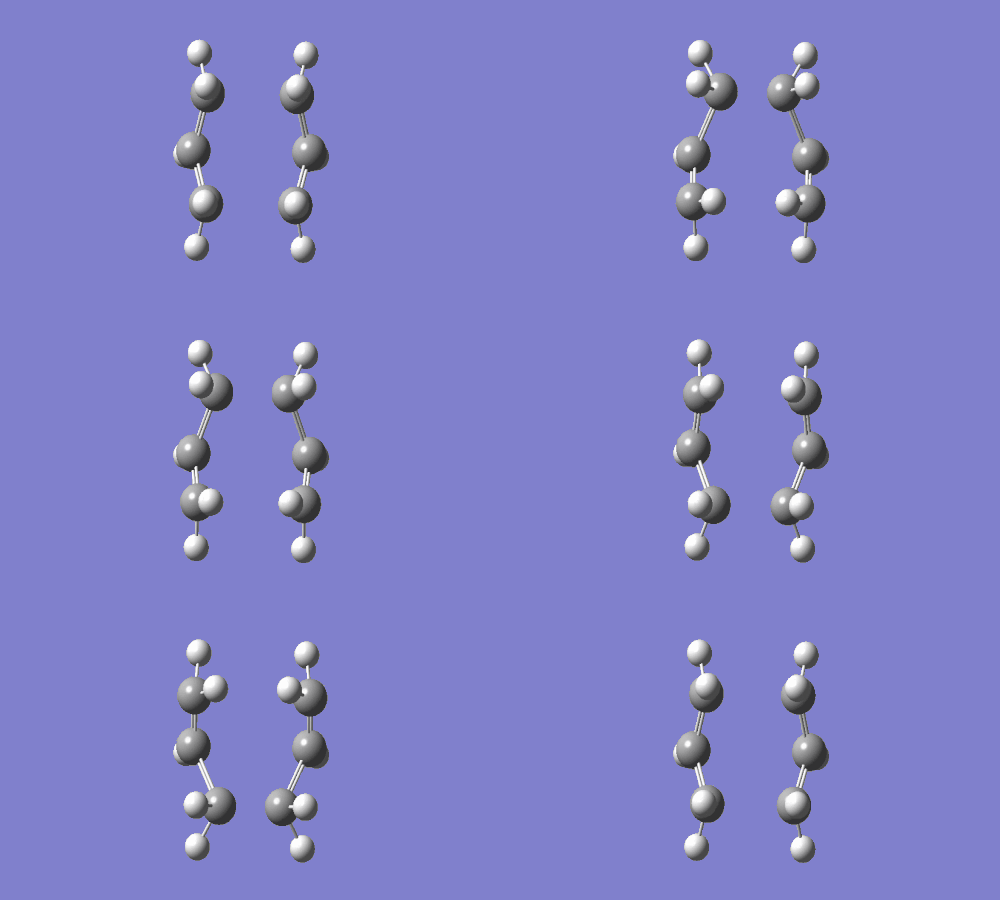
From the Synchronous Transit-Guided Quasi-Newton (STQN) method, an option QST2 was utilised in this optimisation for the boat conformation. In this QST2 method, unlike other previous methods, it does not require a guess for the transition state. Instead, two molecule specifications, one each for the reactant and product, are required as inputs for this optimisation. The first time the optimisation was ran, the program crashed as the reactant and product conformers did not resemble the actual conformers. Thus, some adjustments were made to the dihedral angle for the central four carbon atoms to 0 degrees and the inside angles for the inner three carbons to be 100 degrees. After that adjustment was made, the opt+freq calculations went through successfully and showed an imaginary frequency, which confirmed the presence of a transition state.
| Results Summary | Energy/ Hartree units | Imaginary Frequency cm-1 | Optimised structure | Log File | ||
|---|---|---|---|---|---|---|
 |
-231.60280200 | -839.94 |
|
QST2 |
| Labelled Optimised Boat Molecules | Transition State Vibration |
|---|---|
 |
|
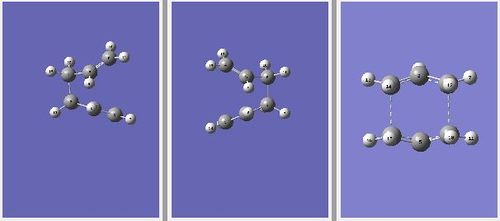
Subsequently, the optimisation was done again with the QST3 method instead, where the difference lies in that, in addition to the molecule specifications of the product and reactants, a guess was also made of the transition state. This guess was taken from the transition state found from the IRC pathway from QST2.
| Results Summary | Energy/ Hartree units | Imaginary Frequency cm-1 | Optimised Structure | Log File | ||
|---|---|---|---|---|---|---|
 |
-231.60280243 | -839.93 |
|
QST3 |
The suggested transition state is seen in the third column. From the results above, it can be seen that there is no significant difference between running the optimisation of the boat conformation with QST2 or QST3 as the energy and imaginary frequency values are almost equivalent.
| Labelled Optimised Boat Molecules | Transition State Vibration |
|---|---|
 |

|
Nf710 (talk) 23:35, 20 January 2016 (UTC) your frequencies are correct
Intrinsic Reaction Coordinate (IRC)
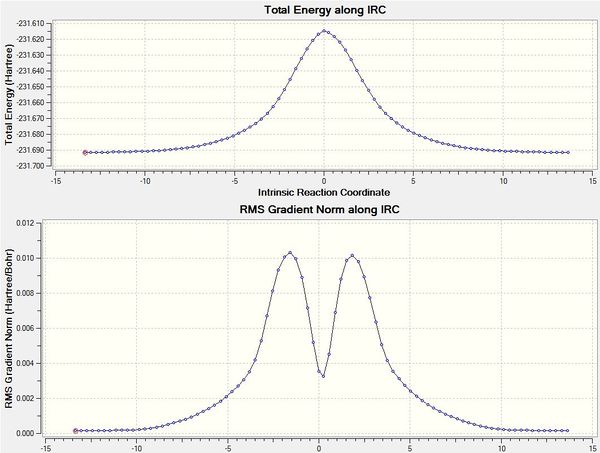
However, it is still not known which conformer of 1,5-hexadiene that the transition state leads to yet. An IRC is a minimum energy pathway taken by the molecule from its transition state (a local maximum) down the path of least resistance on both sides towards a local minimum on the potential energy surface. An IRC was run in both directions for 70 steps from the transition state, but it was observed that the IRC would turn out to be symmetrical, hence IRC in only the forward direction could be calculated for future IRCs.
| IRC |
|---|
|
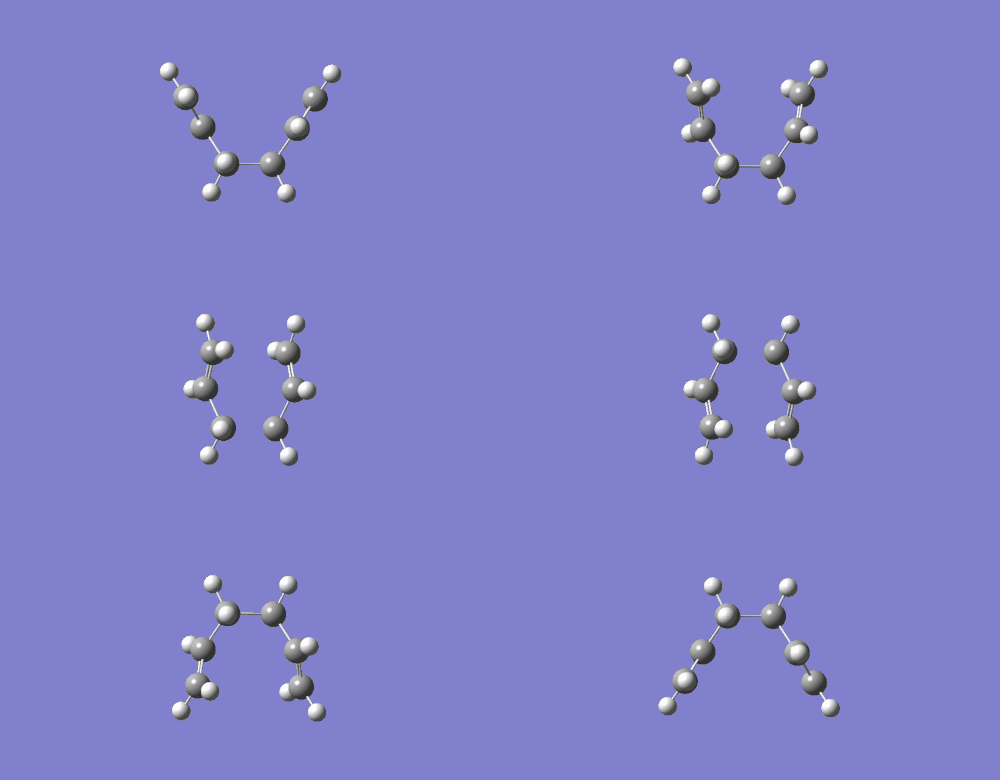 |
From the graphs, it can be seen that the energy at the transition state where it starts to run is the highest, and falling to a minimum (product) thereafter. From the gradient graph, it can be seen that it starts off from the transition state because it would be a maximum point (with gradient 0), increase to a maximum as it follows the path with the greatest slope, before falling to a local minimum with a gradient tending towards 0. The structure obtained at the 44th step was reoptimised and was found to possess an energy value of -231.69166702 Hartree atomic units, and a point group symmetry of C2. The log file can be found here. By comparison to reference energy values (-231.69167 a.u.), it can be concluded that the conformer obtained is gauche2.
Correct conformer
Comparing level of theory
In this last part of the tutorial, the level of theory would be compared on the basis of the resulting structures from each method as well as investigating how close the activation energy values are to the reference values. The boat and chair conformations were reoptimised at a higher level of theory, DFT/B3LYP/6-31G* and a vibrational frequency analysis was run.
Geometrical Analysis
The log files for opt+freq at HF/3-21G for boat conformation can be found here. The log files for opt+freq at DFT/B3LYP/6-31G* for boat conformation can be found here.
The log file for opt+freq at HF/3-21G for chair conformation can be found here. The log file for opt+freq at DFT/B3LYP/6-31G* for chair conformation can be found here.
| Method | Chair TS Seperation (Å) | Boat TS Seperation (Å) |
|---|---|---|
| HF/321G | 2.02 | 2.14 |
| DFT/B3LYP/631G* | 1.97 | 2.21 |
From the geometrical analysis, the distances between the terminal carbons of the allylic fragments were shown to be similar and no significant discrepancies were detected.
Activation Energy Comparison
| HF/3-21G | B3LYP/6-31G* | |||||
|---|---|---|---|---|---|---|
| Electronic energy | Sum of electronic and zero-point energies (0 K) | Sum of electronic and thermal energies (298.15 K) | Electronic energy | Sum of electronic and zero-point energies (0 K) | Sum of electronic and thermal energies (298.15 K) | |
| Chair TS | -231.619322 | -231.466701 | -231.461342 | -234.556931 | -234.414909 | -234.408981 |
| Boat TS | -231.602802 | -231.450928 | -231.445299 | -234.543079 | -234.402354 | -234.396010 |
| Reactant (anti2) | -231.692535 | -231.539539 | -231.532565 | -234.611712 | -234.469213 | -234.461865 |
From the energy values calculated, a constant discrepancy of 3 Hartee units was observed between the values obtained from the HF/3-21G and DFT/B3LYP/6-31G* methods.
| HF/3-21G | HF/3-21G | B3LYP/6-31G* | B3LYP/6-31G* | Expt. | |
| Activation Energy at 0 K | Activation Energy at 298.15 K | Activation Energy at 0 K | Activation Energy at 298.15 K | Activation Energy at 0 K | |
| ΔE (Chair) | 45.71 | 44.69 | 34.08 | 33.18 | 33.5 ± 0.5 |
| ΔE (Boat) | 55.60 | 54.76 | 41.95 | 41.32 | 44.7 ± 2.0 |
Activation energies refer to the minimum amount of energy that reactant molecules need to gain before they can reach the transition state energy, hence the difference between the TS energies and the reactants was calculated. This is calculated in kcal which is converted from a.u. by multiplying by 627.503. From the activation energies calculated and in comparison to the experimental values, it can be seen that computations run at a higher level of theory would produce activation energies that are much closer to experimental data. However, this comes at a higher computational cost and longer time required to run the computations. In all, it depends on the objective of the computations - if geometries of the resulting transition state are to be studied, computations can be run at lower levels of theory. However, if energy values are required for comparison and discussion, they have to be run at higher levels of theory to ensure accuracy. It can be concluded that in future computations, the geometries can be optimised first at a lower level of theory, followed by a re-optimisation of the product at a higher level of theory to obtain closer energy values to experimental data.
Nf710 (talk) 19:59, 21 January 2016 (UTC) Well done you have shown a good level of understanding and done most of the requited tasks
Diels Alder Cycloaddition
Background
In this part of the computation, knowledge gained from the tutorial was applied to the Diels Alder cycloaddition. Cycloadditions belong to a class of pericyclic reactions, and Diels Alder cycloadditions are characterised under [4n+2]π type reactions. These reactions occur between a diene and a dienophile in a concerted fashion, involving the breaking of two pi bonds and the formation of two sigma bonds. Two Diels Alder cycloadditions are investigated in this part of the exercise, namely the reaction between ethene and cis-butadiene and the reaction between maleic anhydride and cyclohexa-1,3-diene. Reactions would proceed when the Highest Occupied Molecular Orbital (HOMO) of the electron rich diene is close in energy to the Lowest Unoccupied Molecular Orbital (LUMO) of the electron poor dienophile to ensure sufficient overlap of the molecular orbitals and ensure a favourable reaction. Since maleic anhydride is an electron poor dienophile and cyclohexa-1,3-diene is more electron rich than cis-butadiene, the molecular orbitals are expected to be closer in energy and hence larger electronic interactions.
(In this section you could talk a little more about DA reactions. What is the importance of orbital symmetry? Tam10 (talk) 10:28, 12 January 2016 (UTC))
For this section, calculations are first calculated at the Semi-empirical level of theory to produce estimated structures that best agree with empirical data. To be more specific, the AM1 method employed here uses a Neglect of Differential Diatomic Overlap (NDDO) integral approximation which follows a set of parameters and is less complicated as compared to the Hartree-Fock method used in previous sections. Hence, for complex organic molecules, it makes sense to use the semi-empirical method to "guess" a transition state structure at a lower computing cost and time before using a higher theory level to compute it. It was found however that the AM1 method does not work as well for inorganic molecules, and a method with more parameters such as PM6 might have to be used instead.
Optimisation of ethene and cis-butadiene
| Molecule | Level of Theory | Optimised Structure | Point Group | Results Summary | Energy/ Hartree units | Log File | ||
|---|---|---|---|---|---|---|---|---|
| Ethene | Semi-empirical/AM1 |
|
D2h |  |
0.02619028 | Ethene Log | ||
| Cis-butadiene | Semi-empirical/AM1 |
|
C2v | 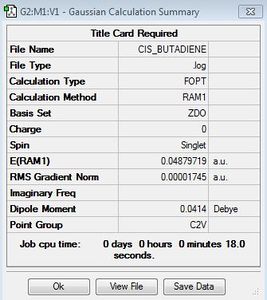 |
0.04879719 | Butadiene Log |
As mentioned above, the structures of ethene and cis-butadiene were drawn on Gaussview, cleaned and optimised separately using the Semi-empirical/AM1 method. The dihedral angle for cis-butadiene was changed to 0 degrees to ensure planarity of the molecule. The molecular orbitals of ethene and cis-butadiene were visualised to note the symmetries of the HOMO and LUMO. It can be seen from the diagrams below that for butadiene the HOMO is antisymmetric with respect to the plane of symmetry perpendicular to the central C-C bond. The LUMO on the other hand is symmetrical with respect to the same plane. Ethene, on the other hand, has a symmetric HOMO and antisymmetric LUMO.
| HOMO | LUMO | |
|---|---|---|
| Ethene | 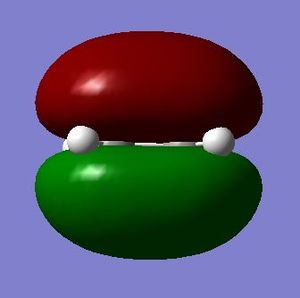 |
 |
| Butadiene | 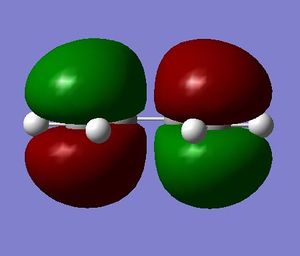 |
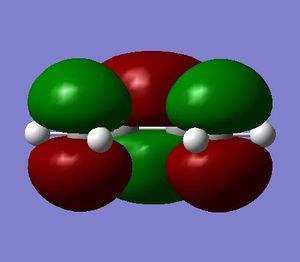 |
Obtaining the Transition State via TS Berny
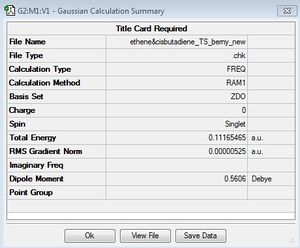
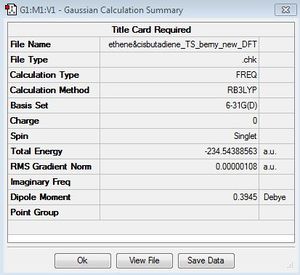
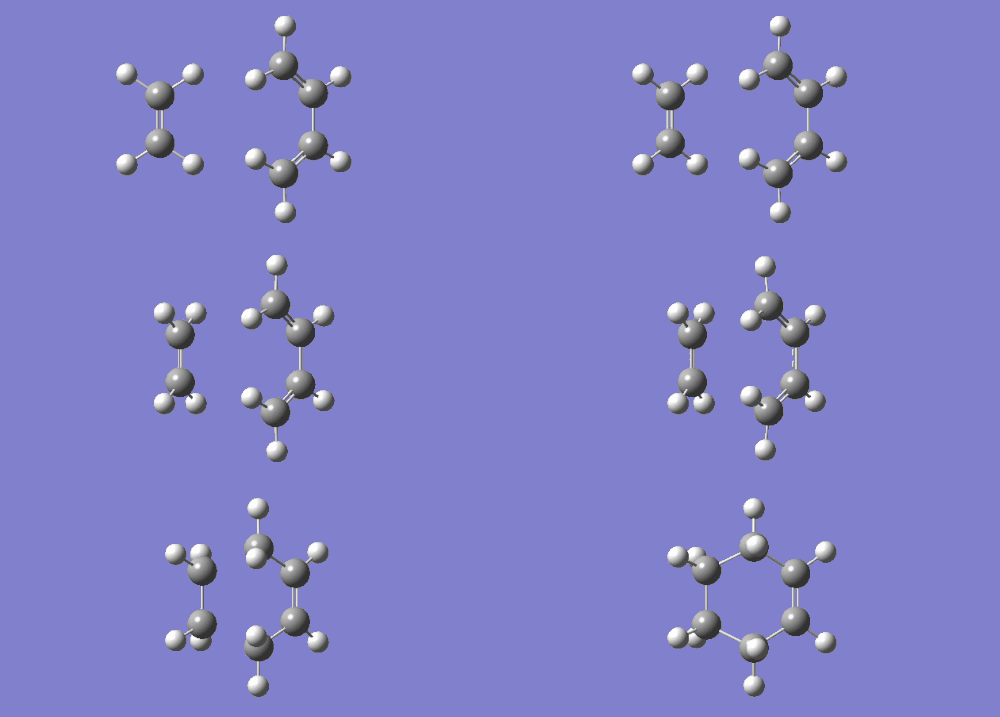
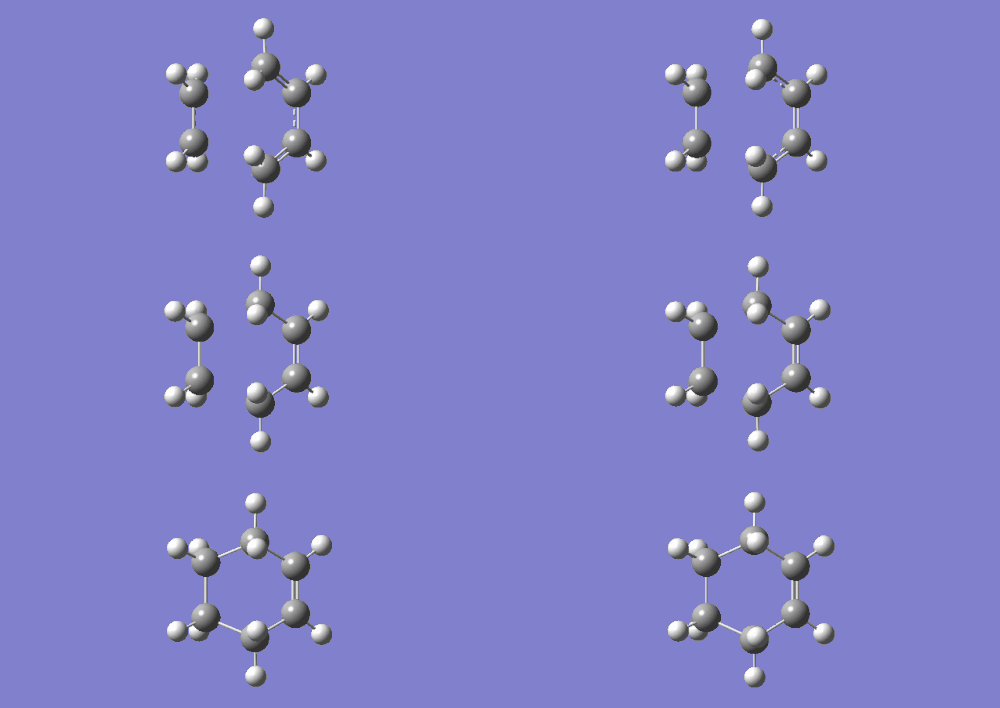
Once the reactants have been optimised, they were combined with an intermolecular distance of 2.20 Å. The transition state structure for this reaction was obtained by running an optimisation with TS Berny under semi-empirical/AM1 level of theory. After the computation was successful, it was reoptimised at a higher level of theory DFT/B3LYP/6-31G*. The results obtained from both the levels of theory are summarised as below. There were large differences in the imaginary frequencies obtained, as well as energy values of the transition states. However, IRC shows reaction pathways to be similar and lead to the desired products.
| Level of Theory | Optimised Structure | Results Summary | Imaginary Frequency cm-1 | Log File | ||
|---|---|---|---|---|---|---|
| Semi-empirical/AM1 |
|
 |
-956.23 | AM1 TS Log | ||
| DFT/B3LYP/6-31G* |
|
 |
-526.70 | DFT TS Log |
| Level of Theory | Reaction coordinate and animation |
|---|---|
| Semi-empirical/AM1 | 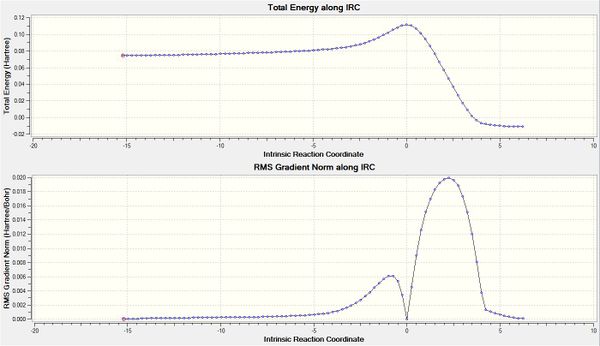
|
| |
| DFT/B3LYP/6-31G* | 
|
|
Molecular Orbitals Analysis
| MO | Visualisation |
|---|---|
| HOMO | 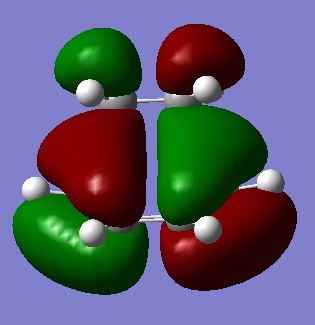 |
| LUMO |  |
The HOMO of the transition state is observed to be antisymmetric with respect to the plane that is perpendicular to the central C-C bond, while the LUMO is symmetric to the plane. From Frontier Molecular Orbitals analysis [4], it can be inferred that only molecular orbitals of the same symmetry can combine. Thus, the antisymmetric HOMO is made from the HOMO of cis-butadiene and the LUMO of ethene. The symmetric LUMO is built from the LUMO of cis-butadiene and HOMO of ethene.
Vibrational Frequency Analysis
| Imaginary Frequency cm-1 | Visualisation | Description |
|---|---|---|
| -956.23 | 
|
Synchronous |
| 147.24 | 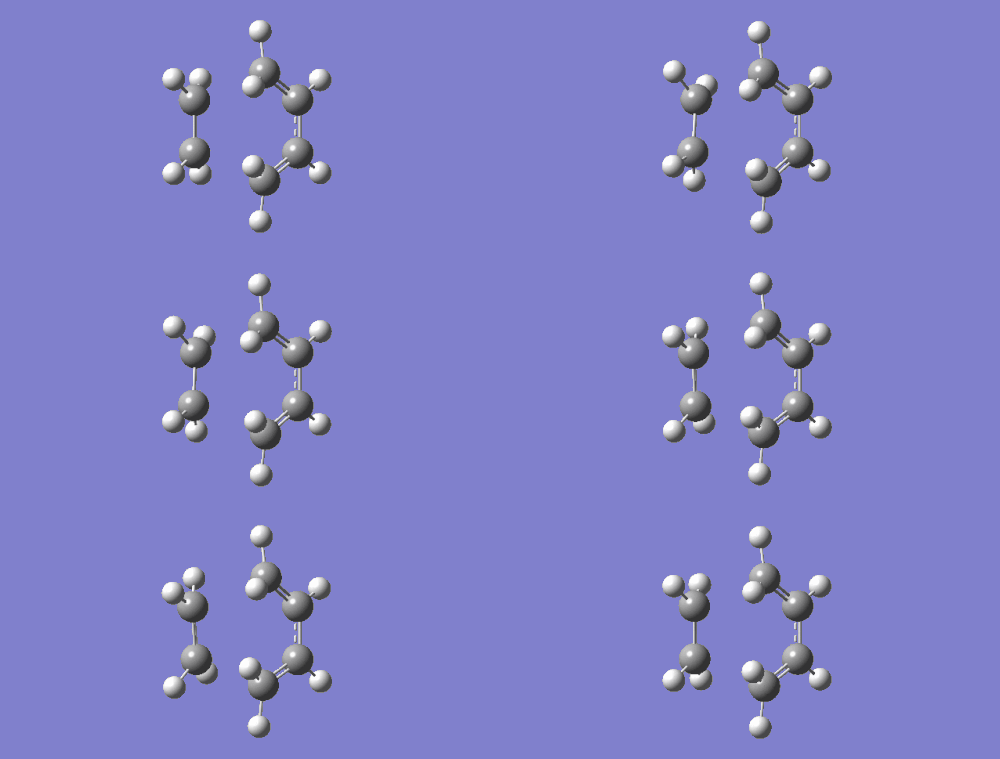
|
Asynchronous |
The negative frequency suggests a transition state has been obtained and this is confirmed with the visualisation of the vibration. It can be seen that the terminal carbons that are involved in the C-C sigma bond formation move towards each other in a synchronous fashion. This also implies that the formation of the two new bonds occur in a concerted mechanism.
In contrast to this, the visualisation of the first positive frequency is also shown. This shows the fragments rotating about a perpendicular rotational axis and the fragments do not get close enough to form new bonds, hence this vibration does not lead to a successful reaction.
Geometrical Analysis
| C9-C12 /Å | C12-C5 /Å | C5-C3 /Å | C3-C1 /Å | Literature C=C value[5]/ Å | Literature C-C value[5]/Å | C Van Der Waals Radius [6]/ Å | |
|---|---|---|---|---|---|---|---|
| Semi Empirical/AM1 | 1.383 | 2.119 | 1.382 | 1.397 | 1.334 | 1.544 | 1.70 |
| DFT/B3LYP/6-31G* | 1.386 | 2.272 | 1.383 | 1.407 |
From the above bond distances (rounded off to 3 decimal places to compare with literature values), there is no significant discrepancies besides the fact that at a higher level of theory, the transition state is observed when the two fragments are further apart (2.27211 vs 2.11915 Å). Both these values are smaller than the sum of van der Waals radii, which show some form of interaction in both cases. However, this discrepancy suggests that the actual through space interactions between the terminal carbons are stronger than expected and the highest energy transition state is reached at a distance that is further apart.
The rest of the bond distances are in agreement between the two levels of theory and shows clearly that the distances between C5-C3 and C3-C1 are almost equivalent, suggesting breaking of pi bond over C5-C3 and forming of the pi bond over C3-C1. The bond distances are found to be between the literature values of C-C and C=C bonds, suggesting partial double bond character in both bonds.
Investigating Regioselectivity of Diels Alder Cycloaddition
For more complicated organic molecules undergoing Diels Alder Cycloaddition, concepts of regioselectivity have to be taken into consideration. Two products can be formed - endo product which is the kinetically favoured product and the exo product which is the thermodynamically favoured product.
This is investigated by computing the reaction between maleic anhydride and cyclohexa-1,3-diene. As mentioned above, this reaction is expected to be more facile due to the dienophile (maleic anhydride) being more electron poor and diene (cyclohexa-1,3-diene) more electron rich. The transition states of both cases would be studied and activation energies and MOs would be analysed.
Optimisation of Transition States
The product of the Diels Alder cycloaddition was drawn and then had some bonds removed, and the resulting structure was then optimised under Semi-empirical AM1 to a TS (Berny). The fragments were positioned with an interfragment distance of 2.2 Å. The point group was found to be C1. The results from the optimisation, MOs and IRC are shown below.
Endo Product
The molecule was drawn such that maleic anhydride overlaps with the diene component on cyclohexa-1,3-diene to allow secondary orbital interactions.
| Optimised Structure | Energy/ Hartrees | Imaginary Frequency/ cm-1 | Imaginary Frequency Animation | Log File | ||
|---|---|---|---|---|---|---|
| -0.05150480 | -806.39 | 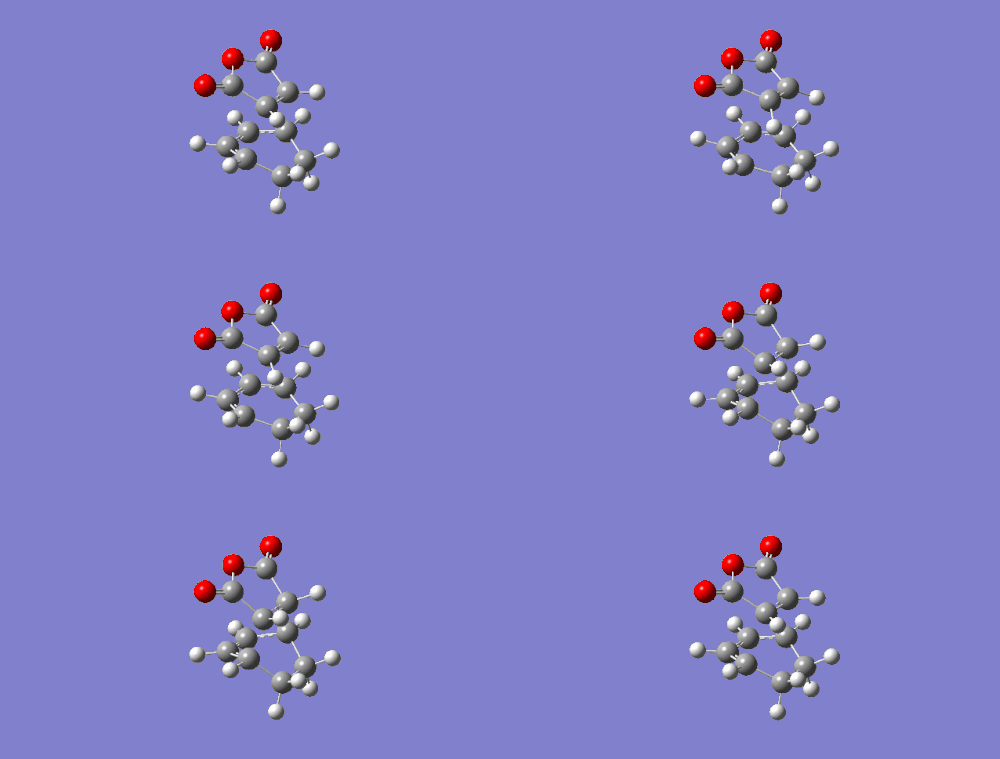
|
Endo Log |
An IRC was run to confirm visually that interactions between the fragments lead to the desired product through the transition state.

As shown below, both HOMO and LUMO of endo transition states are antisymmetric with respect to the plane that is perpendicular to the central C-C bond. Secondary orbital overlap[7] between maleic anhydride and diene can also be seen in the LUMO+2 MO between C=O π* and C=C π* orbitals, which does not directly contribute to the bonding in the molecule.
(There is negligible population in the LUMO+2 to stabilise the endo TS Tam10 (talk) 10:36, 12 January 2016 (UTC))
| MO | Visualisation |
|---|---|
| HOMO | 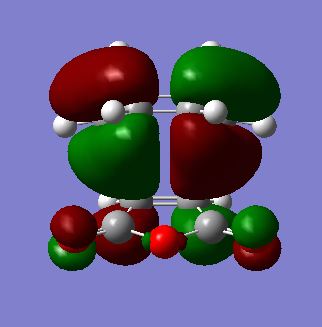 |
| LUMO |  |
| LUMO +2 | 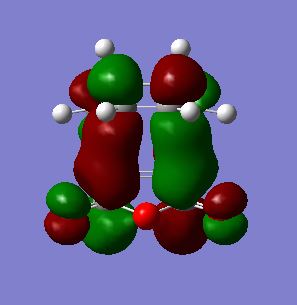 |
Exo Product
The molecule was drawn such that maleic anhydride does not overlap with the diene component and hence no secondary orbital interaction was possible.
| Optimised Structure | Energy/ Hartrees | Imaginary Frequency/ cm-1 | Imaginary Frequency Animation | Log File | ||
|---|---|---|---|---|---|---|
| -0.05041981 | -812.36 | 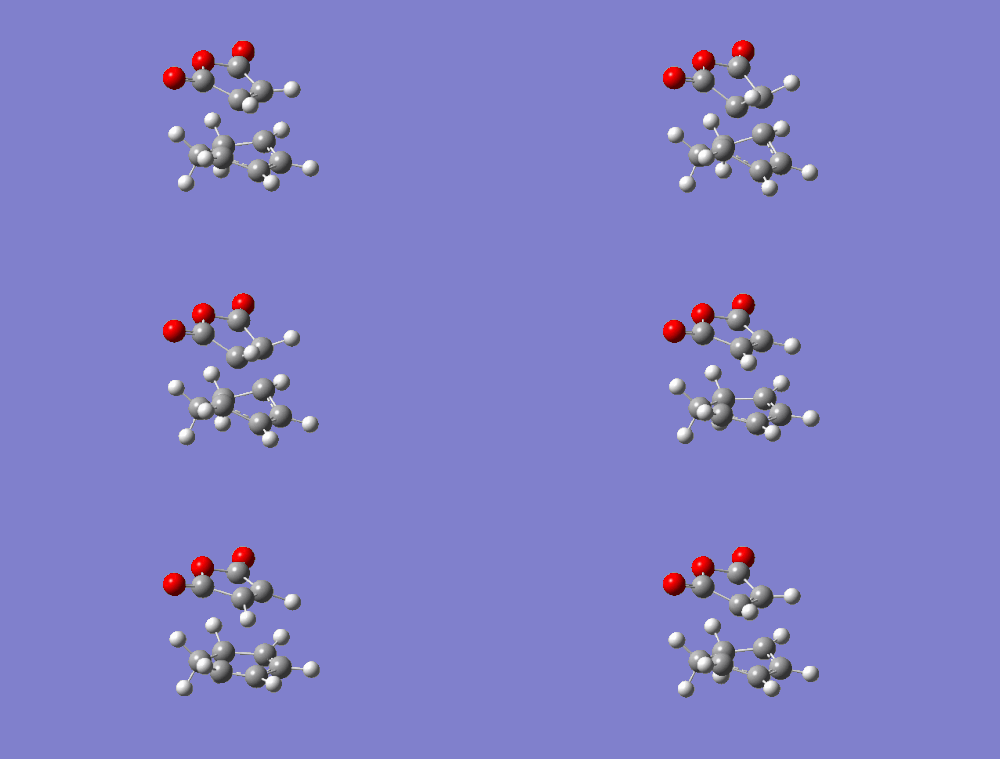
|
Exo Log |
An IRC was run to check visually that the reaction proceeds towards the desired product through the transition state.
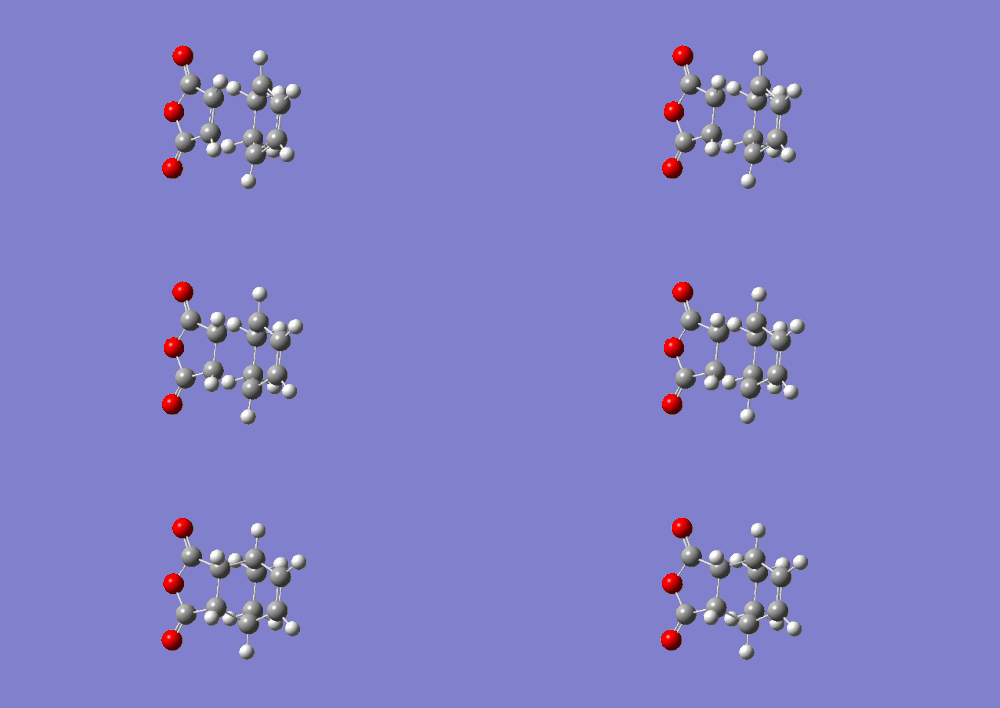
As with endo product MOs, both HOMO and LUMO of the exo product are antisymmetric with respect to the plane of symmetry. However, from LUMO+2 MO, an absence of secondary orbital interactions was observed due to the C=O π* and C=C π* orbitals in opposite orientations and hence too far apart to overlap. This lack of extra stability accounts for the higher energy value obtained for the transition state for the exo product.
| MO | Visualisation |
|---|---|
| HOMO | 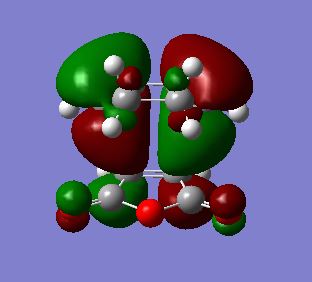 |
| LUMO | 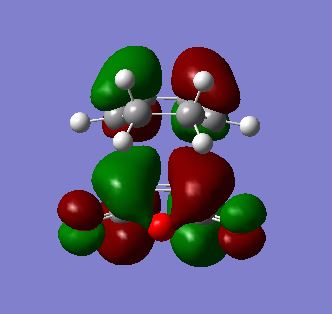 |
| LUMO+2 |  |
Comparison of endo and exo product
Geometrical Analysis
| Endo | 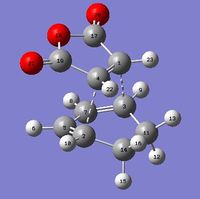
|
C4-C1/Å | C1-C3/Å | C3-C7/Å | C7-C5/Å | C5-C2/Å | C2-C4/Å |
| 1.41 | 2.16 | 1.39 | 1.40 | 1.39 | 2.16 | ||
| Exo | 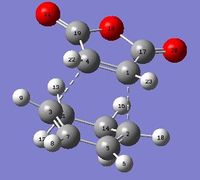
|
C1-C4/Å | C4-C3/Å | C3-C7/Å | C7-C5/Å | C5-C2/Å | C2-C1/Å |
| 1.41 | 2.17 | 1.39 | 1.40 | 1.40 | 2.17 |
Bond distances were measured (and rounded off to 2 decimal places to minimise errors in program) and it was observed that the distances between the atoms forming the new sigma bonds were shorter in the endo product than the exo product. This suggests that there is more significant steric repulsion between the side groups of the two fragments leading to the exo product than that present in endo product. Thus, this proves the steric explanation for the higher energy level of exo transition state as well as further preventing any secondary orbital overlap in the exo pathway. In each molecule, the distances between the atoms that are about to form new sigma bonds were observed to be around the same value, suggesting a synchronous fashion in bond formation. The rest of the bonds were found to exist between C-C and C=C bond lengths which suggest partial double bond character which is to be expected in transition states.
Activation Energy Comparison
| Semi-empirical/AM1 | |||
|---|---|---|---|
| Electronic energy | Sum of electronic and zero-point energies (0 K) | Sum of electronic and thermal energies (298.15 K) | |
| Maleic anhydride | -0.12182415 | -0.063349 | -0.058195 |
| Cyclohexa-1,3-diene | 0.02795792 | 0.152538 | 0.157033 |
| Endo TS | -0.05150480 | 0.133494 | 0.143683 |
| Exo TS | -0.05041981 | 0.134881 | 0.144882 |
Upon inspection of the transition states, it can be seen that the endo transition state is lower in energy and thus it will be the kinetically favoured pathway[8], as the activation energy is lower to form the endo product than the exo product. The exo transition state possesses a higher energy probably due to some steric hindrance but mainly due to electronic reasons - absence of stabilising secondary orbital overlap.
| Semi-empirical/AM1 | Semi-empirical/AM1 | |
| Activation Energy at 0 K | Activation Energy at 298.15 K | |
| ΔE (Endo) | 27.8015204 | 28.1403720 |
| ΔE (Exo) | 28.6718671 | 28.8927481 |
From the activation energies in kcal/mol, it is confirmed that the activation energy values leading to the endo product are lower than the values leading to the exo product, although the differences are not very significant. Perhaps running the reactions under a higher level of theory would elucidate more significant and quantifiable data, however this was not conducted due to insufficient time.
Conclusion
This computational experiment explored transition states for two classes of pericyclic reactions: Cope Rearrangement and Diels Alder Cycloaddition.
For the Cope Rearrangement, the molecule involved, 1,5-hexadiene, can exist in different conformers such as anti- and gauche- conformers. While it was thought that anti- conformation would possess a lower energy than gauche- conformation due to steric reasons, it was found that the gauche conformation was stabilised by electronic orbital overlap. The Cope Rearrangement was confirmed to proceed via a concerted mechanism, as the TS imaginary vibration frequency showed a synchronous vibration. This transition state was obtained via optimisation with TS Berny method (chair), freezing coordinates (chair) as well as QST2 (boat)/QST3(boat) and these optimisations were conducted at HF/3-21G as well as DFT/B3LYP/6-31G*. While the differences between the geometries were insignificant across levels of theory, the differences become apparent when energies of TS are considered. From the activation energies of the chair and boat conformations, it was concluded that the chair conformation has a lower activation energy and hence reaction proceeds through the chair conformation.
Diels Alder Cycloaddition was conducted with cis-butadiene and ethene which showed the concerted mechanism for the reaction. However, regioselectivity of the reaction could not be elucidated from that reaction, hence another Diels Alder between maleic anhydride and cyclohexa-1,3-diene was conducted to study the regioselectivity through MO, geometrical analysis and activation energies. The optimisations to yield TS were done via the TS Berny method using Semi-Empirical AM1 level of theory. This elucidated the fact that endo pathway is more favourable due to a lower activation energy and stabilising secondary orbital overlap; and larger steric repulsions in the exo transition state. A possible extension would be to run the optimisations using a higher level of theory such as Semi-empirical PM6 which has more parameters or DFT/B3LYP/6-31G* which takes into consideration electronic interactions to yield more accurate energy data.
This computational exercise managed to simulate cyclic transition states in the above reactions which would otherwise be experimentally impossible to do. These computational results could then be used to complement and explain empirical observations for such reactions.
References
- ↑ Musgrave. C. (2007) Comparison of DFT Methods for Molecular Orbital Eigenvalue Calculations J. Phys. Chem. A, 111 (8), pp 1554-1561 DOI:10.1021/jp061633o
- ↑ 2.0 2.1 2.2 Imperial College London, Computational Chemistry Wiki https://wiki.ch.ic.ac.uk/wiki/index.php?title=Mod:phys3#Appendix_1
- ↑ Gung, B., Zhu, Z. and Fouch, R. (1995). Conformational Study of 1,5-Hexadiene and 1,5-Diene-3,4-diols. J. Am. Chem. Soc., 117(6), pp.1783-1788. DOI:10.1021/ja00111a016
- ↑ H. Longuet-Higgins and E. Abrahamson (1965), J. Am. Chem. Soc., 87, 2045-2046. DOI: 10.1021/ja01087a033
- ↑ 5.0 5.1 Pauling, L. (1931). The Nature of the Chemical Bond. II. The One-Electron Bond and the Three-Electron Bond. J. Am. Chem. Soc., 53(9), pp.3225-3237. DOI:10.1021/ja01360a004
- ↑ Bondi, A. (1964). van der Waals Volumes and Radii. The Journal of Physical Chemistry, 68(3), pp.441-451. DOI:10.1021/j100785a001
- ↑ M. Fox, R. Cardona and N. Kiwiet (1987), The Journal of Organic Chemistry, 52, 1469-1474. DOI: 10.1021/jo00384a016
- ↑ J. Cooley and R. Williams (1997), J. Chem. Educ., 74, 582. DOI:10.1021/ed074p582


