Rep:Mod:Monty Hall is the root of all evil
This is an absolutely incredible page dedicated to the man who wasted a thousand PhD theses.
Computational chemistry has become an integral part in all areas of chemistry. In this study, computational methods from molecular mechanics to full quantum mechanics are used to calculate and predict experimental properties and shed light upon the nature of chemical bonding. The first part will focus mainly on molecular mechanics and how it can be used to calculate the relative stability of two isomers. It also employs quantum mechanics to simulate NMR-spectra of a large bicyclic molecule.
In the second part, the attention is turned to the jacobsen and shi epoxidation catalysts and the epoxides they form. NMR spectra, optical rotations and VCD spectra of two epoxides are simulated and the transition structures for the epoxide forming reaction are examined to predict enantiomeric excesses. The transitions structures are finally examined further in NCI and QTAIM analyses.
General background
Molecular mechanics
Molecular mechanics (MM) applies classical mechanics to yield a measure of comparing the relative stability of different molecules of conformations. It calculates an energy which is referred to as the steric energy. In calculating this, MM treats atoms as spheres or particles and uses classical potentials and experimental data. It does not do a quantum mechanical treatment of the molecule and hence, the absolute numbers do not have a meaning since the model used calculating them do not represent a real model of the molecule.[1]
The steric energy has 5 major contributions, 3 covalent and 2 non-covalent, but more parameters can be added if needed.
Stretching energy[1]
The stretching energy represents the deviation from the ideal bond length between two atoms. How it changes with distances is determined by a morse potential where the force constant determines how energetically costly it is to deviate from the ideal bond distance. The ideal bond distances referred to come from experimental data.
Bending energy[1]
The bending energy represents the deviation from the ideal bond angle between three atoms. This is again determined from morse potentials and the energy penalty for deviating from the ideal bond angle is represented by the force constant and differ between bond types. Eg, it is more energetically costly for a triple bond to deviate from its ideal angle (180o) than for a single bond between sp3 carbons (109o).
Torsional energy[1]
The torsional energy does not refer to an actual physical process, as the stretching or bonding energies do, but is a correction term to ensure a better agreement of the other covalent and non-covalent interactions and data from experiment or rigorous quantum calculations. This correction term is introduced by comparing the torsional angles of a quartet in your molecule (eg. C-C-C-C) with those of previously assigned data.
Van der Waals energy[1] This term represents the attractive and repulsive van der Waals interactions within a molecule. These depend on the interatomic distance and the size of their vdW radii. They can be modeled by the Lennard-Jones potential where the r-6 term represents attractive interactions and the r-12 term represents repulsive interactions. The potential used varies with the force field, with more later force fields such as MM4 using Hill potentials as opposed to Lennard-Jones potentials.
Electrostatic interactions[1]
Represents interatomic coulombic interactions which decay rapidly with distance.
Force fields
The contributions discussed in detail above come together in the steric energy equation:
E=Es+Eb+t+EvdW+Ec+...
The above equation includes all terms discussed above but also indicates that more terms can be and are often added to suit a certain type of calculation. In the equation above, each term has a mathematical expression associated to it. For example, an expression for the stretching energy is:
ki in the above equation is the force constant. Each term has its own force constant, each defined by the input experimental data that each molecular mechanics method has, and these force constants together make up a force field. In reality, each molecule has its own unique force field, but several force fields have been developed for more or less general purposes.
The MM1[2], MM2[3], MM3[4] and MM4[5] force fields were developed to give accurate predictions of the structure and properties of smaller molecules. Other force fields such as AMBER (for larger proteins[6] or, more recently, for lipids[7]) or MMFF94[8], which can be seen as a compromise between the MM3/MM4 and AMBER force fields, have also been developed. In this report, the MMFF94(s) force field will be used throughout. The "(s)" refers to "static", meaning that it has been optimised for static systems.
Quantum Mechanics and Basis Sets
Unlike molecular mechanics, a quantum mechanical treatment of molecules takes into account the quantum mechanical nature of atoms. Programs such as Gaussian can be used to calculate the time-independent wavefunction and energy of a molecule. This is done using methods such as Hartree-Fock. It was introduced to solve the Schrodinger equation approximately from first principles and involves solving the Slater determinants. In other words, the Hartree-Fock method initially used Slater-type atomic orbitals to create molecular orbitals using the linear combination of atomic orbitals. This was developed further in the 70's by Pople who introduced Gaussian type orbitals, giving rise to the name Gaussian. The Hartree-Fock method has since been improved and new methods have been developed, such as density functional theory (DFT) which lowers the computational cost of a simulation.
A basis set is a set of functions used to model the atomic orbitals in a molecule. These can then be combined in the LCAO-approach to form molecular orbitals. A minimal basis set has the lowest number of functions required to accommodate all electrons of a certain atom. I.e., larger basis sets are needed for larger atoms. Usually, several additional functions are used in addition to the minimal basis set as this provides a better model for the real orbitals. The two basis sets used in this project are 6-31G(d,p) and 6-311+G(2d,p). Both were developed by Pople and the latter adds several functions such as diffuse functions that increase accuracy further away from the nucleus.
Cycloaddition and hydrogenation
Introduction
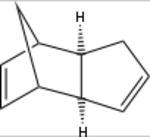
The Diels-Alder reaction has since its discovery in 1928 been a central strategy in carbon-carbon bond formation.[9] Benefiting from its good atom economy (100 %) and stereo- and regioselectivity it has become immensly popular among chemists. The reaction involves the coupling of one diene and a dienophile which in a concerted mechanism form a cyclic product.[10] One such reaction, the dimerisation of cyclopentadiene, is shown in scheme 1. It is stereospecific in that it is a syn-addition but it is at the same time stereoselective, giving a racemate of the endo and exo products. The exo-product is the most stable product, i.e. the thermodynamic product, whilst the endo-product is the kinetic product, i.e. the product that is fastest formed. Under room temperature conditions, the kinetic product is typically the dominant product but if prolonged heating is allowed, the thermodynamic product is finally obtained. The reason for the endo-product being the kinetic product can be rationalised using a stereoelectronic argument, with scheme 1 showing a geometry of the endo transition state which see favourable secondary orbital intereaction. The tendency to form the endo-product is often referred to as the Alder-endo rule.

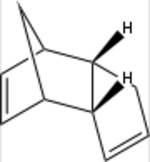
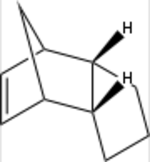
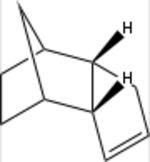
The product of the dimerisation of cyclopentadiene, dicyclopentadiene, contain two alkene double bonds. These can be hydrogenated with H2 over Pd/C to render the configurational isomers 3a and 3b (scheme 2).[11] If these are subjected to prolonged hydrogenation, the fully saturated tricycle 4 is formed. As with the Diels-Alder reaction, the initial hydrogenation shows a regioselective behaviour to form preferrably 3a over 3b. This is due to the release of strain the exists when a cyclic alkene is adjacent to bridging carbons.[11]

Both the Diels-Alder reaction and the hydrogenation reaction a well-established synthetic reactions. In this section a computational study will be presented to rationalise the selectivities observed experimentally and what structural features are responsible.
Results
The study focused on calculating the steric energy of the compounds using molecular mechanics. For this, the MMFF94s The results of these calculation are presented in table 1.
These results confirm that the endo-product 2b favoured by the Diels-Alder reaction is the kinetic product, being 3 kcal/mol less stable than the thermodynamic product2a. The main component contributing to the steric energy of both products is the angle bending energy, arising from having the bridge-head adjacent to the cyclic alkene. There is also a considerable contribution from repulsive VdW-forces. These arise from steric interactions between hydrogen-atoms that are locked in an unfavourable configuration by the cyclic structure. Finally, 3a sees a slightly higher electrostatic repulsion than 3b. This can be attributed to the less distant alkene bonds, which both are electron-rich and consequently sees stronger repulsive interactions.
Experimental data for the hydrogenation shows that it selectively hydrogenates 2a to give 3b.[12] This can be seen to be the thermodynamic product, being substantially more stable than its isomer 3a. The main reason for this is a substantial decrease in angle bending energy. This strain energy arise from having an alkene adjacent to the bridge-head which forces the sp2-carbons to take a 107.3 degree angle as compared to the preferred 120 degree angle. Furthermore, the removal of a double bond for obvious reasons also lowers the electrostatic repulsion.
Atropisomerism of Taxol
Introduction
The first example of a stable conformational isomer which had a large barrier to interconversion with its other isomer was discovered by Kenner et al. whilst investigating tetra-substituted biphenyl derivatives.[13] This phenomena, where there is a sufficiently large barrier to interconversion between two structurally identical isomers so that they can each be identified and separated, is known as atropisomerism. One example of atropisomerism is that encountered for the cycloctene molecule and another are the two conformers 5 & 6, a derivative from Taxol.

Another feature of the Taxol derivatives below is the bridgehead alkene. It was early discovered that olefins avoided ring-junctions in smaller rings but that in medium rings, bridgehead olefins were preferred.[14] These had remarkable stability and were difficult to hydrogenate. This has been related to a negative olefin strain energy[15] which leads to a low heat of hydrogenation, explaining the slow rate of hydrogenation of these olefins.
Results and Discussion
Before discussing the obtained results, a note on nomenclature is in place. The notation used in table 2 below uses two identifiers in each molecule of the Taxol derivative. The first word (eg. Up Chair Up) refers to the orientation of the carbonyl function relative to the plane of the macrocycle, where "up" is defined as being the same side of the plane as the bridging isopropyl-group. The second word (eg. Up Chair Up), refers to the conformation of the cyclohexane-ring. Finally, the last word (eg. Up Chair Up) refers to the position of the non-bridged, cyclohexane-carbon beta to the carbonyl function, with "up" being defined as above.
| Chair up | Chair down | Twist up | Twist down | |||||||||
|---|---|---|---|---|---|---|---|---|---|---|---|---|
| Structure | ||||||||||||
| Entry | Up Chair Up | Up Chair Down | Up Twist Up | Up Twist Down | ||||||||
| Total energy | 82.71823 kcal/mol | 70.54059 kcal/mol | 76.29541 kcal/mol | 77.92811 kcal/mol | ||||||||
| Structure | ||||||||||||
| Entry | Down Chair Up | Down Chair Down | Down Twist Up | Down Twist Down | ||||||||
| Total energy | 60.55024 kcal/mol | 74.73067 kcal/mol | 68.87402 kcal/mol | 66.28734 kcal/mol |
These results justify a few comparisons and conclusions. Firstly, the carbonyl-down conformations are in general the lowest energy conformations, with the down chair up conformation being significantly lower in energy than any other conformation. Comparing the entries in pairs, the down chair up conformation has a significantly lower angle bending energy than the up chair up conformation. This arise from unfavourable bond angles of the macrocycle which is restricted both by the carbonyl sp2 carbon and the bridging chair. Additionally, the down chair up conformation lacks unfavourable H-H vdW interactions (distance less than combined vdW radii of 2.1 A) seen in the up chair up conformation.
The second pair, up chair down and down chair down, are interesting in that the carbonyl-up conformation is lower in energy than the carbonyl-down conformation. Looking at the individual contributions to the steric energy, we find that up chair down has a greater angle bending energy but smaller torsional and van der Waal energies. As noted above, the torsional energy can in a sense be seen as a correction of how the stretching and bending terms deviate from quantum treatment. This rationalises that the up chair down conformation, which pays a price in terms of bending energy to obtain a comprise conformation, does not pay a price in terms of torsional energy.
Observing the third pair, Up twist up and Down twist up, these have similar energies and the contributions to these energies are all of similar quantities.
Finally, the fourth pair, Up twist down and Down twist down, exhibit a large discrepancy in energy. The reason for this is a substantial increase in bending energy for the high energy conformer.
Hyperstability
As noted above, bridgehead alkenes have been observed to have a high degree of stability. To evaluate this for the bicycle 6 above, the optimised down chair up structure was compared to its hydrogenated version (7) (table 4).

| Structure | ||||||
| Entry | 6 | 7 | ||||
| Total energy | 60.55024 kcal/mol | 66.96928 kcal/mol |
The hydrogenated bicycle 7 had a significantly higher steric energy as compared to its unsaturated relative 6. This difference, which occurs in the calculations from an increased torsional energy, is a demonstration of the negative olefin strain energy in these medium-cycle bridghead olefins. The unreactivity of olefin 6 is hence down to a low thermodynamic driving force for the reaction.
Spectroscopic simulation
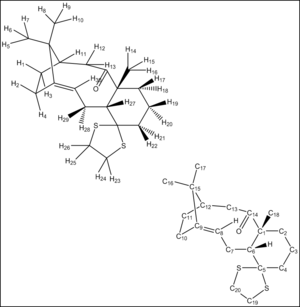
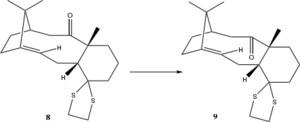
Two other derivatives(8 & 9) of Taxol, both being atropisomers of the same molecule, have previously been detailed by Paquette et al.[16] They can readily be interconverted by prolonged heating. The derivative 9 has in this study been investigated by means of molecular mechanics and a full quantum mechanical treatment to predict its spectroscopic properties.
Results and Discussion
Firstly, a conformational study was undertaken to identify the lowest energy conformation. Given that interconversion is possible between these conformers on a faster timescale than the NMR timescale, their relative abundance will result in an averaged spectrum with the lowest energy conformer having the largest contribution to the averaged spectrum. It turns out that unlike in the study performed in the last section, the conformer with carbonyl down and chair up is no longer the most stable conformation. This can be understood by observing the introduced methyl group on the bridging carbon. The position of the methyl group is locked by the ring system and if the molecule is to take the chair up conformation then substantial steric clashes will occur between the methyl group and the protons on the beta-carbon. Instead, the most stable conformation is the carbonyl down chair down, which effectively avoids these steric clashes. The results of the initial molecular mechanics investigation is presented in table 3.
| Chair up | Chair down | Twist up | Twist down | |||||||||
|---|---|---|---|---|---|---|---|---|---|---|---|---|
| Structure | ||||||||||||
| Entry | Down Chair Up | Down Chair Down | Down Twist Up | Down Twist Down | ||||||||
| Total energy | 101.13749 kcal/mol | 96.21648 kcal/mol | 102.01170 kcal/mol | 99.23374 kcal/mol |
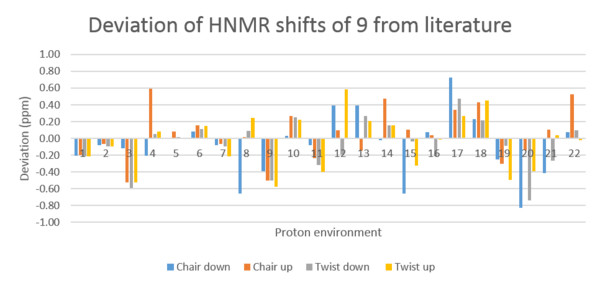
Having identified the relative stability of the conformers, H and C NMR spectrum were simulated using a quantum mechanical treatment at the B3LYP/6-311+G(2d,p) level of theory. This using density functional theory as a good compromise between accuracy and computing cost (see general background for more information). The results obtained are presented in tables 5 & 6 and a guide to the numbering of atoms in the molecule is shown in figure 1. The tables show the chemical shift values, as calculated, and compares then with the literature reference values. Then the differences in ppm between calculated and literature results are averaged and an overall deviation is presented for each conformation. The chemical shifts reported for the three methyl groups have been averaged from the three different contribution of the protons in each methyl group. Finally, it has to be noted that the assignments given above depends solely on the calculated data. For most of the chemical shifts, apart from the alkene protons, alkene carbons and carbonyl carbons, the assignments carry a large portion of uncertainty and it is impossible to make an unambiguous assignment based on the available data. Hence, the analysis below will focus on the chemical shifts which are less ambiguous.
| Raw Data | Deviation (ppm) relative to reference | ||||||||||
| Chair up | Chair down | Twist down | Twist Up | ||||||||
| Atom(s) | Chemical Shift (ppm) | Atom(s) | Chemical Shift (ppm) | Atom(s) | Chemical Shift (ppm) | Atom(s) | Chemical Shift (ppm) | Chair down | Chair up | Twist down | Twist up |
| 1 | 1.75 | 1 | 1.74 | 1 | 1.73 | 1 | 1.74 | -0.21 | -0.20 | -0.22 | -0.21 |
| 2 | 1.89 | 2 | 1.87 | 2 | 1.85 | 2 | 1.86 | -0.08 | -0.06 | -0.10 | -0.09 |
| 3 | 2.32 | 3 | 2.73 | 3 | 2.26 | 3 | 2.33 | -0.12 | -0.53 | -0.59 | -0.52 |
| 4 | 2.54 | 4 | 1.74 | 4 | 2.00 | 4 | 2.03 | -0.21 | 0.59 | 0.05 | 0.08 |
| 5,6,7 | 1.15 | 5,6,7 | 1.07 | 5,6,7 | 1.08 | 5,6,7 | 1.07 | 0.00 | 0.08 | 0.01 | 0.00 |
| 8,9,10 | 1.18 | 8,9,10 | 1.11 | 8,9,10 | 1.14 | 8,9,10 | 1.18 | 0.08 | 0.15 | 0.11 | 0.15 |
| 11 | 1.89 | 11 | 1.87 | 11 | 1.85 | 11 | 1.74 | -0.08 | -0.06 | -0.10 | -0.21 |
| 12 | 2.54 | 12 | 1.87 | 12 | 2.61 | 12 | 2.77 | -0.66 | 0.02 | 0.09 | 0.24 |
| 13 | 1.45 | 13 | 1.56 | 13 | 1.45 | 13 | 1.37 | -0.39 | -0.50 | -0.50 | -0.58 |
| 14,15,16 | 1.37 | 14,15,16 | 1.13 | 14,15,16 | 1.35 | 14,15,16 | 1.33 | 0.03 | 0.27 | 0.25 | 0.23 |
| 17 | 1.11 | 17 | 1.27 | 17 | 1.03 | 17 | 0.95 | -0.08 | -0.24 | -0.32 | -0.40 |
| 18 | 1.45 | 18 | 1.74 | 18 | 1.16 | 18 | 1.93 | 0.39 | 0.10 | -0.19 | 0.58 |
| 19 | 1.20 | 19 | 1.74 | 19 | 1.61 | 19 | 1.56 | 0.39 | -0.15 | 0.26 | 0.21 |
| 20 | 2.06 | 20 | 1.56 | 20 | 1.73 | 20 | 1.74 | -0.02 | 0.48 | 0.15 | 0.16 |
| 21 | 2.63 | 21 | 1.87 | 21 | 2.49 | 21 | 2.20 | -0.66 | 0.11 | -0.03 | -0.33 |
| 22 | 1.99 | 22 | 2.02 | 22 | 1.73 | 22 | 1.93 | 0.07 | 0.04 | -0.22 | -0.02 |
| 23 | 3.19 | 23,24 | 3.58 | 23,24 | 3.32 | 23,24 | 3.12 | 0.73 | 0.34 | 0.47 | 0.27 |
| 24 | 3.19 | 23,24 | 3.58 | 23,24 | 3.32 | 23,24 | 3.12 | 0.73 | 0.34 | 0.47 | 0.27 |
| 25 | 3.28 | 25,26 | 3.08 | 25,26 | 3.06 | 25,26 | 3.30 | 0.23 | 0.43 | 0.21 | 0.45 |
| 26 | 3.28 | 25,26 | 3.08 | 25,26 | 3.06 | 25,26 | 3.30 | 0.23 | 0.43 | 0.21 | 0.45 |
| 27 | 2.22 | 27 | 2.27 | 27 | 2.44 | 27 | 2.03 | -0.25 | -0.30 | -0.09 | -0.49 |
| 28 | 2.71 | 28 | 2.02 | 28 | 2.11 | 28 | 2.46 | -0.83 | -0.14 | -0.74 | -0.39 |
| 29 | 2.63 | 29 | 2.12 | 29 | 2.26 | 29 | 2.56 | -0.41 | 0.11 | -0.26 | 0.04 |
| 30 | 5.74 | 30 | 5.28 | 30 | 5.31 | 30 | 5.19 | 0.07 | 0.53 | 0.10 | -0.02 |
| Average deviation | -0.09 | 0.05 | -0.07 | -0.04 | |||||||
| Steric energy | 96.22 | 101.14 | 99.23 | 102.01 | |||||||
| Raw Data | Deviation (ppm) relative to reference | ||||||||||
| Chair up | Chair down | Twist up | Twist down | ||||||||
| Atom | Chemical Shift (ppm) | Atom | Chemical Shift (ppm) | Atom | Chemical Shift (ppm) | Atom | Chemical Shift (ppm) | Chair up | Chair down | Twist up | Twist down |
| 1 | 54.03 | 1 | 61.90 | 1 | 57.06 | 1 | 58.39 | 2.73 | 10.60 | 5.76 | 7.09 |
| 2 | 43.58 | 2 | 31.75 | 2 | 36.72 | 2 | 36.97 | 8.11 | -3.72 | 1.25 | 1.50 |
| 3 | 21.57 | 3 | 22.71 | 3 | 21.96 | 3 | 21.16 | 1.74 | 2.88 | 2.13 | 1.33 |
| 4 | 50.92 | 4 | 44.52 | 4 | 37.13 | 4 | 41.98 | 12.19 | 5.79 | -1.60 | 3.25 |
| 5 | 97.03 | 5 | 95.25 | 5 | 93.67 | 5 | 91.80 | 22.42 | 20.64 | 19.06 | 17.19 |
| 6 | 61.96 | 6 | 67.25 | 6 | 67.63 | 6 | 70.21 | 1.43 | 6.72 | 7.10 | 9.68 |
| 7 | 34.00 | 7 | 37.61 | 7 | 34.69 | 7 | 32.41 | 3.16 | 6.77 | 3.85 | 1.57 |
| 8 | 128.37 | 8 | 130.69 | 8 | 128.15 | 8 | 126.53 | 7.47 | 9.79 | 7.25 | 5.63 |
| 9 | 158.35 | 9 | 153.98 | 9 | 159.75 | 9 | 159.82 | 9.63 | 5.26 | 11.03 | 11.10 |
| 10 | 28.27 | 10 | 28.50 | 10 | 28.39 | 10 | 28.76 | 2.71 | 2.94 | 2.83 | 3.20 |
| 11 | 24.43 | 11 | 23.58 | 11 | 24.30 | 11 | 24.45 | 2.22 | 1.37 | 2.09 | 2.24 |
| 12 | 58.34 | 12 | 56.06 | 12 | 58.74 | 12 | 57.57 | 7.40 | 5.12 | 7.80 | 6.63 |
| 13 | 38.70 | 13 | 37.21 | 13 | 24.30 | 13 | 39.07 | 1.92 | 0.43 | -12.48 | 2.29 |
| 14 | 224.78 | 14 | 225.08 | 14 | 222.74 | 14 | 224.62 | 13.29 | 13.59 | 11.25 | 13.13 |
| 15 | 54.03 | 15 | 54.35 | 15 | 53.08 | 15 | 52.06 | 8.50 | 8.82 | 7.55 | 6.53 |
| 16 | 27.52 | 16 | 25.36 | 16 | 26.60 | 16 | 26.00 | 2.17 | 0.01 | 1.25 | 0.65 |
| 17 | 21.42 | 17 | 22.05 | 17 | 21.68 | 17 | 22.30 | 0.03 | 0.66 | 0.29 | 0.91 |
| 18 | 31.71 | 18 | 25.36 | 18 | 31.99 | 18 | 28.53 | 1.71 | -4.64 | 1.99 | -1.47 |
| 19 | 44.14 | 19 | 50.19 | 19 | 48.61 | 19 | 47.74 | 3.32 | 9.37 | 7.79 | 6.92 |
| 20 | 50.42 | 20 | 41.76 | 20 | 44.13 | 20 | 49.91 | 7.14 | -1.52 | 0.85 | 6.63 |
| Average deviation | 5.96 | 5.04 | 5.30 | 4.35 | |||||||
| Steric energy | 101.14 | 96.22 | 102.01 | 99.23 | |||||||
The data presented in tables 5 & 6 exhibit some interesting patterns. The average deviations for the HNMR simulations are far better (<0.1 ppm) than those for CNMR (5-6 ppm). This however arise from some HNMR shifts being lower and some being higher than those cited in literature. Hence, the average of the absolute deviation is a better representation of the deviation of the HNMR simulation. This gives a deviation which is far greater (0.25-0.27 ppm) than that shown in table 5. In other words, the deviation is large.
For that reason, it is only sensible to analyse the chemical shifts that are clearly differentiated. Such a shift is that of the olefin proton (30). It would be expected that the most accurate simulation would be that of the lowest energy conformation since this will have the greatest contribution to the chemical shift by its higher abundance. This is however not seen for the olefinic proton, for which the most accurate simulation is that for the twist up conformer. The twist up conformer is also the overall most accurate simulation, with a deviation of -0.04 ppm. This is unexpected since the twist up conformer is the highest energy conformation. The other calculated HNMR shifts are too close in chemical shift to be unambiguously assigned and hence they cannot be discussed in detail in any useful manner.
Table 6 contains the values for the simulated CNMR spectra. As mentioned above, these show a greater deviation from literature in absolute terms. Again, best agreement is seen for the highest energy conformer. The CNMR contains 3 clearly differentiated carbons: 8, 9 and 14. These see somewhat different trends, with the best agreement being seen with twist down, chair down and twist up respectively. However, they all show a far greater deviation from literature than the average deviation, in terms of absolute ppm numbers.
At this point it is important to make a note on the reliability of these data. Firstly, the way that the literature data has been reported, it is impossible to assign any of the carbon and almost none of the proton nmr peaks. These has hence been fitted to the data calculated with the exception of the clearly distinguished peaks discussed above.
Furthermore, there are numerous aspects of the calculations that could generate incorrect simulations. Firstly, the solvent field used only applies a general field based mainly on the dielectric constant of the solvent; the simulation is still a gas phase simulation with a solvent correction term. This does not allow for specific interactions between eg. lone pairs of the oxygen or sulfur atoms and the C-H units on the benzene molecules. It does not take into account the temperature dependence of NMR values and neither does it take into account pressure effects. Consequently, these results lack the reliability required for an unambiguous assignment.
The unprocessed raw data for the above NMR simulations can be found below: Chair up: DOI:10042/195176 Chair down: DOI:10042/195177 Twist up: DOI:10042/195174 Twist down: DOI:10042/195175
Shi and Jacobsen catalysts
Structure of Shi and Jacobsen catalysts
| Jacobsen | Shi | |||||
|---|---|---|---|---|---|---|
| Structure | ||||||
| Entry | 10 | 11 |

Jacobsen
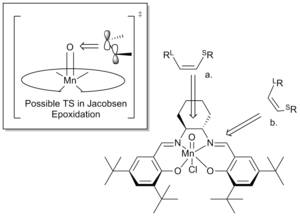
The unit cell consists of two almost symmetric molecules of the salen-complex 10, interacting via vdW interactions.[17] The two salicylideneimine moieties are held together by a cyclohexayl group in the chair conformation. The central Mn is pentacoordinated and takes a square-pyramidal geometry which is slightly distorted. Unlike other salen-complexes, the two planar benzene rings do not lie in one plane but instead, the molecule takes up an overall bent structure.[17] The bend is different for the two molecules in the unit cell, one exhibiting a bend between the two aromatic rings of 10o and the other a bend of 27o. Another key feature of the Jacobsen catalyst are the tert-butyl substituents on the aromatic rings ortho to the hydroxyl substituents. These efficiently close the approach from the "open"-end of the catalyst, forcing substrates to approach from the openings between the cyclohexyl group and the tert-butyl group para to the hydroxyl substituent. This realisation has lead Jacobsen[18] and Katsuki[19] to suggest two directions of approach for a substrate undergoing epoxidation. These are presented in figure 1.
Shi
The structure of the shi-catalyst shows some interesting features.[20] In particular, there is range of different C-O bondlengths and these are shown in table 9. There is a notable difference between the C-O bond lengths from the C8 carbon as compared to the other carbons. Its C-O bond lengths are shorter than the other C-O bonds due to the anomeric effect (scheme 7). The anti periplanar relationship between the lone pair on the oxygen and the C-O bond as shown in scheme 7 gives both C-O bonds partial double bond character, accounting for the shorter bond lengths.
Another intersting feature is the distorted chair conformation of the 6-membered ring. This arise from the sp2 nature of the carbonyl carbon, which despite destorting the ring is strained with a bond angle of 115o instead of 120o. This contributes to rigidify the catalyst, avoiding potential ring-flipping that could cause ambiguousness in the catalysis mode.
| Bond | Bond length |
|---|---|
| C14-O4 | 1.43 A |
| C14-O5 | 1.43 A |
| C08-O2 | 1.42 A |
| C08-O4 | 1.43 A |
| C12-O1 | 1.44 A |
| C12-O3 | 1.44 A |

NMR of epoxides
Dihydronaphtalene
| Bond | Bond length | ||||||||||||||||||||||||||||||||||||||||||||||||||||||||||||||||||||||||||||||||||||||||||||||||||||||||||||||||||||||||||||||||||||||||||||||||||||||||||||
|---|---|---|---|---|---|---|---|---|---|---|---|---|---|---|---|---|---|---|---|---|---|---|---|---|---|---|---|---|---|---|---|---|---|---|---|---|---|---|---|---|---|---|---|---|---|---|---|---|---|---|---|---|---|---|---|---|---|---|---|---|---|---|---|---|---|---|---|---|---|---|---|---|---|---|---|---|---|---|---|---|---|---|---|---|---|---|---|---|---|---|---|---|---|---|---|---|---|---|---|---|---|---|---|---|---|---|---|---|---|---|---|---|---|---|---|---|---|---|---|---|---|---|---|---|---|---|---|---|---|---|---|---|---|---|---|---|---|---|---|---|---|---|---|---|---|---|---|---|---|---|---|---|---|---|---|---|---|
|
|||||||||||||||||||||||||||||||||||||||||||||||||||||||||||||||||||||||||||||||||||||||||||||||||||||||||||||||||||||||||||||||||||||||||||||||||||||||||||||
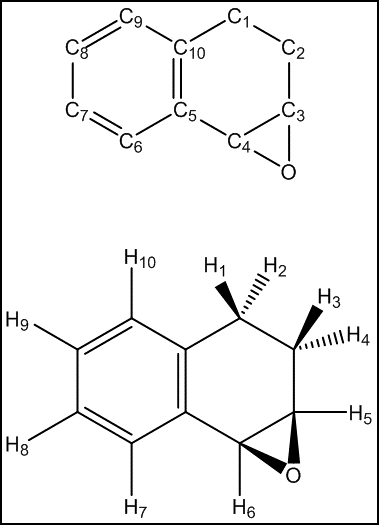
Observing the calculated HNMR values for dihydronaphtalene oxide and comparing them with both experimental results and literature reference, an anomaly can be observed. It would be expected that the proximity of the H7 proton to the epoxide function would deshield this proton further. However, the opposite result is observed in the calculations above and H10 is calculated to have the highest chemical shift, followed by H9 and H8. This yet again highlights the difficulties of exact assignment of non-distinct protons. Hence, the value of the simulation is not in the exact assignment but in the good average agreement of the distinct chemical shift regions, i.e. the average values for H7-H10, H5-H6 and H1-H4 are in very good agreement with literature. The simulation is hence able to successfully indicate the existence of three distinct regions but is unable to distinguish between protons within a region.
The CNMR shifts for dihydronaphtalene oxide are generally overestimated, with an average deviation of 4.46 ppm. As with the HNMR simulation, the value of the CNMR simulation is not the exact assignment of each carbon but the identification of three distinct regions: C1-C2,C3-C4 and C5-C12.
The NMR spectrum was simulated using a b3lyp/6-311+g(2d,p) basis set in a chloroform solvent field. The raw data can be obtained here: DOI:10042/195187
Trans-stilbene oxide
| NMR data |
|
|||||||||||||||||||||||||||||||||||||||||||||||||||||||||||||||||||||||||||||||
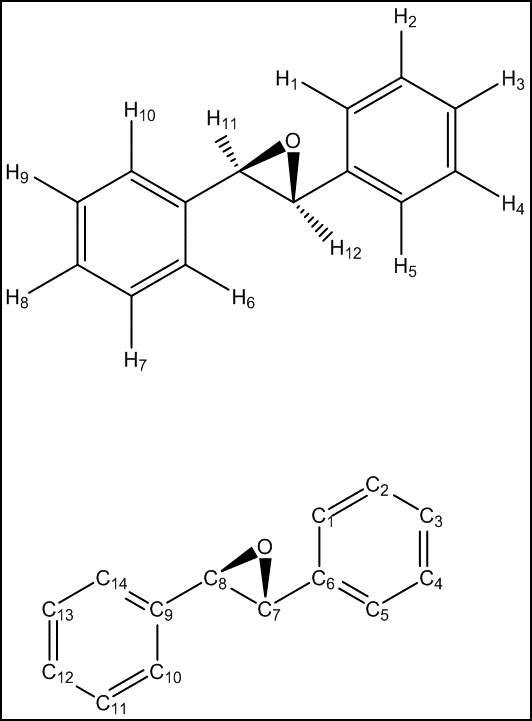
Trans-stilbene oxide contains two distinct proton environments, one being the aromatic systems and the other being the two epoxide protons. Above is reported the average shift obtained for the ortho, meta and para regions respectively but it has to be noted that the indivudal contributions to these averages exhibited a large spread and it would have been impossible to specifically assign each individual proton. Consequently, the valididty of the ortho, meta and para assignments is somewhat unsatisfactory. However, on average, the shifts calculated within each of the two general environments are good with a low deviation.
The CNMR sees the same features as did the dihydronaphtalene CNMR, with a general overestimation of the chemical shifts, a difficulty in assigning each carbon specifically but a readily assignment into the aromatic or the non-aromatic (epoxide) general environment.
A final note on the NMR simulations for both trans-stilbene oxide and dihydronaphtalene oxide. The simulations are made using a chloroform solvent field. Chloroform is electrophilic and weak interactions such as lone pair complexation to chloroform are hence not improbable. However, such molecular interactions are not included in the solvent model, neither are temperature or pressure effects. All of these affect the final result.
The NMR spectrum was simulated using a b3lyp/6-311+g(2d,p) basis set in a chloroform solvent field. The raw data can be obtained here: DOI:10042/195186
Optical rotations
NMR cannot differentiate between two enantiomers. Hence, the simulation of NMR spectra above does not unambiguously identify the synthesized epoxides, it only ensures the structural integrity. The classical way of determining the optical purity of a sample, in effect the ratio of two enantiomers, is by optical rotation. The optical rotation obtained can be divided by the optical rotation of an enantiomerically pure sample to give the optical purity. The optical purity is equal to the enantiomeric excess.
Below, optical rotations for the dihydronaphtalene and trans-stilbene oxides have been calculated and are compared to reference data. These are in general good agreement with literature, both in terms of absolute value and sign. This indicates that for simple molecules such as those examined here, quantum calculations can be used with reasonable accuracy to identify absolute stereochemistry of a synthesised compounds by comparing its optical rotation to the calculated values.
| Optical rotation | ||||
| Dihydronaphtalene oxide | R,S (589 nm) | R,S (365 nm) | S,R (589 nm) | S,R (365 nm) |
| Optical rotation ref.[23] | -138.8 | 135.3 | ||
| Optical rotation calc. | -156.25 | -518.82 | 183.06 | 633.5 |
| Trans-stilbene oxide | R,R (589 nm) | R,R (365 nm) | S,S (589 nm) | S,S (365 nm) |
| Optical rotation ref.[23] | 356.1 | -358.1 | ||
| Optical rotation calc. | 324.01 | 1345.51 | -324.19 | -1346.36 |
Raw data: Dihydro (S,R):DOI:10042/195191 Dihydro (R,S):DOI:10042/195188 Trans-stilbene (R,R):DOI:10042/195190 Trans-stilbene (S,S):DOI:10042/195189
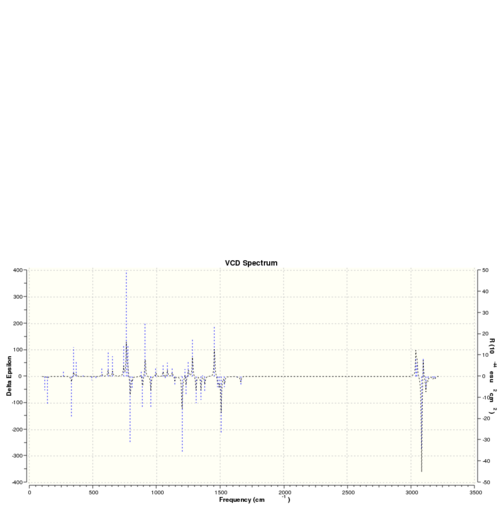
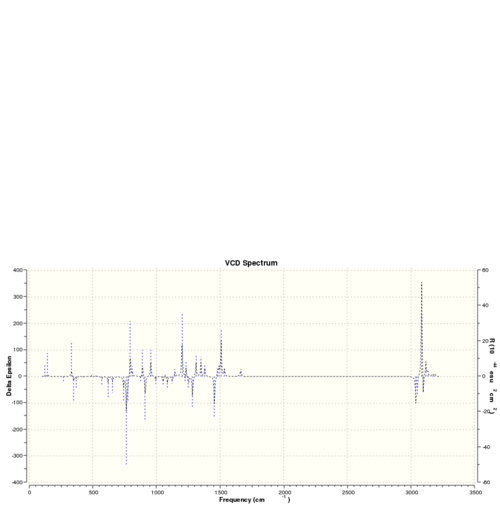
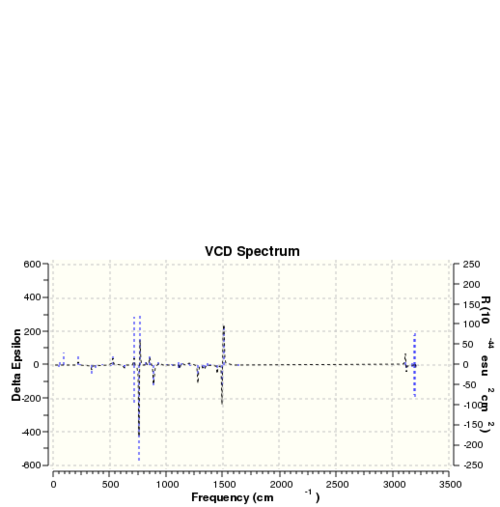
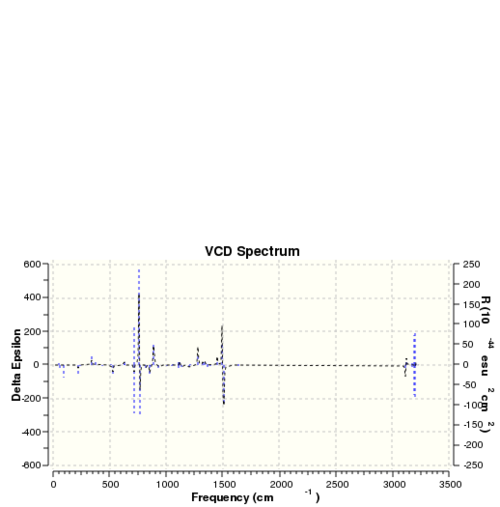
The optichiral properties of a sample can also be be obtained by observing its interactions with polarised light.[24] This generates so called VCD spectra and the VCD spectra for the isomers discussed above are presented below. These are equal an inversed for two different enantiomers of the same molecule.
| VCD spectra | |||
| Dihydronaphtalene (R,S) | Dihydronaphtalene (S,R) | Trans-stilbene (R,R) | Trans-stilbene (S,S) |
 |
 |
 |} |} |
|
Transition states
The equality between optical purity and enantiomeric excess does not always hold, in fact it only holds for a perfect racemate or a perfectly enantiomerically pure sample.[25] This deviation from linearity is reffered to as the Horeau effect. Furthermore, the result from optical rotations can be perturbed by temperature and concentration changes and even by non-chiral additives. Consequently, optical rotation is not a flawless way of determining the purity of a sample and other methods such as chiral columns and even NMR methods are now used to assign absolute stereochemistry.[25]
Quantum mechanical calculations have lately emerged as a way of predicting the stereochemical outcome of chemical reactions by comparing the energy of the transitions states for the different potential stereochemical outcomes.[26] Below, a thorough study of the transition states of both the trans-stilbene and dihydronaphtalene oxides is undertaken to complement the optical rotation study undertaken above. The study also extends to an analysis of the non-covalent interactions (NCI) present in the transition structure, something that can give further clues on the stereochemical outcome of the reaction.
| Transition state energy | ||
| Shi | Jacobsen | |
| Stilbene-(R,R) | -1534.687808 | -3574.921174 |
| -1534.687252 | ||
| -1534.700037 | ||
| -1534.699901 | ||
| Stilbene-(S,S) | -1534.693818 | -3574.923087 |
| -1534.685089 | ||
| -1534.683440 | ||
| -1534.691858 | ||
| Dihydro-(R,S) | -1381.120782 | -3421.359354 |
| -1381.125886 | -3421.359499 | |
| -1381.134059 | ||
| -1381.126722 | ||
| Dihydro-(S,R) | -1381.131343 | -3421.369033 |
| -1381.116109 | -3421.361580 | |
| -1381.126039 | ||
| -1381.136239 |
| Catalyst | Shi | Jacobsen |
| Stilbene (R,R) (kJ/mol) | -4029263 | -9385742 |
| Stilbene (S,S) (kJ/mol) | -4029247 | -9385747 |
| Energy difference (kJ/mol) | 16.33 | 5.02 |
| Equilibrium constant | 0.001374314 | 0.131722153 |
| Enantiomeric excess | -99.7% | 76.7% |
| Dihydronaphtalene (R,S) (kJ/mol) | -3626085 | -8982575 |
| Dihydronaphtalene (S,R) (kJ/mol) | -3626091 | -8982600 |
| Energy difference (kJ/mol) | 5.72 | 25.03 |
| Equilibrium constant | 0.099263232 | 4.09789E-05 |
| Enantiomeric excess | 81.9% | 100.0% |
| Jacobsen | Shi | |
|---|---|---|
| (R,R)-trans-stilbene |  |

|
| (S,S)-trans-stilbene | 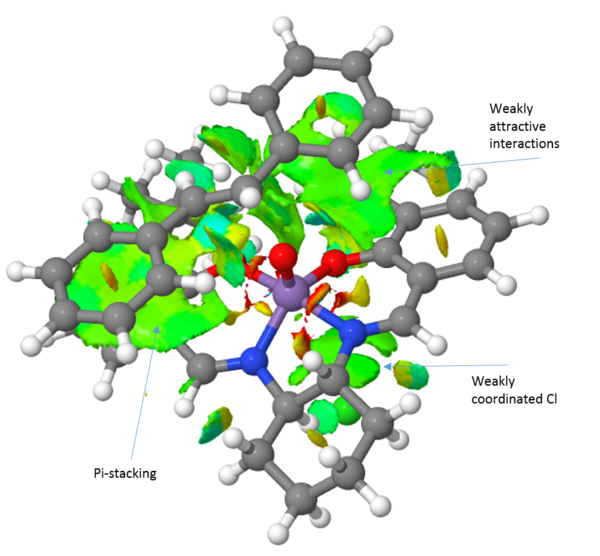 |
|
| (R,S)-dihydronaphtalene |  |
|
| (S,R)-dihydronaphtalene | 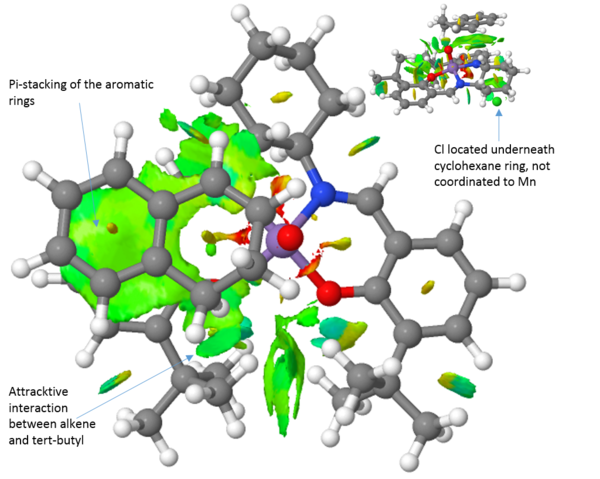 |

|
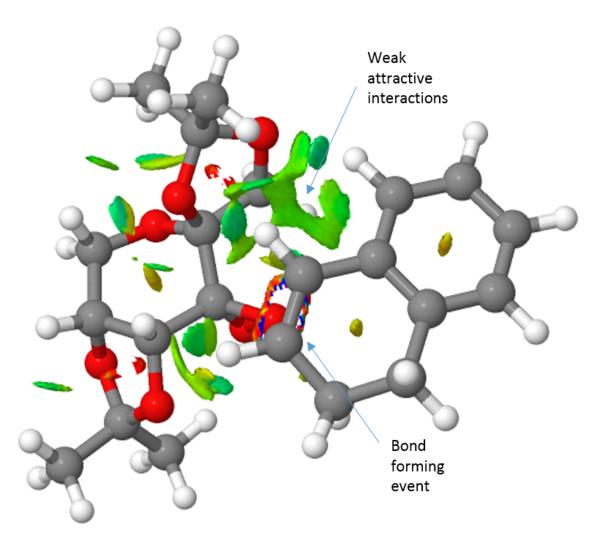
The calculated ee values for the two substrates and catalysts are presented in table 15 above. These have been calculated from the lowest energy transition structure obtained. However, there are a number of possible transition structures which are similar in energy, the energies of which are presented in table 14. The difference in energy between the transition states of two stereoisomers can be used in equaiton 1 to calculate the enantiomeric excess.[26]
An NCI analysis of each transition state is presented above (Table 16). Observing the transition structure for the trans-stilbene olefin, there are a few striking differences between the Jacobsen and Shi catalysts. Firstly, the trans-stilbene see large attractive pi-stacking interactions with the aromatic rings of the Jacobsen catalyst. Further favourable "sticky" interactions are seen between the alkene aromatic rings and the tert-butyl groups of the catalyst. The tert-butyl-groups also show favourable interactions with each other. These multible interactions serve to guide the substrate into the right position. Furthermore, it has been argued that a steric model, with respect to the axial cyclohexane moiety, for the Jacobsen epoxidation can explain the obtained selectivity. However, this axial proton actually see favourable interactions with the substrate.
Comparing the transition structures of both the R,R and the S,S substrates with the Jacobsen catalyst, these are qualitatively very similar. The key thing to realise here is that because the interactions are so similar, there is no strong preference for either the R,R or the S,S substrate. This is in agreement with the energies calculated and presented in table 14, yielding a 76 % ee in favour of the S,S epoxide. When we compare the Jacobsen and Shi catalysts' abilities to convert trans-stilbene however it is evident that the Shi catalyst, which much more readily can accommodate the bulk of the trans-stilbene molecule, will be the superior catalyst choice. Furthermore, the Shi catalyst see a greater difference in the interactions between the R,R and S,S substrates. This leads to a greater selectivity which is also observed with the R,R isomer of trans-stilbene being produced in 99.7 %. This indicates that the Shi catalyst should be employed to epoxidise trans-alkenes, in agreement with literature.[27]
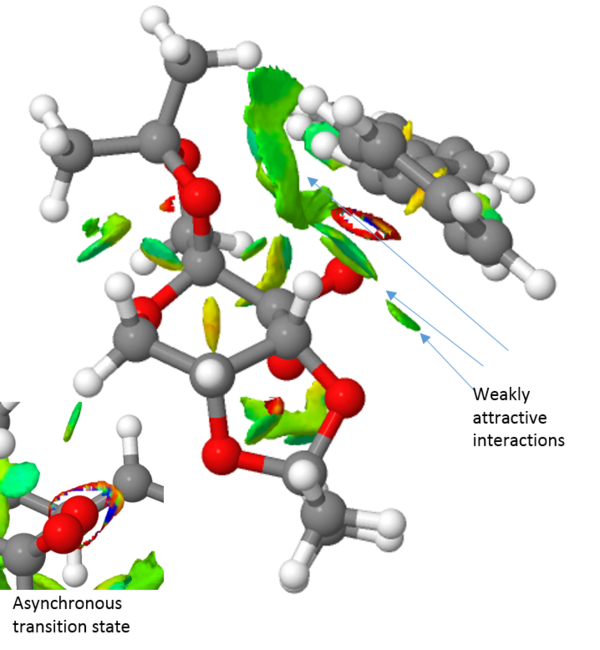
Turning the attention to the epoxidation of dihydronaphtalene, it can clearly be seen that the jacobsen catalyst can much more readily accommodate this substrate than the trans-stilbene. A large weakly attractive interaction between the aromatic systems of the substrate and the salen ligand is observed and the substrate can easily approach through either the Jacobsen or the Katsuki approach presented earlier. It can also be seen that the (S,R)-1,2-dihydronaphtalene see a more of the weakly attractive interactions than does the (R,S)-1,2-dihydronaphtalene. This is reflected in an almost complete selectivity when using the jacobsen catalyst, yielding an ee of 100 % in favour of the (S,R)-isomer. Extending the comparison to include the shi-catalyst, it can readily be seen that it exhibits far fewer attractive interactions than the Jacobsen catalyst. This results in a lower enantiomeric excess of 81.9 %.
QTAIM analysis
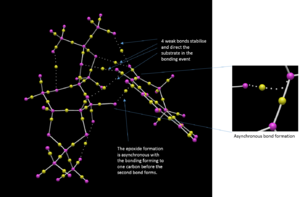
Finally, the transition structure for the interaction between the Shi catalyst and the (S,R)-1,2-dihydronaphtalene was subjected to an QTAIM analysis. This is complementary to the NCI analysis but focus not only on the weak interactions but also on the stronger interactions. It has also been an attempt to define the prescence of a chemical bond or not in terms of the fundamental property of electron density.[28]. By observing the electron density plot of a molecules, atoms and bonds can be defined unambiguously as maxima and saddle points respectively. One such plot of the Shi-catalyst and the (S,R)-1,2-dihydronaphtalene molecule is shown in figure 2 below. This identifies two interesting properties. Firstly, it identifies four bonding interactions that guides the substrate in the right position. The first two are between the alkene protons and two oxygen atoms of the catalyst, i.e. two hydrogen bonding interactions. The other two are van der Waals interactions between the alkene protons and two C-H protons of the catalyst. Secondly, the QTAIM analysis indicates something initially shown by the NCI analysis namely the asynchronous bond formation. This is shown by the bond being between the oxygen and one carbon. However, a flavor of synchronicity is seen by the curved nature of the "bond" (figure XX).
Conclusions
This study has spanned the computational chemistry spectrum both in terms of the methods used and purposes they have been applied to. Molecular modelling was employed to determine that the favoured endo product in the Diels_alder reaction is indeed the kinetic product. It was then used to rationalise the selectivity seen in hydrogenation of dicyclopentadienes.
Subsequently, MM was employed to establish the most stable conformer of a Taxol derivative. These results were then used to discuss NMR simulations of that derivative and also to rationalise the hyperstability of the bridgehead alkene encountered.
Furthermore, the NMR spectra of two asymmetric epoxidation products of the Shi and Jacobsen catalysts were simulated, their optical rotations calculated and their transition state structures investigated using NCI and QTAIM analysis.
References
- ↑ 1.0 1.1 1.2 1.3 1.4 1.5 D. B. Boyd, K. B. Lipkowitz J. Chem. Educ. 1982, 59 (4), 269
- ↑ N. L. Allinger, M. A. Miller, and D. H. Wertz J. Am. Chem. Soc. 1971, 93, 1637
- ↑ N. L. Allinger J. Am. Chem. Soc. 1977, 99, 3279
- ↑ N. L. Allinger, Y. H. Yuh, and J. H. Lii J. Am. Chem. Soc. 1989, 111, 8551
- ↑ N. L. Allinger, K. Chen, and J. H. Lii J. Comput. Chem. 1996, 14, 642
- ↑ S. J. Weiner, P. A. Kollman, D. A. Case, U. C. Singh, C. Chio, G. Alagona, S. Profeta, P. Weiner J. Am. Chem. Soc. 1984, 106
- ↑ C. J. Dickson, B. D. Madej, Å. A. Skjevik, R. M. Betz, K. Teigen, I. R. Gould, R. C. Walker J. Chem. Theory Comput. 2014, 10 (2), 865-879
- ↑ T. A. Halgren J. Comput. Chem. 1996, 14, 490
- ↑ O. Diels, K. Alder, Liebigs Ann., 1928, 460 (1), 98–122
- ↑ K. C. Nicolaou, S. A. Snyder, T. Montagnon, G. Vassilikogiannakis Angew. Chem. Int. Ed., 2002, 41 (10), 1668-1698
- ↑ 11.0 11.1 A. behr, V. Manz, A. Lux, A. Ernst Catal. Lett., 2012, 143(3), 241-245
- ↑ D. Skála & J. Hanika Petroleum and Coal, 45, 3-4, 2003
- ↑ G. H. Christie, J. Kenner J. Chem. Soc., Perkin Trans. 1. 1922, 121, 614–620
- ↑ W. F. Maier and P. v. R. Schleyer J. Am. Chem. Soc. 1981, 103 (8), 1891-1900
- ↑ A. B. McEwen, P. v. R. Schleyer J. Am. Chem. Soc. 1986 108 (14), 3951-3960
- ↑ L. Paquette, N. A. Pegg, D. Toops, G. D. Maynard, R. D. Rogers, J. Am. Chem. Soc., 1990, 112, 277-283.
- ↑ 17.0 17.1 J. W. Yoon, T. Yoon, S. W. Lee, W. Shin Acta Crystallogr., Sect. C: Cryst. Struct. Commun. 1999, 55, 1766-1769.
- ↑ T. Linker Angew. Chemie Int. Ed. English, 1997, 36, 1718-1719
- ↑ T. Katsuki J. Mol. Catal. A Chem., 1996, 113, 87-107
- ↑ National Center for Biotechnology Information. PubChem Compound Database; CID=18422-53-2, https://pubchem.ncbi.nlm.nih.gov/compound/7275400#section=Top (accessed Feb. 22, 2011).
- ↑ 21.0 21.1 W. Dai, S. Shang, B. Chen, G. Li, L. Wang, L. Ren, and S. Gao J. Org. Chem. 2014, 79 (14), 6688-6694.
- ↑ 22.0 22.1 T. Chishiro, Y Kon, T. Nakashima, M. Goto, K. Sato Adv. Synth. Catal 2014, 356(2-3), 623–627.
- ↑ 23.0 23.1 Z. Wang,Y. Tu,M. Frohn,J. Zhang and Y. Shi J. Am. Chem. Soc. 1997, 119 (46), 11224-11235. DOI: 10.1021/ja972272g
- ↑ P. J. Stephens J. Phys. Chem. 1985, 89, 748-752
- ↑ 25.0 25.1 R. E. Gawley J. Org. Chem. 2006, 71, 2411-2416
- ↑ 26.0 26.1 S. T. Schneebeli, M. L. Hall, R. Breslow, R. Friesner J. Am. Chem. Soc. 2009, 131, 3965-3973
- ↑ Z. X. Wang, Y. Tu, M. Frohn, J. R. Zhang, Y. Shi J. Am. Chem. Soc. 1997, 119, 11224-11235
- ↑ J. R. Lane, J. Contreras-Garcia, J. P. Piquemal, B. J. Miller, H. G. Kjaergaard J. Chem. Theory Comput. 2013, 9, 3263-3266


