Rep:Mod:MgOjh6215
Thermal Expansion of MgO
Written by James Hale.
Abstract
The quasi-harmonic approximation and molecular dynamics method were used to analyse the thermodynamic properties of an MgO lattice. Both methods were used to model the thermal expansion of the MgO lattice for the temperature range 0 - 3000 K. The thermal expansion coefficients were calculated and compared to the literature to reveal that the quasi-harmonic approximation was a average model at low temperatures and poor at high temperatures. The results from molecular dynamics method were not consistent with the literature. However, both models require very little computation time and so to create basic models that can be improved.
Introduction[1]
The Structure of MgO


The MgO lattice is a face centred cubic (fcc) ionic lattice and is isostructural with NaCl. The MgO lattice is represented in three different ways during this experiment. The conventional cell (figure 1), the primitive cell (figure 2) and the super cell. The conventional cell contains 4 MgO units and has the lattice structure: a=b=c, α=β=γ=90°. It has the same density but 4 times the volume of the primitive cell, which only contains 1 MgO unit and has the lattice structure: a=b=c, α=β=γ=60°. Even though the primitive cell contains fewer MgO units, the conventional cell is more widely used due to the simplicity of its symmetry. The supercell is used for the molecular dynamics calculations and is the conventional cell doubled in all 3 dimensions to make a 2x2x2 cell. This has 8 times the number of atoms and the lattice parameters defining the cell are twice as large (2aConventional = aSupercell).
It is important to note that the computer will output the results for a primitive cell on completing calculations using the quasi-harmonic approximation. Therefore, the results will have to be converted to those of a conventional for direct comparison with other data.
Quasi-harmonic Approximation[1]
The quasi-harmonic approximation is an improvement on the harmonic approximation for modelling lattice dynamics. It is important to understand the harmonic approximation before applying the quasi-harmonic. For the harmonic approximation the atoms in the lattice only interact with their nearest neighbours. The energy of a 1 dimensional monatomic chain can be modelled by the following Taylor expansion of the interactions between the nearest neighbours:[1]
The equation states that the energy of a 1 dimensional monatomic chain, , is equal to: the rest energy of every atom; where is the number of atoms and is the energy between 2 neighbours as a function of the distance between them, and the second term, which is the energy of the vibrations within the monatomic chain. The vibrational energy is equal to the Taylor series for the displacement of each atom from its rest position, where: is the order of the Taylor series, is the displacement of the nth atom and is the displacement of the nth +1 atom. This represents the correction of the energy between 2 neighbours from the rest energy where the distance between two neighbours is equal to the lattice constant, . For this equation to be formed the displacement of each atom, , must be small in comparison to the lattice constant, otherwise the series may not converge. Usually is much smaller than , and so a quadratic approximation can be applied (). This approximation can be made not just because the higher order terms are small and can be ignored but because harmonic equations have exact solutions, whereas anharmonic equations give numerical solutions. The additional level of accuracy is not required in this investigation and so using the anharmonic method would lead to an unnecessarily high computational cost. The harmonic energy of a 1 dimensional monatomic chain is given by equation 2:[1]
To solve the problem of having open ends of the monatomic chain, the Born-von Karman periodic boundary condition is imposed. Harmonic motion along the continuous chain is sinusoidal and the motion of the entire system can be modelled by travelling waves. The time dependent motion of the nth atom is dictated by the linear superposition of the traveling waves and is shown by equation 3:[1]
Where is the displacement of the nth atom, is time, is the wave vector and is equivalent to , is the angular frequency and is the amplitude. is the displacement of the wave can only be equal to where is an integer. The wave equation can be solved for a particular wave if the wave vector corresponding to that wave is considered individually. This can be simplified to equation 4:[1]
Where is the force constant andis the atomic mass. This equation models the relationship between phonon frequency, which is proportional to energy, and the wave vector. The equation can be used to the plot dispersion curve, which is the frequencies of phonon vibration at each k-point (figure 3). However, reciprocal space, which is equivalent the Fourier transform of the original lattice, must be implemented to plot the dispersion curve. The relation between the lattice constant in real and reciprocal space is:
Using reciprocal space allows for the wave vectors in higher dimensional lattices to be calculated. The density of states (table 1) is the frequency distribution of phonons at each k-point. Once dispersion curve is plotted, by summing over all of the k-points, all of the vibrational contributions to the free energy can be found. Combined with the quasi-harmonic theory, reciprocal space can therefore facilitate the calculation of force constants and potential between atoms in a three dimensional lattice, ultimately leading to the calculation of the Helmholtz free energy of the lattice in equation 6 below:[1]
Where , is the Helmholtz free energy, is the internal energy of the lattice, is the vibrational ground state energy of the lattice and the final term is the contribution from higher vibrational states. The quasi-harmonic approximation is able to calculate the free energy of the lattice accurately because it is able to consider the contributions from the internal energy, which is trying to make the crystal smaller and the entropy, which is trying to increase the distance between the atoms to reduce the frequency of phonon vibrations. The quasi-harmonic approximation makes the assumption that all of the anharmonicity is contained within the resulting thermal expansion and therefore can assign volume dependent harmonic approximations to each lattice volume. This works well at lower temperatures because the higher order terms from equation 1 remain small. However, at high temperatures the anharmonic effects become larger and the higher order terms begin to make the quasi-harmonic approximation diverge from reality.[1]
For diatomic lattices, the dispersion plots contain two types of branches. The first is the acoustic branch, where the different neighbouring atoms vibrate in phase and the second is the optic branch, where the different neighbouring atoms vibrate out of phase. The optic vibrations are of higher energy and are close to the optical part of the electromagnetic spectrum.
Molecular Dynamics Method[2]
Molecular dynamics is another method that can be used to study the thermodynamic properties of a lattice. The quasi-harmonic approximation is unable to account for anharmonic effect or to model phase transitions. The molecular dynamics method can be used to circumvent these flaws. The molecular dynamics simulation involves solving Newton's laws of motions for a set of atoms in a lattice, which interact using a preset anharmonic potential. The simulation uses small time steps, on a femtosecond time scale in this case, to model the velocity and position of each atom. The forces applied on each atom from its neighbours will cause the velocity of the atom to change, via Newton's second law, and its position and velocity are updated in the next time step. A classical trajectory for each atom will be established at the end of the simulation and these are evaluated to identify the properties of the lattice. A set of velocities is assigned randomly to each atom in the lattice at the start of the simulation, with the overall energy of the atoms made to equal the effect of the set temperature. The simulation must be run for long enough for the starting velocities to be equilibrated across the lattice and the time step must be small enough so that an error does not occur in the lattice. Increasing both the total simulation time and decreasing the time step both lead to a higher computational cost so a balance with the desired accuracy should be found. It must be noted that this is a purely classical theory and that quantum effects will lead to errors in the simulation.[1]
A supercell must be used for the molecular dynamics calculations because if a conventional cell was used, all of the cells would move in phase and the only k-point represented would be (0,0,0). This would be an extremely unrealistic model of the MgO lattice. The larger the supercell used the better the model but once again the greater the computational cost and so a 2x2x2 lattice was chosen.
Thermal Expansion[1]
Thermal expansion is an entropy driven process and is the tendency of a substance to increase in volume with increasing temperature. It is modelled by equation 7 below:
Where is the coefficient of thermal expansion, is the initial volume and is the partial derivative of volume with respect to temperature at constant pressure. This equation can be evaluated graphically with the gradient of a temperature against volume graph equalling the expansion coefficient after it is correct by the initial volume term. Thermal expansion occurs because a larger volume reduces the frequency and thus the energy of vibrations. The vibrations increase in frequency at higher temperatures and the volume of the substance increases to account for their contribution to the free energy.
Thermal expansion is very important when considering the construction of buildings and machines. The thermal expansion may cause a structure to collapse or be needed to allow a mechanism to work more efficiently, like in combustion engines.
Software Used
Linux RedHat 5 is a free operating system. It was chosen to run DL Visualise because it is more compatible than Windows with the software. The graphical user interface chosen was DL Visualize. "DL Visualize is designed to provide an integrated environment for data visualization and analysis. It supports the creation and visualization of molecules and atomic structures periodic in 2 or 3 dimensions. It can display calculated results as graphs, contours and isosurfaces depending on the data type."[3] DL visualise allows for the execution of GULP (General Utility Lattice Program) calculations, which is the program of choice for this investigation's computations. GULP is a purpose built program for analysing lattices and has a reduced computation time due to a more efficient use of lattice symmetry.
Experimental
All parts of the investigation were run on a linux operating system, using a DLV interface to observe the structure and properties of the MgO lattice. The lattice structures to be investigated were downloaded from 2 premade files: one conventional cell and one supercell. All calculations were run using GULP. To prevent excessive computational cost the shells were modelled as hard spheres of charge rather than shells of charge, which can be polarised and so the Include Shells option was not selected. The pressure was always set to 0 Pa.
Calculating the Phonon Modes of MgO
The conventional cell, which can be simplified to the primitive cell, was used for this part of the investigation because calculations run with the conventional cell require much less computational power than with the supercell. The phonon dispersion curve was calculated first. The phonon energies were found at 50 points along the k-space between the k-points W-L-Γ-X-W-K. To achieve this the phonon dispersion was computed, with phonon eigenvectors calculated. The temperature was set to 300 K and the Npoints were set to 50. Some phonons were then visualized to check a successful calculation had been completed.
The phonon density of states was then found for k-point grid sizes ranging from 1x1x1 to 64x64x64 at 300 K. The grid sizes were adjusted using shrinking factors A,B and C. For example, when A=1, B=1 and C=1 a k-point grid is formed with dimensions 1x1x1.
Computing the Free Energy - The Quasi-harmonic Approximation
The log files produced during the density of states calculations were examined to find the free energy given by each grid size. The larger the grid size the more accurate the free energy calculation. The ideal grid size is a balance between computational cost and the appropriate level of accuracy. The converged value for the free energy and the ideal lattice size were found.
The Thermal Expansion of MgO
The thermal expansion of MgO was investigated using first the quasi-harmonic approximation with the conventional cell and then the molecular dynamics method with the supercell.
For the quasi-harmonic approximation a 24x24x24 grid size was found to be the ideal grid size to provide the best balance between accuracy and computational cost. The density of dates calculation was still active in order to allow for the larger grid size. The conventional cell was used to maintain a low computational cost. The Gibbs energy of the MgO lattice was then optimised over the temperature range 0 K to 2900 K in 100 K steps. Even though the melting point of MgO is 3125 K,[4] the quasi-harmonic approximation would give an error for temperature at 3000 K or above.
For the molecular dynamics method the supercell was used. Even though it requires greater computational cost, the molecular dynamics approximation would not work with a conventional cell because the every cell in the lattice would be moving in phase. This is not a valid representation of the MgO structure and therefore a larger starting cell must be used. The molecular dynamics calculations were run with pressure, the number of particles and temperature all fixed. The time step between each recorded position of the individual atoms was set to 1 fs and the number of equilibration steps, the number of steps allowed for the system to reach equilibrium, was set to 500. The production steps, the number of steps run after the system has reached equilibrium, was also set to 500. The number of sampling steps, the number of steps over which the means are taken, and trajectory write steps, the number of steps between which the geometry is saved in order to produce animations, were both set to 5. The temperature range for the calculations was 100 K - 3300 K with 100 K steps. A 50 K reading was also taken because the simulation did not work at 0 K. The vibrations were animated after each calculation to check that it had run correctly.
Results and Discussion
Calculating the Phonon Modes of MgO
| Grid Size | Phonon Density of States Plot |
|---|---|
| 1x1x1 | 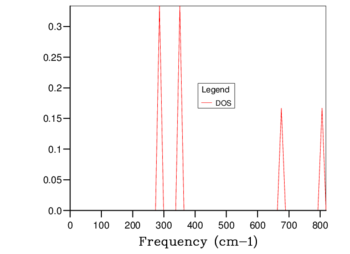
|
| 3x3x3 | 
|
| 24x24x24 | 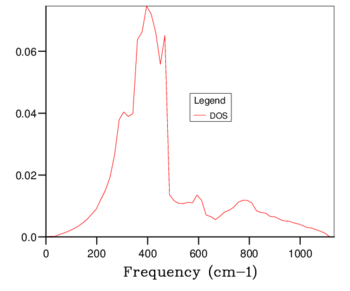
|
| 32x32x32 | 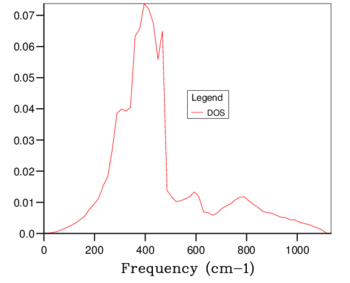
|
| 64x64x64 | 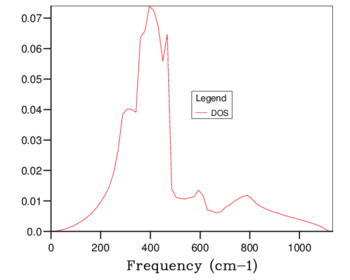
|
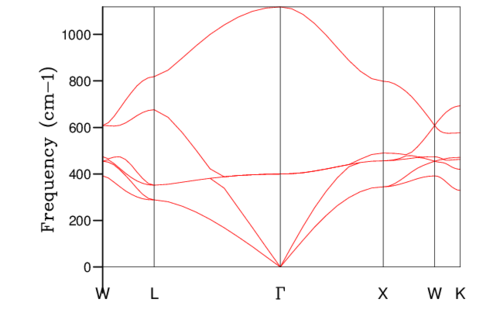
The phonon dispersion curve is found by calculating the possible frequencies at different k-points between W-L-Γ-X-W-K. The density of states plot is the number of different frequencies and their probability of occuring at a single k-point in reciprocal space. The density of states plot for a 1x1x1 grid is given in table 1. By looking at the frequencies present (280, 350, 680 and 820 cm-1) and the probability of each frequency occurring (2:2:1:1 respectively) it is possible to match the 1x1x1 density of states plot to point L, which has the k-point (0.5,0.5,0.5). This result was verified by checking the relevant log file. The 4 acoustic bands become doubly degenerate and account for the doubling of the probability of the 280 cm-1 and 350 cm-1 peaks with respect to the two optical peaks. There are twice as many acoustic modes as optical modes in this case because the acoustic modes can be both longitudinal and transverse phonons whereas the optical modes can only be transverse.
The density of states plots can be seen in table 1 below. Increasing the grid size increases the number of k points sampled, more phonons are displayed and distinct peaks become continuous curves. The number of phonons follows the 3N - 6 rule, where N is the number of atoms. The 6 is subtracted for the translational and rotational modes of the lattice. This is verified by the 1x1x1 grid size because there are 2 atoms present, 1 magnesium and 1 oxygen, and the number of phonons shown is 6. With a larger grid size the number of phonons increases. Once a large enough grid size is used the density of states plots no longer changes to a significant degree. This is illustrated in the difference between the 24x24x24, 32x32x32 and 64x64x64 grid sizes.
The minimum reasonable grid size to approximate the density of states was chosen to be 24x24x24. Choosing the ideal grid size is considering the computational cost with the increase in level of accuracy. The 24x24x24 grid size was chosen because there are no significant changes between the density of states at this grid size and those of 32x32x32 (the next largest grid size) and 64x64x64 (the largest grid size used). The optimal grid size of 24x24x24 is very similar to that of larger grids but much smoother and more detailed than the smaller grids of 3x3x3 and 1x1x1. The density of states is at a single k coordinate. The dispersion curve shows a variety of k coordinates and how they change periodically. Therefore, the density of states of a k-point is a single x axis value on the dispersion curve.
Computing the Free Energy - The Quasi-harmonic Approximation
The quasi-harmonic approximation was used to calculate the free energy per cell of the lattice at different k-space grid sizes as outlined in the experimental. The results are shown in table 2.
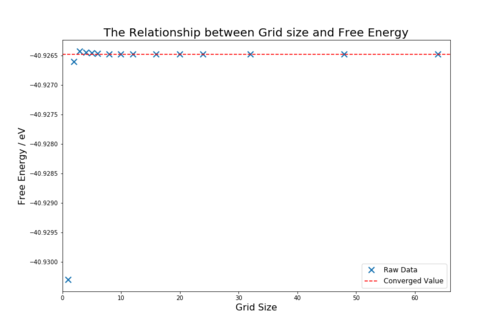
As the grid size is increase the free energy values calculated converge to the value -40.926483 eV. The converges occurs quickly and is accurate to 1 meV of the converged value for only the 2x2x2 grid size. To be accurate to 0.5 meV and 0.1 meV, a grid size of 2x2x2 and 3x3x3 are needed respectively. The accuracy of the calculation increases as the grid size is increased because more vibrational modes are considered, which make the final term in equation 7 closer to the real value. The accuracy continues to increase until the converged value is reached to an accuracy of 0.001 meV. Beyond this point the software is unable to improve the accuracy of the calculation. The points that have converged are shown in table 2. Using grid sizes beyond the first converged value is not an efficient use of computational power and therefore the ideal grid size was taken to be 24x24x24.

| Grid Size | Free Energy / eV | Difference Between Measured
and Converged Values |
|---|---|---|
| 1x1x1 | -40.930301 | 0.003818 |
| 2x2x2 | -40.926609 | 0.000126 |
| 3x3x3 | -40.926432 | 0.000051 |
| 4x4x4 | -40.92645 | 0.000033 |
| 5x5x5 | -40.926463 | 0.000020 |
| 6x6x6 | -40.926471 | 0.000012 |
| 8x8x8 | -40.926478 | 0.000005 |
| 10x10x10 | -40.92648 | 0.000003 |
| 12x12x12 | -40.926481 | 0.000002 |
| 16x16x16 | -40.926482 | 0.000001 |
| 20x20x20 | -40.926483 | 0.000000 |
| 24x24x24 | -40.926483 | Converged |
| 32x32x32 | -40.926483 | Converged |
| 48x48x48 | -40.926483 | Converged |
| 64x64x64 | -40.926483 | Converged |
Figure 5 shows how the free energy of the lattice changes with temperature. The graph is a downwards sloping curve showing that the free energy of the lattice decreases with temperature. According to equation 8:
Where is the Helmholtz energy, is the internal energy, is temperature and is entropy. It would be expected that the graph would be a straight line if both and were constant. A straight line would indicate that the internal energy remains constant and the entropic contribution increases linearly with temperature. However, the gradient of the graph is steadily decreasing, which shows that both or either of the internal energy or entropy is decreasing or increasing respectively with temperature. At higher temperatures the entropic contribution is dominant and so the entropy of the lattice is most likely to be increasing with temperature. This may be due to the increased volume of the lattice, which comes as a result of thermal expansion and will be evaluated in the next section.
Considering Alternative Structures
When considering the grid size to be used for alternative structures, the lattice constant for these structures should be evaluated. The larger the lattice constant the fewer the number of k-points are needed to accurately evaluate it in reciprocal space because the value of a* has decreased. Therefore, for a larger lattice constant a smaller grid size can be used.
The lattice constants of the MgO[5], CaO[6], faujasite[7] and Li [8] lattice structures are as follows: 4.21 Å, 4.81 Å, 24.60 Å and 3.51 Å respectively. The same 24x24x24 grid size would be acceptable for the CaO lattice structure as the lattice parameters of MgO and CaO are very similar. Faujasite has a much larger lattice parameter and would require fewer k-points to produce results to the same level of accuracy and so a smaller grid size can be used. Lithium has a relatively smaller lattice parameter and may need a greater grid size to produce results to the same level of accuracy. It should also be mentioned that the literature values found for the lattices constants are taken at similar but not the same temperatures and so may not be directly comparable for calculations. However, this section has not been investigated and the approximate lattice constants are appropriate to make qualitative judgements.
The Thermal Expansion of MgO
The thermal expansion of MgO was modelled using both the molecular dynamics method and the quasi-harmonic approximation to investigate the effectiveness of each method by comparison with literature values.
In figure 6, the temperature is plotted against the lattice constant for the both the molecular dynamics method and quasi-harmonic approximation. For the quasi-harmonic approximation the lattice constant given in the log file is that of the primitive cell. To convert the result to a conventional cell two methods were used, the first to achieve the result and the second to verify. The first method is taking the volume of the primitive cell, multiplying by 4 to attain the volume of the conventional cell and then taking the cube root of the cubic conventional cell volume to find the lattice constant. The second method uses Pythagoras' formula to convert between the lattice constant of a primitive cell and that of a conventional cell. For the molecular dynamics method the lattice constant was simply halved because the supercell is twice as large in all dimensions.

In both datasets the lattice constant increases with temperature. This would be consistent with thermal expansion. For molecular dynamics the upward trend is close to linear with a points deviating more as the temperature increases. This may be because at higher temperatures the simulation takes longer to equilibrate and the number of time steps became less appropriate, it is also possible that higher temperatures create more noise that always leads to a greater deviation in the final result, whatever the timescale. For the quasi-harmonic approximation the curve slopes upwards smoothly, indicating that the rate of increase of the lattice constant increases with temperature. It must be noted that the highest temperature tested was 2900 K because higher temperatures caused the approximation to lead to an error, this is one of the limitations of the approximation. The molecular dynamics method was able to complete calculations on temperatures higher than the melting point and does not have the same limitation.
The effects of temperature on volume are now investigated. The volume is just the cube of the lattice constant. These plots are needed to calculate the thermal expansion coefficient.
The thermal expansion coefficient for MgO was found for both methods using the plots in figures 7 and 8 combined with the following equation, which is a practical representation of equation 7:
Where and are the macro change in temperature and volume respectively. The assumption that the pressure is constant is maintained. The term is the gradient of the temperature against volume plots. The gradient is then corrected by the initial volume of the cell to give the thermal expansion coefficient, . This equation assumes that the thermal expansion coefficient is constant with temperature and volume, which is only true for very small changes. Therefore, one of the assumptions made is that the thermal expansion coefficient is effectively constant over larger ranges. To find the balance between using more data points and taking this assumption further was difficult so a linear gradient was plotted over different numbers of points to check for the suitability of the linear assumption. It was concluded that the best balance was found by taking the thermal expansion coefficient over 6 points, where the curves are still almost linear and enough values are included to give a meaningful result. This process is not as applicable to molecular dynamics because the gradient is fairly constant throughout. However, to be able to compare results the same process was applied to both the quasi-harmonic approximation and the molecular dynamics method.

Figure 7 shows the temperature against cell volume plot for the quasi-harmonic approximation. The graph is an upwards curve, showing that the thermal expansion coefficient is increasing. This verified by the thermal expansion coefficients calculation annotated on the graph. The results shown in table 3.

The thermal expansion coefficient does not convincingly increase when using the molecular dynamics method, figure 8. The gradients seem to deviate around a central gradient and when only a small number of points are taken the noise has a large effect on the resulting gradient. Therefore, the gradient was plotted using all the points in figure 9 and the thermal expansion coefficient was equal to 33.2 K-1. The mean of the 4 thermal expansion coefficients shown in figure 8 and table 3 is 31.6 K-1 The similarity of the values indicates within reason that gradient of the figure 8 is linear or very close to being so.
| Temperature / K | 300 | 800 | 1300 | 1800 |
|---|---|---|---|---|
| Thermal Expansion Coefficient for the
Quasi-harmonic Approximation x10-6 / K-1 |
26.7 | 32.7 | 38.5 | 47.9 |
| Thermal Expansion Coefficient for the
Molecular Dynamics Method x10-6 / K-1 |
30.1 | 32.6 | 23.8 | 39.7 |
| Literature Values for the Thermal
Expansion Coefficient x10-6 / K-1 |
31.2 | 42.6 | 47.1 | 51.3 |

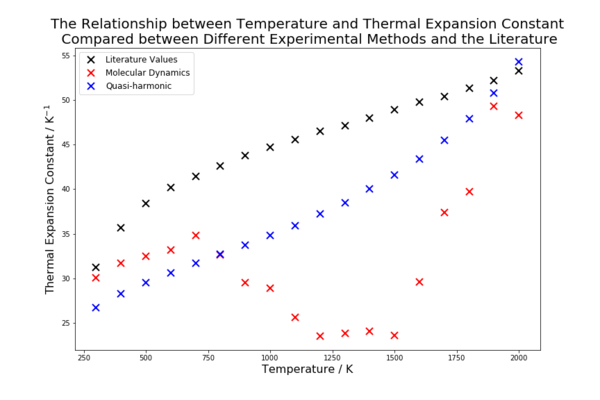
The calculated thermal expansion coefficients are compared with the literature values in table 3.The molecular dynamics model appears to model well at low temperatures but as the temperature increases it does not account for the increase in the thermal expansion coefficient. The quasi-harmonic approximation seems to model the thermal expansion coefficient fairly well, around 10-20% below the literature across most values. However, it was noted that the way the thermal expansion coefficient increased with temperature was similar but not consistent with the literature. This is shown in figure 10. The molecular dynamics method decreases before increasing again, this could be due to the inclusion of points with a lot of noise and a sample size not great enough to negate the points effect. There is a possibility that the coefficient shows a relatively slow increase, which would likely continue even if the temperature is raised well beyond the melting point. The literature and the quasi-harmonic approximation have more defined patterns. The thermal expansion coefficient of the quasi-harmonic approximation increases, first with a decreasing gradient and then with an increasing gradient. This acceleration in expansion at high temperatures is different from the literature values, which show the thermal expansion coefficient increasing but at a decreasing rate.
This comparison shows that neither method is suitable for measuring the thermal expansion coefficient in this case. The quasi-harmonic approximation is better at predicting the trend of the literature and is consistently a better model than the molecular dynamics method, which would require significantly more computational expense to even just reduce the noise to acceptable levels. However, even the quasi-harmonic approach deviates from the trend of the literature at higher temperatures indicating that the anharmonic effects become more pronounced. Approaching the melting point value the quasi-harmonic approximation breaks down because the phase change is anharmonic, the harmonic phonon modes no longer model the lattice effectively and the phonon modes do not represent the movement of the ions. The molecular dynamics method does not give an error at temperatures above the melting point because the velocities of the particles simply increase. This leads to greater kinetic energy and the increased amount of noise. Systems with greater velocities would require a smaller time step and a greater equilibration time to achieve the same accuracy as at low temperatures. However, at very low temperatures, when the zero point energy is significant (the second term in equation 6), the molecular dynamics simulation does not accurately model the system because it does not include the zero point energy as it is a purely classical method. This explains the error that occurred when trying to execute calculations at 0 K.
Additional Information
In a diatomic molecule with a harmonic potential, as temperature increases the bond length remains the same. The bond length oscillates at a higher frequency and energy about the same equilibrium bond length. For a crystal lattice, the expansion of the lattice leads to an increase in entropy. The quasi-harmonic effect allows for the alteration of the harmonic potential to incorporate the entropic contribution to the free energy. The increase in entropy from expansion is not present in a diatomic molecule because it only has one vibrational mode.
To perform an accurate molecular dynamics calculation a similar number of conventional cells could be used to the grid size in reciprocal space for the quasi-harmonic approximation, this was 24x24x24 and so the supercell could be upgraded to a 24x24x24 conventional cell or a size slightly smaller to conserve computational cost.
Conclusion
The suitability of both the quasi-harmonic approximation and the molecular dynamics method to model an MgO lattice was evaluated. The quasi-harmonic approximation was first optimised by finding the optimum reciprocal space grid size of 24x24x24 by analysing the results of the density of states and free energy calculations. Both methods were then used to investigate the change in the volume of the lattice with increasing temperature and the thermal expansion coefficients were found from the corresponding plots. A final plot was made to analyse how the thermal expansion coefficient changed with temperature in comparison to the literature. Neither method was a good model.
The quasi-harmonic approximation was a much better model because the initial trend of the thermal expansion coefficient matched that of the literature and the values for the thermal expansion coefficient were nearly always within 10-20%. However, the quasi-harmonic approximation does not take into account anharmonic effect and at higher temperatures this led to an acceleration of the thermal expansion, which does not occur in the literature. The molecular dynamics method was inaccurate and inconsistent especially at very high temperatures. The linear gradient of figure 8 at low temperatures did not match the literature and the scattering of the points prevented any reliable conclusions being made. To improve this: a larger sample time, a smaller time step and a larger supercell could all be used. There were also assumptions made in both calculations that contrast from reality and may account for the deviation of both methods from the literature. The ions were all assumed to be point charges. In reality, the charge on each ion is in shells and can be polarised by the proximity of other ions in the vicinity. Also when taking the thermal expansion coefficient readings, the gradient was taken over 500 K on the x axis. This is a very large temperature range to assume that the thermal expansion coefficient is constant but the assumption was necessary to provide a meaningful result from the data. To improve on this problem, many more data points could be taken or the investigation could be focused on a narrower temperature range.
Nevertheless, for the small computational time taken the models do not produce bad results. No calculation took longer than one minute and the results and, although deviant from the literature, do provide the basic representation of the MgO lattice's thermodynamic properties. These models provide a platform for improvement and pave the way for better, more expensive models with fewer assumptions.
References
- ↑ 1.00 1.01 1.02 1.03 1.04 1.05 1.06 1.07 1.08 1.09 M. T. Dove, Introduction to lattice dynamics, Cambridge University Press, 2005.
- ↑ M. Matsui, J. Chem. Phys., 1989, 91, 489–494.
- ↑ B. G. Searle, Comput. Phys. Commun., 2001, 137, 25–32.
- ↑ B. Kumar, S. J. Rodrigues and L. G. Scanlon, J. Electrochem. Soc., 2001, 148, A1191.
- ↑ W. Chang, J. S. Horwitz, A. C. Carter, J. M. Pond, S. W. Kirchoefer, C. M. Gilmore and D. B. Chrisey, Appl. Phys. Lett., 1999, 74, 1033.
- ↑ C. A. and editors of the volumes III/17B-22A-41B, in II-VI and I-VII Compounds; Semimagnetic Compounds, Springer-Verlag, Berlin/Heidelberg, pp. 1–3.
- ↑ D. N. Stamires, Clays Clay Miner., 1973, 379–389.
- ↑ E. J. Covington and D. J. Montgomery, J. Chem. Phys., 1957, 27, 1030–1032.
- ↑ O. L. Anderson and K. Zou, J. Phys. Chem. Ref. Data, 1990, 19, 69–83.
- ↑ K. S. Singh and R. S. Chauhan, Phys. B Condens. Matter, 2002, 315, 74–81.
- ↑ K. S. Singh and R. S. Chauhan, Phys. B Condens. Matter, 2002, 315, 74–81.
- ↑ O. L. Anderson and K. Zou, J. Phys. Chem. Ref. Data, 1990, 19, 69–83.
