Rep:Mod:MgO cs4614
Thermal Vibration of MgO
Introduction
Thermal Expansion

Materials respond to an increase in temperature by changing their volume and shape. Since temperature is a measure of the average kinetic energy of a system, materials almost always expand when heated, as the atoms in a crystal have more kinetic energy at higher temperatures, so vibrate more, causing a larger average separation. The degree of this expansion is characterised by the thermal expansion coefficient. This lab used the volumetric coefficient (the volume of a unit cell), but there are also linear (lattice parameter) and area coefficients depending on the application.
MgO
The MgO model used is an ideal (defect-free) structure with a face centred cubic (NaCl structure) unit cell. Both primitive (containing 2 atoms - one each of Mg and O) and conventional (containing 8 atoms) cells were used in the calculations.
Methods
The thermal expansion coefficient was calculated using two different methods: the quasi-harmonic approximation and molecular dynamic method.
The quasi-harmonic method uses a quantum mechanical view to compute thermal expansion properties, using phonons. Phonons are quantised modes of vibrational energy that can be considered an analogue to photons. Like their photon equivalent, phonons can be treated as particles under quantum mechanical analysis, or classically as normal modes which obey the principle of superpostition: the vibration in any part of the crystal structure can be represented by a superposition of these normal modes. If the temperature is increased, then there will be more phonons in the crystal, which represents the increased amplitude of atomic vibrations in the lattice.
Because MgO is a periodic crystal structure, the phonons can be represented with a Bloch function. Each phonon has an associated wave vector k which describes, amongst other properties, the momentum and symmetry of the phonon; the range in which k is unique is defined as the first Brillouin zone, a uniquely defined primitive cell in reciprocal space, from which all the solutions to a Bloch wave can be characterised.
The quasi-harmonic method models phonon dispersion by assuming that the harmonic approximation holds for phonon frequencies. The harmonic approximation states that, close to equilibrium, the motion of interacting atoms can be modelled by a simple parabola. It assumes that phonons do not interact, and that the atoms in the lattice can be treated as independent simple harmonic 3D oscillators.[1]

Plotting the energy E(k) vs k gives band structures, the shape of which is determined by the orientation of the orbital interactions involved in forming the band. The band width is the difference between the highest and lowest point in the band. The direction and band width become important when calculation the density of states (DOS). Because there are an infinite number of phonons in an infinite 3D crystal, it is necessary to to look at the number of possible vibrational states within a certain range, as opposed to which individual states are present, which is called the density of states. The DOS is inversely proportional to the gradient of the band structure (the graph of E(k) vs k), and is cumulative where multiple bands cross a point. As the temperature increases, more higher energy vibrational levels are occupied. Put another way, this represents that higher temperatures make the molecules in a crystal vibrate more.[2]
The molecular dynamics method is a completely classical model, which computes how the atoms move under the influence of forces.
GULP
Calculations were carried out using GULP (General Lattice Program), which uses symmetry arguments and force field methods to calculate properties of a lattice structure by focusing on the atoms in the structure as opposed to the electrons. Phonon frequencies are calculated from their values in reciprocal space within the first Brilliouin zone. Since the Helmholtz Free Energy as a function of temperature can be calculated from phonon DOS information,[3] it is valid to determine the dependence of structure on temperature through minimising values for the free energy.[4]
Results and Discussion
Quasi-harmonic
The calculations for the quasi-harmonic method used a primitive cell with the initial parameters a = b = c = 2.978 A and α = β = γ = 600.
Computing the Phonons
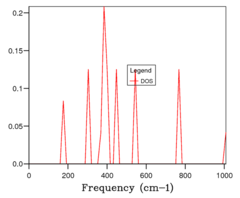
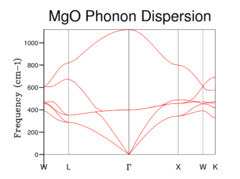
The initial step in the quasi-harmonic calculation was to calculate the phonon density of states. This was achieved by sampling an increasing number of k points in reciprocal space. Initially just one point was sampled (Fig 1a) which was the special point L in the lattice. This is determined by comparing the phonon dispersion (Fig 1e) to the density of states obtained with a 1x1x1 grid of k points (ie a single point). The DOS shows 4 peaks: two peaks at 290 and 350 cm-1 which are twice the height of 2 peaks at 680 and 805 cm-1. 6 phonons in total are shown on the dispersion plot: 2 phonons cut through L a the same frequency at each of the higher peaks, whilst one phonon cuts L at the lower peaks, which explains the height difference.
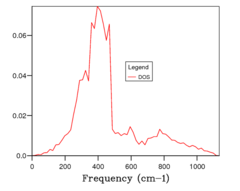
The number of points in a grid was increased from 1x1x1 to 2x2x2 (Fig 1b) to 4x4x4, etc, doubling the number of points along each axis until 32x32x32. With the addition of more k points, the DOS plots became more resolved, until they converged between 16 and 32 size grids. Since calculations with 16x16x16 grids (Fig 1c) were much faster than those with 32x32x32 (Fig 1d), this was chosen as the optimum grid size which balanced gaining enough information with computational cost.
Free energy also gave an indication of which grid size to use:
| Grid size | Free Energy A/eV | dA (difference in free energy between grid and one grid smaller) |
|---|---|---|
| 1x1x1 | -40.930301 | 0 |
| 2x2x2 | -40.926609 | 0.003692 |
| 4x4x4 | -40.926450 | 0.000159 |
| 8x8x8 | -40.926478 | 0.000028 |
| 16x16x16 | -40.926482 | 0.000004 |
| 32x32x32 | -40.926488 | 0.000006 |
The difference in free energy dA between the grid sizes rapidly converges to zero as the grid size increases. A grid of 4x4x4 would be appropriate for calculations accurate to 1 meV whereas a grid of 8x8x8 would be better suited to a calculation accurate to 0.1 meV. Since it is not particularly computationally more costly to go from a grid of 8x8x8 to 16x16x16, and a noticeably better resolution of the phonon DOS is acheived, a 16x16x16 grid was used for the following calculations.
Calculating the Free Energy
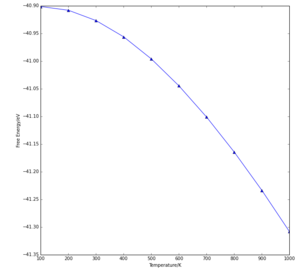
The free energy of the crystal becomes more negative as temperature increases (Fig 2), as described by the equation:
(1)
dT and dV are positive, since temperature T and volume V are both increasing, meaning dA is negative, since pressure P is treated as constant, and entropy can be assumed to have little effect. Put simply, the signs in equation (1) mean that as temperature rises (which causes volume to increase), the free energy becomes more negative, which was seen in the results.
Thermal Expansion Calculation
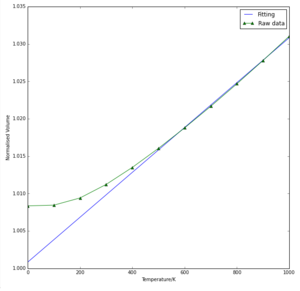
The volume of the unit cell increases as temperature increases (Fig 3). The gradient also increases as temperature increases, meaning that the rate of expansion increases with increasing temperature. This fits with the expectation that for most crystal lattices, as the average kinetic energy increases, the amplitude of the atomic vibrations within the lattice increases, so the atoms tend to space out more with higher temperatures.
From the same graph, the thermal expansion coefficient was computed to be 2.9996 x 10⁻⁵. This is in moderate agreement with the literature value of 3.12 x 10⁻⁵ measured at 300K which is given in literature,[5] suggesting that the quasi-harmonic approximation is a valid method within the temperature range of the calculations.
For the computed values to be accurate, phonon sampling must be thorough, and the temperature must not be too high, as then phonon-phonon coupling occurs, which means that the vibrations can no longer be modelled as simple harmonic oscillators.The melting temperature of MgO is 3125K, so the range studied here of up to 1000K is valid as a reasonable approximation.
One approximation that is present in almost every quantum mechanical calculation is the Born-Oppenheimer approximation, which assumes that the electron and nuclear motion can be separated. In addition, the atoms are treated as hard spheres, instead of being surrounded by electron clouds. Both these approximations have some effect on the accuracy, but are necessary to simplify calculations. The main approximation concerns the anharmonic component of atomic motion, which arises due to phonon-phonon coupling. GULP corrects this slightly by including some anharmonic corrections, but this is not sufficient at temperatures high enough for diffusion to occur (approximately half the melting point).[6]
Molecular Dynamics
The molecular dynamics calculations were carried out on a supercell consisting of 2 conventional unit cells.
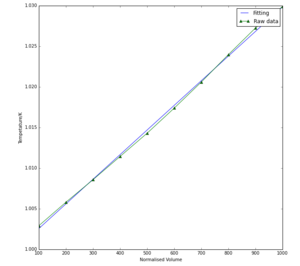
The molecular dynamics data (Fig 4) gave similar results to the quasi-harmonic method, with the main difference being that molecular dynamics predicted that thermal expansion rises linearly as temperature increases, compared to a curve with increasing gradient predicted by the quasi-harmonic approximation calculations. The thermal expansion coefficient was predicted to be 3.03271505 x 10⁻⁵ which is only 0.03 x 10⁻⁵ difference to the quasi-harmonic value. Whilst the thermal expansion coefficient is higher for the molecular dynamics calculations, the actual thermal expansion (in terms of normalised volume) is also lower within the calculated range for molecular dynamics. This means that the actual volumes at a specified temperature is lower within the molecular dynamics model, but increases at a greater rate with temperature than the quasi-harmonic calculations.
The quasi-harmonic approximation is a curve at lower temperatures because it takes into account the quantum harmonic effect of zero point energy. This arises due to the Uncertainty Principle, which states that the position and velocity of a particle can never be determined simultaneously; however, if at 0K the crystal had no kinetic energy then the particle would have no velocity, and its position could also be determined, breaking the principle. Because Molecular Dynamics is completely classical, it doesn’t take zero point energy or the quantisation of vibration into account, so the trend is a line at lower temperatures, not a curve. This also explains why, by determining alpha in the quasi-harmonic approximation by fitting a straight line to the graph at the straight section (which occurred at higher temperatures) the value was very similar to the alpha value for molecular dynamics data: the zero point energy contribution is far less influential at higher temperatures. If alpha was calculated at lower temperatures, then the gradients of the two graphs would be very different, so the two methods would yield very different alpha values.
At higher temperatures, molecular dynamics more closely resembles empirical results. This is because the quasi-harmonic approximation is based on simple harmonic oscillations, so only allows parabolic vibrations, meaning the atom must always return at some point in the vibration to the equilibrium position at the minimum of the parabola. Therefore in the quasi-harmonic model the solid cannot melt, because the atoms must always return to a certain position, which is not the case in liquids. This constraint is not in place in the molecular dynamics model, which can fully account for anharmonic motion.
The model for molecular dynamics is not as accurate as it could be due to the small number of atoms used in calculations. There are only 64 atoms in the conventional supercell used in calculations, which cannot accurately capture the long range interactions and wider vibrations that work in an infinite lattice. To improve accuracy, a larger number of atoms should be used in calculation, but this would require more computational power.

Conclusions
Both models have advantages and limitations. The quasi-harmonic approximation is more suitable at lower temperatures, where quantum effects such as the quantisation of vibration and zero point energy become significant, whereas molecular dynamics is more suited for calculations at medium to high temperatures, where Newtonian mechanics more accurately describes atomic motion in the lattice. Both models were in moderate agreement with literature, suggesting that they are valid within the temperature range studied.
Therefore, the choice of model depends on the application and purpose of calculations.
- ↑ J D Gale and A L Rohl, Mol. Simul., 2003, 29, 291-341
- ↑ R Hoffman, Angew Chem Inr. Ed Engl, 1987, 26, 846-878
- ↑ J D Gale, Z. Krist., 2005, 220, 552-554
- ↑ J D Gale, JCS Faraday Trans., 1997, 93, 629
- ↑ B. B. Karki, R. M. Wentzcovitch, S. de Gironcoli, S. Baroni, Phys. Rev. B, 2000, 61, p8793; DOI: 10.1103/PhysRevB.61.8793
- ↑ J D Gale, General Utility Lattice Program v4.2, accessed at https://nanochemistry.curtin.edu.au/local/docs/gulp/gulp4.2_manual.pdf on 21/10/16


