Rep:Mod:MgO YZ19114
Abstact
In this experiment, the energy and vibrations of a crystal of magnesium oxide were calculated by a simple model of atomic interactions initially, the free energy was then computed by these vibrational energy levels and the effect of temperature on the expansion of the lattice structure was investigated by two computational methods, the Quasi Harmonic Approximation and Molecular Dynamics using DLVisualize, a graphic user interface to the molecular modelling code GULP in this case.[1]
Introduction
Magnesium oxide is prized as a refractory material in industry which is physically and chemically stable at high temperatures, and it has several outstanding advantages such as high thermal conductivity and low electrical conductivity. MgO also has significant importance in scientific area, where it is used as a model system for investigating vibrational properties of crystals due to its thermal stability.[2][3]
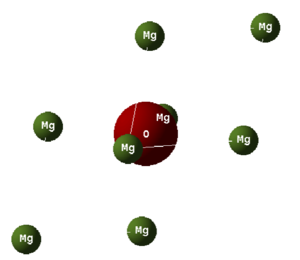
Firstly, the single fcc MgO system is assumed to be ideal, non-defective and periodic in 3D for further analysis in this experiment. And the structure of MgO can be represented by three types of cells as shown below: primitive cell which is the smallest rhomboic unit that can generate the whole structure, conventional cell which is a more specific fcc lattice structure that can reflect the true symmetry and supercell which is a repeating unit cell that contains several primitive cells.[4]
| Table 1: The primitive cell, conventional cell and supercell of MgO | ||
|---|---|---|
 |
 |
 |
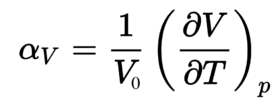
The aim of the investigation on thermal expansion of MgO is mainly on predicting how the material expanded when heated by analyzing the vibrational motions of atoms around their equilibrium positions. Because vibrations can provide information about free energy, thermal properties, phase transitions, electrical properties and etc. And the phonon dispersion curve which shows a function of vibrational frequency as a function of wavevector k in reciprocal space is used to predict and analyze different modes and properties. DLVisualize, which is a a general purpose graphical user interface to the molecular modelling code GULP based on the Linux system is used to carry out the thermal expansion simulations for calculating the thermal expansion coefficient by equation 1 under two different simulation methods, the Quasi Harmonic Approximation and Molecular Dynamics under classical simulation. For the harmonic approximation, the Helmholtz free energy can be computed by summing over all of the vibrational bands j and all of the k-points you have summed over all vibrational energy levels, followed by calculating the thermal expansion coefficient to investigate the thermal expansion. This method is able to generate accurate results over a certain temperature region through a relative simple model.[5] For the molecular dynamics, it simply simulates the motions of the atoms in the real material, and is more expansive but more reliable and accurate than the previous one. By computing the forces on the atoms and applying Newton's second law , the positions and velocities are updated repeatedly until average properties settle down and the cell volumes at each step can be measured to calculate the thermal expansion coefficient .[5]
Results and Discussions
Calculating the internal energy of an MgO crystal
In this section, the positions of atoms and the cubic structure are fixed due to the symmetry, and the simple force field contains only the +2 Mg ion, -2 O ion and a a simple Buckingham repulsive potential operates between the ions. Therefore, the total energy due to the inter-atomic forces (both short range repulsions and electrostatic interactions) by summing over the infinite lattice is calculated to be -41.07531759 eV (lit.-39.332 eV)[6] per primitive unit cell, which corresponds to the binding energy required to pull all of the ions of the crystal to infinite separation.[7]
Lattice Vibrations - Computing the Phonons
MgO structure is considered to be a 1D hetro diatomic chain with infinite number of vibrations made by repeating a unit cell, and there is a wavevector k which is equal to for every possible vibration of the crystal. Figure 1 represents the phonon dispersion curve which shows the relationship between the frequency of vibrations and wavevector k. It can be seen that there are totally six vibrational bands shown in the plot because there are two atoms per MgO unit cell, and there are three vibrational modes: longitudinal acoustic, transverse acoustic, transverse opic modes.[4] Acoustic modes tend to be zero in frequency at gamma because all atoms move in phase and overall there is no change in energy because all atoms move in a single direction and no vibrations occur. However, optic modes always have higher energy and do not reach a minimum vibration at zero because there are always atoms vibrates out of phase.
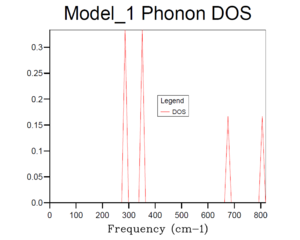
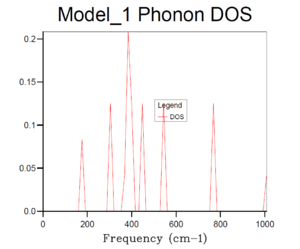
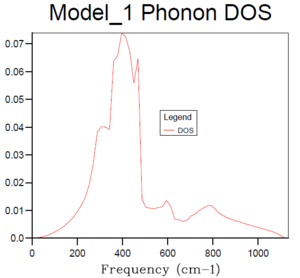
Table 2 shows different phonon density of state graphs with different grid sizes. The phonon DOS presents the relative intensity versus frequency, which indicates the number of vibrational eigenstates at each frequency. According to the DOS plot for 1x1x1 grid size, only one k value is evaluated as there is only one unit cell. It can be seen that there are two peaks with intensity of around 0.3 near 300 cm-1, and two peaks with intensity of around 0.15 near 700 and 800 cm-1 respectively. Looking back to the phonon dispersion curve, it shows that at symmetry L, there are 4 branches of vibrational modes overlap into 2 branches near 300 cm-1, which indicates that the phonon corresponding to k is double degenerated. However, there is only one single branch at around 700 and 800 cm-1, which explains why the intensities or the relative ratios of two peaks at 300 cm-1 are doubled compared with the two peaks with higher frequencies.
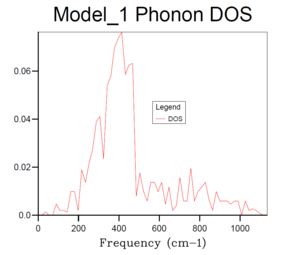
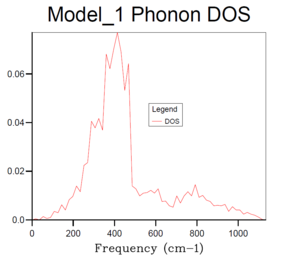
Basically, as the grid size increases, the number of k values or the vibrational modes increases, which makes the curve more continuous and accurate but along with longer running time. According to table 1, it can be seen that the plot for 32x32x32 grid size with the most number of k values present the most smooth, continuous and accurate curve. Therefore, 24x24x24 grid size is suitable in this case by compromising between the accuracy and the operation time, it is sufficiently accurate with a relative short running time, and there is no need to run a phonon DOS with larger grid size with similar results but much longer running time.And according to the dispersion curve, there are relatively large number of branches and overlapping occurring between 350 and 450 cm-1, which is consistent with the relative high intensities between 350 and 450 cm-1 in the phonon DOS curve. Essentially, the frequency region associated with more intensive branches in dispersion curve will show peaks with relative high intensity in phonon DOS plots.
Considering of different materials, the optimal grid size may be different because of various structure and lattice constant. For a similar oxide such as calcium oxide, it has a similar lattice structure and lattice constant compared with MgO. Therefore, the optimal grid size for MgO is suitable in this case. For a Zeolite such as Faujasite, it has a much larger cubic lattice structure compared with MgO, and according to the equation 2: which converts the lattice constant in real space into reciprocal space, the size or lattice constant in reciprocal space of Faujasite is much small than that of MgO. Therefore, a relative smaller grid size would be appropriate in this case to generate an accurate DOS with shorter running time. For a metal such as lithium, it has a smaller lattice structure compared with MgO so it should require a larger optimal grid size according to the previous equation. However, lithium has a completely different structure with delocalised electrons around lithium ions which reduces the repulsive interactions between adjacent ions. Therefore, it cannot be determined if the optimal grid size should be changed.
Calculating the Free Energy in the Harmonic Approximation
| Table 3: Helmholtz free energy with different grid sizes (six decimal places for free energy to compare the difference) | ||
|---|---|---|
| Grid size | Free Energy/ eV | absolute ΔA/ meV compared with free energy of 32x32x32 grid |
| 1x1x1 | -40.930301 | 3.818 |
| 2x2x2 | -40.926609 | 0.126 |
| 3x3x3 | -40.926432 | 0.051 |
| 4x4x4 | -40.926450 | 0.033 |
| 6x6x6 | -40.926471 | 0.012 |
| 8x8x8 | -40.926478 | 0.005 |
| 12x12x12 | -40.926481 | 0.002 |
| 16x16x16 | -40.926482 | 0.001 |
| 20x20x20 | -40.926483 | 0 |
| 32x32x32 | -40.926483 | 0 |
In the quasi-harmonic approximation, the free energy is computed as a sum over the vibrational modes over a finite grid of k-points, which is similar to phonon DOS curves. According to the table 3, it can be concluded that the free energy keep varying and converge to -40.926483 eV as grid size increases, and the optimal grid size here should be 20x20x20, because it is accurate enough and takes shorter running time, and it is almost consistent with the optimal grid size calculated by phonon DOS before. The optimal grid energy size an be changed depend on the degree of accuracy. The error ΔA for each grid size compared with the free energy with 32x32x32 grid size is shown in table 3, therefore, the grid sizes appropriate for calculations accurate to 1 meV, 0.5 meV and 0.1 meV per cell are 2x2x2, 3x3x3 and 4x4x4 respectively by considering the compromise between accuracy and CPU time.
The Thermal Expansion of MgO

The Helmholtz free energy of MgO at each temperature between 0 to 1000 K is calculated with optimal lattice parameter as evaluated before using quasi-harmonic approximation. The Morse-like potential is applied in this case and the anharmonicity is restricted to thermal expansion.[8] There is an approximation that atoms only vibrates or move small displacement but it cannot be true for high temperature because the motion cannot be described as harmonic. The equation 3 of the Helmholtz free energy is shown as below: , where is the zero point energy, is the temperature and is the entropy. According to the figure 2 which shows free energy versus temperature, it can be seen that it is almost flat initially because the entropy term is quite small and the temperature-independent internal energy part dominates. As temperature keep increasing, the free energy decreases linearly with temperature because entropy part dominates gradually and the gradient corresponds to the positive entropy.
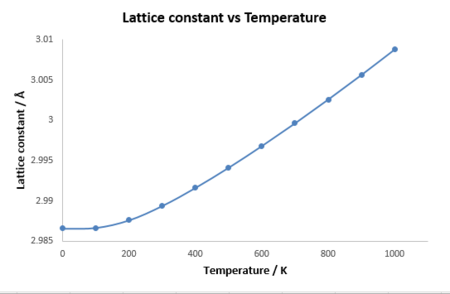
As shown in the figure 3, the lattice constant keeps increasing as temperature increases, because the lattice gains more internal energy and the vibrational energy or frequency increases, which means atoms vibrates with a larger displacement from the equilibrium position. Therefore, the lattice would expand to compensate it which causes thermal expansion. However, in a diatomic molecule with an exactly harmonic potential, the bond length would not change as temperature increases because equilibrium interatomic separation is always constant. Instead, the quasi-harmonic approximation applies a Morse-like potential, which makes the interatomic separation change possibly as temperature increases and higher vibrational levels are reached. Therefore, the quasi-harmonic approximation is more appropriate for simulating the thermal expansion process, but it is not capable of simulating melted MgO because the perfect lattice structure is destroyed and the ions no longer behave as harmonic motion, which means the quasi-harmonic approximation is not suitable anymore.
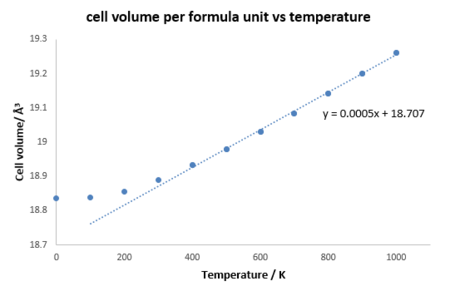
As shown in figure 4, cell volume per unit increases as temperature increases and initially the curve is parabolic but after 400 K, it shows a linear relationship. According to the linear region, the coefficient of thermal expansion for MgO in this simulation can be calculated from the equation 1 which is 2.843x10⁻⁵ K-1, and the literature value is 3.12x10⁻⁵ K-1(at 300 K).[9] And the coefficient remains almost constant after 400 K, therefore, the quasi-harmonic approximation simulates the thermal expansion with a percentage differemnce of 8.9 % compared with the literature, which is fairly accurate.
Molecular Dynamics
The Molecular Dynamic is mainly based on Mewton's second law and there are two important parameters timestep dt and cell size. The timestep needs to be long enough for efficient calculation of all vibrational modes but short enough for all possible vibrations to be sampled well and shorter CPU time as well. The cell size need to be large enough to generate sufficient number of vibrational modes, which is similar to the situation in the harmonic approximation, whereas MD is much expensive for large size than using quasi harmonic approximation, a cell containing 32 MgO units is used as a compromise between accuracy and efficiency.[4]
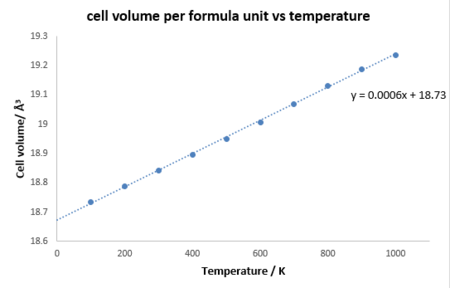
According to figure 5, it shows that the curve is completely linear from 0 to 1000 K, because the system is regarded as a purely classical model in MD and the zero-point energy is not taken into account. And the coefficient is calculated by equation by equation 1 to be 3.054x10⁻⁵ K-1, which is only 2.0 % deviated from the literature value at 300 K and more accurate compared with that from harmonic approximation. It could be explained that MD is more accurate at higher temperature and not much inaccurate at lower temperature compared with that of harmonic approximation at high temperature.
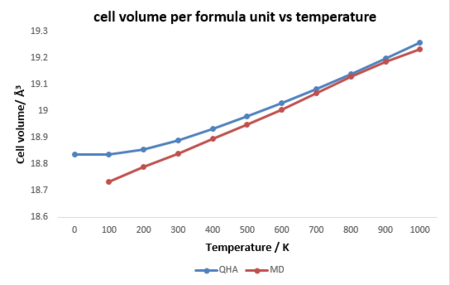
Figure 6 presents a comparison between two methods. It can be seen that after around 400 K, the two methods shows similar linear relationship, whereas quite significant difference occurs below 400 K. It needs to be mentioned that harmonic approximation is based on the harmonic vibrations, which should be only accurate below the melting point of the crystal, nut The MD is based on the random motion of atoms in reality which is non-harmonic. therefore, the harmonic approximation is more accurate at lower temperature as it considers the zero-point energy and most phonons in lower vibrational states lies within the harmonic region. Besides, MD cannot calculate the volume at 0 K because there is no random motion of particles. Contrarily, at higher temperature which reaches to or exceeds the melting point, the MD indicates a better accuracy, as the volume and lattice constant would keep increasing and MgO would melt and then evaporate which will increase the degree of random motion. However, the harmonic approximation is not accurate after the melting point as there is no harmonic vibrations between ions as mentioned before.
Conclusion
In conclusion, simulation of thermal expansion of MgO by quasi-harmonic approximation and molecular dynamics methods was conducted successful in this computational experiment. It can be concluded that MD methods shows a better accuracy than the quasi-harmonic approximation overall between 0 K and 1000 K, because the MD is more accurate at higher temperature, whereas the harmonic approximation is only accurate at lower temperature and has relative large deviations at higher temperature. Both methods have their individual advantages at certain temperatures, and each one compensates the other. Therefore, many different types of materials can be analyzed by these two methods selectively because they cover a sufficient large range of temperature where one or both of them are able to provide reliable results.
References
- ↑ http://www.ch.ic.ac.uk/harrison/Teaching/Thermal_Expansion/index.html
- ↑ Mei, AB; O. Hellman; C. M. Schlepütz; A. Rockett; T.-C. Chiang; L. Hultman; I. Petrov; J. E. Greene (2015). "Reflection Thermal Diffuse X-Ray Scattering for Quantitative Determination of Phonon Dispersion Relations.". Physical Review B. 92 (17): 174301. doi:10.1103/physrevb.92.174301
- ↑ Mark A. Shand (2006). The chemistry and technology of magnesia. John Wiley and Sons. ISBN 978-0-471-65603-6.
- ↑ 4.0 4.1 4.2 http://www.ch.ic.ac.uk/harrison/Teaching/Thermal_Expansion/Introduction.pdf
- ↑ 5.0 5.1 http://www.ch.ic.ac.uk/harrison/Teaching/L4_Vibrations.pdf
- ↑ L. Glasser and H. D. B. Jenkins, 2000, 632–638.
- ↑ http://www.ch.ic.ac.uk/harrison/Teaching/Thermal_Expansion/initial_energy.html
- ↑ M. Dove, Introduction to Lattice Dynamics, Cambridge University Press, 1993 5. Thermal Expansion of MgO Lab Script
- ↑ O. L. Anderson and K. Zou, J. Thermodynamic Functions and Properties of MgO at High Compression and High Temperarture. Phys. Chem. Ref. Data, 1990, 19, 69.

