Rep:Mod:MgO Hayley Weir 2413
Introduction
Experimental Aims
This experiment uses General Utility Lattice Program (GULP) to determine the lattice energy and the vibrational modes of the MgO crystal, followed by the free energy of the crystal and the thermal expansion coefficient. First the quasi harmonic approximation is used, followed by moleuclar dynamic calculations and finally the two methods are compared at high and low temperatures. GULP uses analytical solutions to perform simulations on 3 dimensional periodic structures.
Structure of MgO
In this experiment the structure of MgO is modelled by a lattice of Mg2+ and O2- atoms following a Buckingham repulsive potential [1].
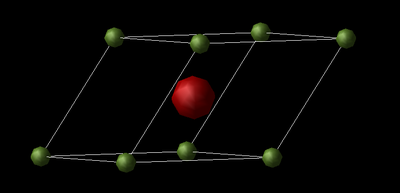
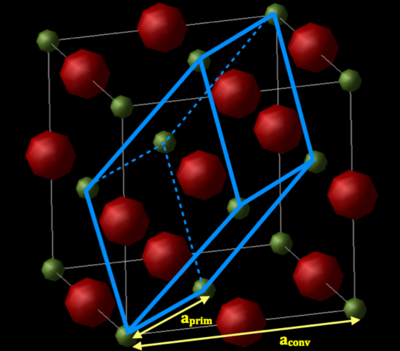
The MgO lattice is a simple face-centered cubic (FFC) structure with a two atom motif or as both an Mg2+ FFC and O2- FFC lattice displaced by 0.5 of the body diagonal. The lattice can be represented by the conventional cell or the primitive cell (a unit cell that contains only one lattice point). Images of both cells are shown below along.
 |
 |
The relationship between the conventional cell and primitive cells is shown below, where aconv and aprim are the conventional and primitive cell lattice parameters, respectively.
 |
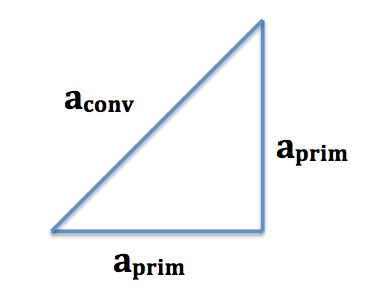 |
The relationship between aconv and aprim can be found using Pythagoras:
The conventional cell is described by a FFC structure and contains 2 atoms, and the primitive cell is a rhombohedron. FCC is one of 14 three dimensional Bravais lattice's. Bravais Lattices are described by an infinite array of points with the formulae . 3D Bravais lattices are characterised by the length of their sides (a,b,c) and the angle between each side (α, β, γ). In a FCC cell a = b = c and α = β = γ = 90° and for a rhombohedral lattice a = b = c and α = β = γ ≠ 90°.
Reciprocal Space
The reciprocal lattice is a term for the fourier transform of a lattice in direct space, also referred to as k space or Fourier space. The diagram below shows the change in lattice parameters from direct space to reciprocal space.
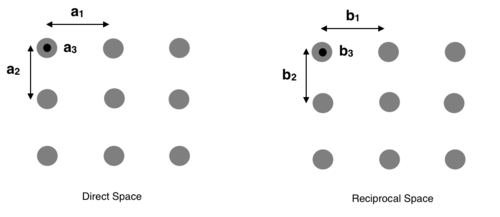
The Bravais Lattice equation in direct space is transformed to in reciprocal space, where
- and .
Therefore
- , and
are transformed into
- , and
This implies that as the size of a lattice in direct space increases, it's size is reduced in reciprocal space. In this experiment the Helmholtz Free Energy is measured as a function of grid size in reciprocal space. A schematic of the first 3 grid sizes is shown below. It can be seen that as the grid size increases the size of the cells are reduced, hence it is given the name shrinking factor. In direct space the grid increases in size. As the shrinking factor increases more k-points are measured and so more detail is uncovered: 1x1x1 measures 1 k-point, 2x2x2 measures 4 k-points, 3x3x3 measures 9 k-points etc. [2]

From the diagram above it is clear that at large shrinking factors there is very little space between each k-point and so there will be little more information gained. Therefore it is clear that there will be an optimum shrinking factor at which the calculation is most efficient and uncovers all of the information. This optimum shrinking factor is calculated in this experiment.
k-points are used to determine the energy of a configuration of orbitals.
where is the wavelength. If all the orbitals are in phase then and so and if the orbitals are out of phase then and so . The former is the lowest energy conformation and the latter is the highest energy conformation.
There are many advantages of working in k space. These include:
- X-ray diffraction can be used to determine the electron density plot by relating the scattering intensities to the Fourier coefficients. This leads to information about the structure of a crystal.
- Every phonon mode has a corresponding k vector which can be plotted against the frequency to give the band structure
Harmonic Oscillator and Quasi Harmonic Approximation
The harmonic oscillator follows the distribution
- .
It is a good approximation close to the equilibrium, however it is inaccurate away from equilibrium. The vibrational energy of a system is quantised and is given by
- .
The free energy of the quasi harmonic approximation (QHA) is
The first term corresponds to the internal energy, the second is the sum of the zero point energies, given by
and the final term corresponds to the entropy, which is given by
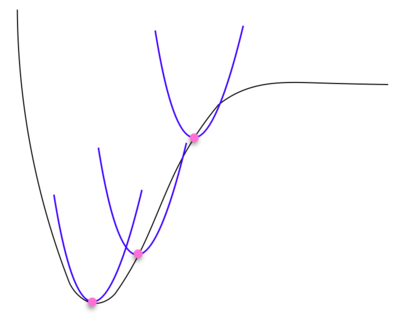
The key difference between the harmonic approximation and the quasi harmonic approximation is that the quasi harmonic approximation is dependent on volume since the harmonic oscillator model fails to explain thermal expansion. The harmonic approximation holds for each volume. A diagram describing the quasi harmonic oscillator at pink spots along distribution with corresponding blue harmonic oscillator is shown below.
The energy of the quasi harmonic approximation is calculated by summing over all the energies of each k-point (every vibrational mode of the crystal). It is therefore necessary to find the grid size that includes every vibrational modes k-point.
Phonons
A phonon is a discrete unit of vibrational energy, much like a photon is to light. It arises from a collective vibration in the bonds between the infinite array of atoms that make up a lattice. These atoms oscillate at a single frequency. They have both wave and particle like properties and each phonon mode is separated by .
Thermal Expansion
Thermal expansion refers to the change in shape, area and volume of a material through increase in thermal energy. In this experiment the thermal expansion coefficient is calculated: the relative change in size per degree change in temperature at constant pressure. Here we consider the volumetric thermal expansion coefficient, and since we are interested in a solid we can assume that pressure is constant and so = where is the volume at 0 K, is the pressure, is the temperature and is the change of volume with respect to temperature.
From the equation it can be deduced that the faster the volume changes with temperature, the larger the thermal expansion coefficient. It is important to note that av is intrinsic as it is divided by volume.
Internal Energy
The structure of MgO consists of an infinite array of primitive cells shown in the jmol below. As discussed earlier, the primitive is rhombahedral and it can be seen from the jmol below that the lattice parameter, a = b = c = 2.9783 Å, and α = β = γ = 60°. Using the relation derived earlier, the FFC conventional lattice parameter is calculated to be 4.2120 Å.
The binding energy of the MgO crystal was calculated to be -41.1 eV per primitive cell. This is the energy required to move every ion in the crystal to infinite separation.
Calculating the phonon modes of MgO
Dispersion curve
A dispersion curve shows a plot of frequency vs k-point. Particular k-points have high symmetry. These are called symmetry points, a list of the symmetry points for FFC lattices and their meaning are given below. It is worth noting that Г is the origin in k-space[4].
| Symmetry Point | Direct space (x,y,z) | k space (kx, ky, kz) |
|---|---|---|
| Г | (0,0,0) | (0,0,0) |
| X | (0, , ) | (0, , ) |
| W | (, , ) | (, , ) |
| L | (, , ) | (, , ) |
| U | (, , ) | (, , ) |
| K | (, , ) | (, , ) |
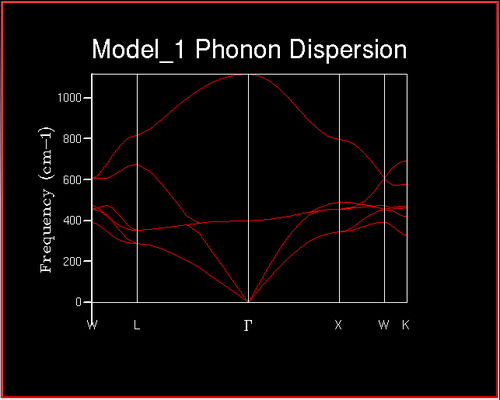
The upper branch is called the 'optic branch' and corresponds to the atoms move opposite to each other, and the lower branch is the acoustic branch which corresponds to the atoms moving in phase with each other with the same amplitude and direction.
Density Of States
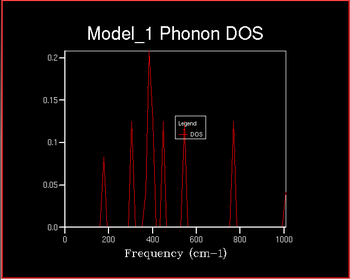
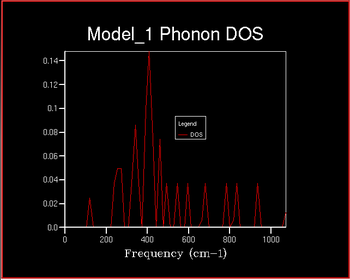
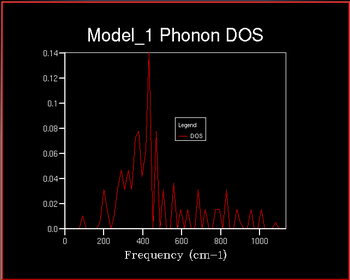
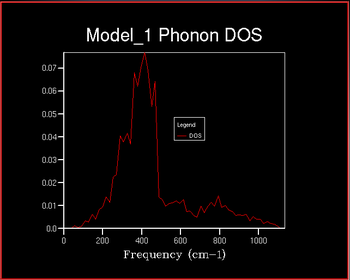
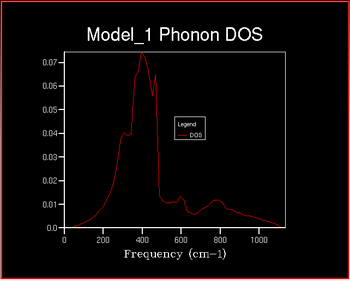
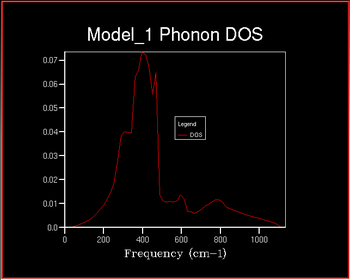
The Density of States (DOS) describes the number of available electron (or hole) states per unit energy at a given energy. The density of states vs the frequency was investigated with increaseing shrinking factor . The shrinking factor represents the the grid of k points and the DOS curve is . A schematic of this is shown below of increasing shrinking factor in reciprocal space. Unlike in k space, the grid increases in size in direct space. The x-axis on the DOS graph corresponds to the y-axis on the dispersion curve: they are both frequency.
The x-axis on the DOS graph corresponds to the y-axis on the dispersion curve: they are both frequency. It can therefore be deduces that the given that the density of States for the 1x1x1 grid corresponds to a single k point it can be determined which symmetry point this corresponds to from the dispersion curve. There are peaks at frequencies of ~ 290, 360, 680 and 810 cm-1. Comparing this to the dispersion curve it can be seen that these frequencies correspond to the symmetry point L.
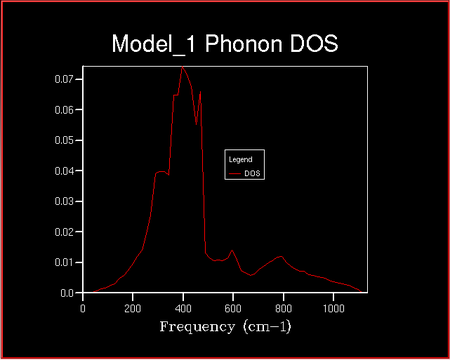
It can be seen that as the shrinking factor increases at small integers the DOS function significantly increases in complexity. As the shrinking factor increases further the DOS tends towards a constant distribution. The optimum shrinking factor gives the desired distribution and takes the least amount of time. By visual inspection of the graphs above it can be seen that this optimum shrinking factor is between 24 and 48. After further investigation the 26x26x26 shrinking factor was found to be the most efficient, shown below. DOS computed with shrinking factors greater than 26 give the same result as the 26x26x26 grid, however they are more expensive. DOS computed with shrinking factors less than 26x26x26 lack the full detail of the true DOS graph.
It is likely that this would also be the optimum grid size for CaO since both Ca and Mg are in the 2+ oxidation state and O in the 2- oxidation state, in a 1:1 ratio and so the ions are of roughly the same size. It is unlikely that the above grid size can be used to approximate either a Zeolite (e.g. Faujasite) or a metal (e.g. Lithium) lattice. This is due to the lattices in direct space being much larger and much smaller, respectively (and the reverse in reciprocal space).
Computing the Free Energy
The lattice energy was calculated for each integer grid up to 25 at 300 K to determine in a more accurate way which was the optimum grid. A graph of the energy vs grid size is shown below.
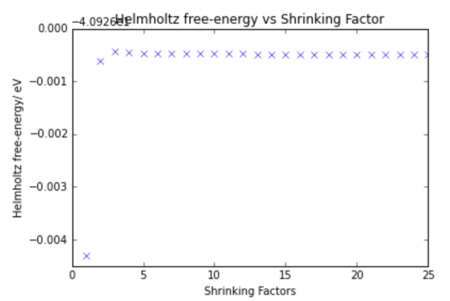
The difference in energy from the correct lattice energy of MgO is given below.
| Shrinking Factor | Energy per unit cell/ eV | Difference from Actual Value/ meV |
|---|---|---|
| 1 | -40.930301 | 3.82 |
| 2 | -40.926609 | 0.126 |
| 3 | -40.926432 | -0.0510 |
| 4 | -40.92645 | -0.0330 |
| 5 | -40.926463 | -0.0200 |
| 6 | -40.926471 | -0.0120 |
| 7 | -40.926475 | -0.00800 |
| 8 | -40.926478 | -0.00500 |
| 9 | -40.926479 | -0.00400 |
| 10 | -40.92648 | -0.300 |
| 11 | -40.926481 | -0.00200 |
| 12 | -40.926481 | -0.00200 |
| 13 | -40.926482 | -0.00100 |
| 14 | -40.926482 | -0.00100 |
| 15 | -40.926482 | -0.00100 |
| 16 | -40.926482 | -0.00100 |
| 17 | -40.926482 | -0.00100 |
| 18 | -40.926483 | 0 |
| 19 | -40.926483 | 0 |
| 20 | -40.926483 | 0 |
| 21 | -40.926483 | 0 |
| 22 | -40.926483 | 0 |
| 23 | -40.926483 | 0 |
| 24 | -40.926483 | 0 |
| 25 | -40.926483 | 0 |
As expected the accuracy of the energy increases with increasing shrinking factor until it converges towards the correct energy, It can be seen from the table that:-40.926483 eV per cell 2x2x2 is accurate to both 1 meV and 0.5 meV and 3x3x3 is accurate to 0.1 meV per cell. Based on the results from the table it shows that the 18x18x18 grid is the optimum grid size as it is the smallest shrinking factor that gives the correct energy. This is likely to be a more accurate optimum shrinking factor that that calculated perviously by visual inspection.
Unlike in the pervious section, the Helmholtz Free-energy calculations are dependent on the interaction energies between atoms and therefore the MgO calculation is not applicable to other systems.
Thermal Expansion of MgO
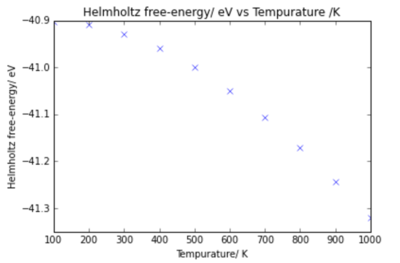
The MgO lattice was optimised at temperatures between 0 K and 1000 K using the 18x18x18 grid size. Plots of the energy variation and lattice parameter with temperature are shown below.
 |
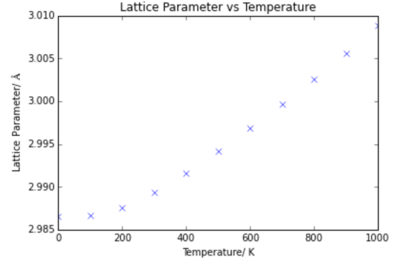 |
From the plots it can be seen that the energy decreases with temperature, and the lattice parameter increases with temperature. These results were calculated using the Quasi- Harmonic Approximation, discussed previously.
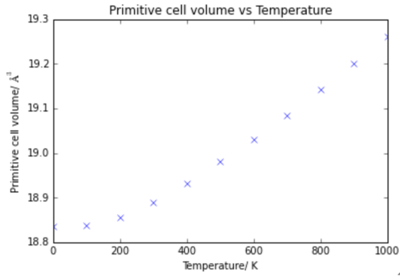
To determine the thermal expansion coefficient for MgO the volume was plotted against temperatures.
 |
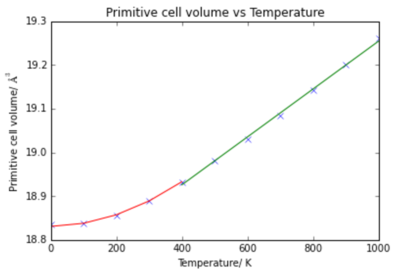 |
It can be seen that there are two sections of the graph: 0 K - 400 K shows non-linear dependance, and from 400 K - 1000 K there is linear dependance. Appropriate trend lines were plotted: quadratic from 0 - 400 K (red) and linear from 400 - 1000 K (green).
0 - 400 K
Between 0 K - 400 K the volume follows quadratic dependance with temperature according to the relationship:
and so to find the thermal expansion coefficient we take the derivative of this equation:
and therefore, as
the equation for the volumetric thermal expansion coefficient is
Since = 18.680416 Å3,
It can be seen that in this temperature range, the thermal expansion coefficient is dependent on temperature. A plot of thermal expansion coefficient is shown below.

400 - 1000 K
Between 400 K and 1000 K the volume changes linearly with temperature. The equation for this linear trend line is
and so
and therefore the volumetric thermal expansion coefficient is
Here it can be seen that the thermal expansion coefficient is independent of temperature. The compares to a literature value of at 1000 K[5]. This gives relatively good agreement with the calculated value.
Assumptions
The main assumptions used in this calculation are:
- the Mg ions are charged 2+, and the O ions are charged 2- and assume the 'hard sphere model'
- The Born-Oppenheimer approximation. This assumes that the nuclear and electronic wavefunctions can be separated
- There are no election - electron interactions.
If a diatomic molecule follows an exact harmonic potential the equilibrium bond length has no dependence on temperature and remains constant. In the above calculations the quasi harmonic approximation is used where the bond length does change with temperature, as described in the introduction. The calculations do not take into account phase transitions as the QHA does not account for bond breaking so the phonon modes are not a good representation for the actual modes of the ions.
Molecular Dynamics
Molecular Dynamics (MD) were used to reproduce the results calculated with the quasi harmonic oscillator. A 32 unit supercell was used for the MD calculations as, if a single MgO cell was used, as in the QHA calculations, every cell of the crystal would be in phase and give meaningless results. 32 units were used as to give a good compromise of accurate results vs inexpensive calculations. From the calculations so far, a reliable cell would be 18x18x18 grid which gives 5832 units, however this is very large and so would be a very expensive calculation compared to the 32 unit cell.
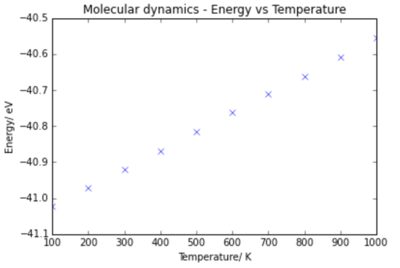
Graphs of the Energy vs Temperature and Volume vs Temperature are shown below.
 |
 |
Using Molecular dynamics, the volume shows a linear dependance on temperature. The equation of the dependance is:
and so since for the MD calculation (found by extrapolating trend line to 0 K), the thermal expansion coefficient is calculated to be
This is a very similar thermal expansion coefficient to that calculated with the QHA.
Comparison of Molecular Dynamics and Quasi-Harmonic Approximation
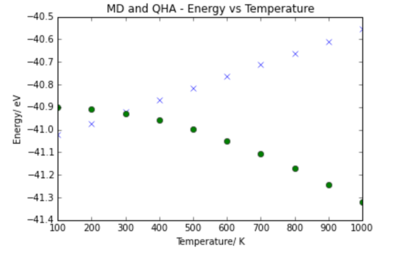
A comparison of the energy vs temperature and energy vs volume graphs for the Quasi-Harmonic approximation and Molecular dynamics is shown below.
 |
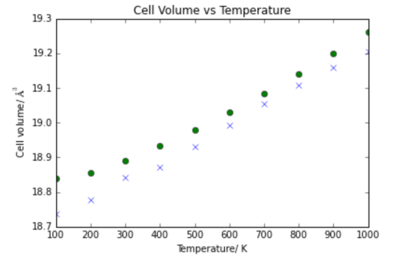 |
The volume vs temperature relationship for QHA and MD show similar trends and at high temperatures tend towards the same relationship. This is the reason for the high similarity in thermal expansion coefficient. If the temperature continued to increase and the volume followed the same trend the lattice would become infinitely large.
It can be seen that the molecular dynamics predicts an increase in energy with temperature, and the quasi harmonic approximation proedicts a decrease in energy with temperature. This can be explained by looking at the difference between each approach. The key difference between the Molecular dynamics calculations and the QHA calculations is that MD assumes the classical behaviour and QHA assumes quantum behaviour. The energy in classical thermodynamics is given by the equipartition principle
hence the graph has a linear regression of energy with increasing temperature. This is in contrast to the QHA, which uses quantum mechanics and so the Helmholtz free energy, is given by
which directly contradicts the classical approximation as here energy decreases linearly with increased temperature.
It is concluded that since the harmonic oscillator is only an accurate model close to equilibrium, is it only valid at low temperatures as the system may have enough energy to be far away from the equilibrium value. Therefore at high temperatures the classical approach is used. At low temperatures however the system is likely to be close to equilibrium and so the quantum harmonic oscillator is an accurate description. Unlike in the MD calculations, the QHA also has a zero point energy which is very important to the behaviour of the system. Therefore at low temperatures, the quantum approach is used.
Conclusion
This experiment has explored the properties of the MgO crystal. The temperature dependance on the energy was determined, and the thermal expansion coefficient was calculated using both the QHA and MD. The thermal expansion coefficient was found to be very similar for both the MD and QHA calculations at high temperatures, however the energy vs temperature graphs gave directly oposing relationships. This was due to the difference in classical and quantum approaches. It was concluded that the QHA was a good approach at low temperatures, and MD was a good approach at high temperatures.
References
- ↑ http://pubs.rsc.org/en/content/articlepdf/1994/JM/JM9940400831
- ↑ Hoffmann R. How Chemistry and Physics Meet in the Solid State. NY: Cornell University, Department of Chemistry and Materials Science Center ; 1987.
- ↑ Wu Z, Wentzcovitch RM. An efficient method to calculate the anharmonicity free energy. Minneapolis,: Minnesota Supercomputing Institute, (Department of Chemical Engineering and Materials Science.
- ↑ http://www.pa.msu.edu/people/tomanek/PHY971/homework/kpts.html
- ↑ Taylor RE. Thermal Expansion of Solids Ho CY, editor.Materials Park: ASM International; 1998.


