Rep:Mod:MgO GloriaRosetto96
The Free Energy and Thermal Expansion of MgO
Abstract
The volume and linear thermal expansion coefficient of Magnesium oxide were computed between 0 and 1000 K using two different models, namely the Quasi-Harmonic Approximation (QHA) and Molecular Dynamics (MD). The QHA uses vibrational energy levels to compute the free energy of the system and predict how it expands with increasing temperature, whereas the MD simulates the actual vibrational motions of the atoms. The methods were compared and contrasted based on the nature of the models, and their results were compared to experimental literature values. An optimal grid size of 20x20x20 was first established for calculations of the QHA, proving a reasonable balance between the processing time and accuracy of output values. The volume thermal expansion coefficient was found to be for the QHA and for molecular dynamics.
Introduction
Magnesium oxide, also known as periclase, is found in the Earth’s lower mantle in solid solution with FeO [1]. MgO has a cubic NaCl-type structure, with equal lattice parameters and an angle of 60° between them. Due to its high symmetry, this mineral has been used as a substance for testing and improving new crystallographic techniques [2]. The linear and thermal expansion coefficients have been found experimentally by various groups (for example, Campbell 1962; Touloukian et al. 1977; Suzuki 1975) [1] through X-Ray diffraction techniques, or by empirical approaches. In this investigation, a computational approach has been used to evaluate thermodynamical properties of MgO. Computational studies have become important to provide reasonably accurate descriptions of materials by using quantum mechanical approximations and interatomic potentials. However, there are always limitations to these models and to what extent they are able to accurately describe a system and its bulk properties. In this investigation, the Quasi-Harmonic Approximation (QHA) and Molecular Dynamics (MD) were used to explore the thermal expansion of MgO, and whether or not they are suitable for the system and under the parameters used.
Methodology
The coefficient of thermal expansion was found using two different approaches: the Quasi Harmonic Approximation (QHA) and from Molecular Dynamics (MD). QHA uses the phonon dispersion relation and vibrational density of states (DOS) to find how the cell expands when the temperature is increased, while MD uses classical mechanics to simulate how the atoms vibrate as kinetic energy is applied to the system. In both cases, the thermal expansion coefficient was calculated using the definition of the property at constant pressure:
Where is the volumetric expansion coefficient, V0 is the volume of the cell at 0K, and V is the volume and T is the temperature. The approximation uses state functions as mathematically the interval between points is small. In literature, the linear thermal expansion is often reported, where the change in lattice parameter is measured instead of volume. The equation is then given by
,
where L lattice parameter and L0 is the lattice parameter at 0 K.
The program DLVisualize was used as a visualisation tool, and GULP (General Utility Lattice Program) was used to run the simulations.
Quasi-Harmonic Approximation
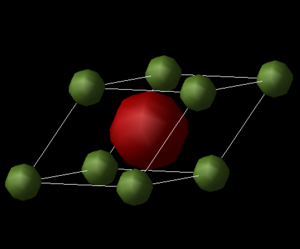
This method originates from the harmonic approximation, where the system is described by a harmonic oscillator which has a parabolic potential energy curve. The atomic vibrations can be expressed as the superposition of vibrational modes [3]. In this model, the equilibrium distance between atoms does not change with a change in temperature, and hence does not allow for a material to expand upon heating. This approximation holds for systems at low temperatures where the vibrational energy is small compared to the cohesive energy[3]. In the QHA, the potential is still parabolic, but the equilibrium distance is allowed to change when thermal population of vibrational modes increases. A primitive MgO cell was used (Figure 1) as all the phonon vibrations can be described from it. Firstly, The phonon dispersion relation was computed using the high symmetry points W-L-G-W-X-K in k-space and taking 50 steps along the path. The photon density of states at 0K as well as the free energy of the system at 300K were then found for several shrink factors in order to establish the most suitable grid size for the following calculations. The shrink factor determines the number of k-points sampled from the Brillouin Zone (BZ); the greater the shrink factor, the more accurate the output. A 1x1x1 grid would only sample 1 k point, a 2x2x2 grid would sample 4 points, a 3x3x3 grid would sample 18 points, and so on. The shrinking factor 20x20x20 was chosen as best parameter, and was used to optimise the geometry of the MgO cell at temperatures from 0 to 1000K in steps of 100K. The optimisation involves finding the minimum free energy with respect to the volume at a given temperature. In the QHA, the Helmholtz Free Energy (F) is a sum of the the static total energy and vibrational free energy over all k-points [4] , and is given by:
Where E0 is the internal energy, the second term is the vibrational zero point energy of the lattice, is the k-vector, is the frequency of the jth phonon mode at in the BZ, T is the absolute temperature, and the final term represents the vibrational degrees of freedom [5]. The zero-point energy is the remnant energy of the system at 0K. can be found by finding the slope of a V vs T graph, and similarly from a L vs T graph.
Molecular Dynamics
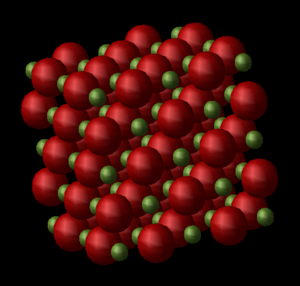
MD relies on Newton's Second Law, . In the absence of external forces, the derives from the particle's potential, which is the sum of pairwise potentials given by the Leonard-Jone potential [6]. The curve shows that the potential is strongly repulsive at small interatomic distances, but reaches a minima at the equilibrium bond length, and shows asymptotic behaviour when atoms are pulled further apart as it reaches a dissociation limit. This model allows for bonds to break as the distance between atoms increases, and becomes important when discussing the crystal's behaviour at higher temperatures. At every timestep of the simulation, the velocity and the forces on each atom are computed. A 2x2x2 supercell of MgO consisting of 64 atoms was used (Figure 2) to simulate the atomic vibrations. A larger cell is required for this model as the system requires higher vibrational degrees of freedom to obtain information about the collective movements of atoms within the crystal; a primitive cell is not able to describe these vibrations in real space. A temperature between 0 and 1000 K was set, at which the system was allowed to equilibrate to a certain geometry over a period of time. Data was sampled and averaged after 5 timesteps of 1 fs, with 500 equilibrium steps before running 500 production steps. Fluctuations in the properties recorded are present in the data collected, which would reproduce a Gaussian distribution, but since an average over many data points is selected, they are not that important.
Results and Discussion
Phonon Dispersion Relation and Density Of States
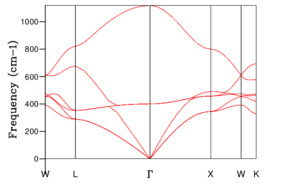
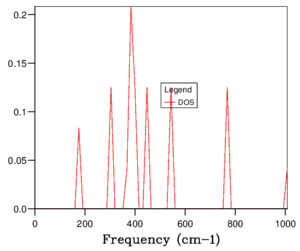
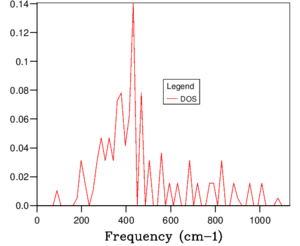
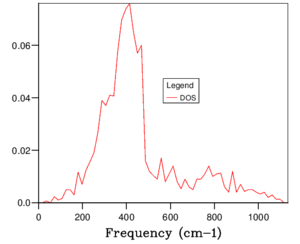
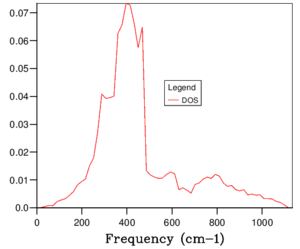
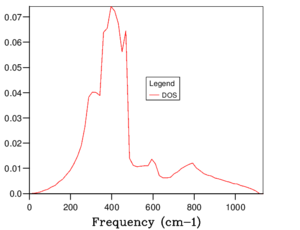
The phonon dispersion relation generates 6 bands (Figure 3), which can be predicted as there are 2 atoms in a the primitive cell with 3 degrees of freedom. The bands that lead to 0 at the symmetry point are the acoustic branches, whereas the other are the optical branches. The phonon dispersion finds the variation in frequency between different k-points, where the chosen number of steps was 50. The suitable grid size for the geometry optimisation calculation was chosen based on the convergence of the phonon DOS curve and the free energy of the system, as well as the CPU time. The free energy converges at a 20x20x20 grid as seen in Table 1, but the DOS curve appears to be subjectively smoother at a 40x40x40 grid size (Figure 4), sampling 32000 k-points. While the DOS curve appears smoother, in the end the convergence of free energy is what matters the most as it is summing the frequency of every k-point and is used later to optimise the geometry of the system. Therefore, a 20x20x20 grid size samples sufficient k-points to produce an accurate representation of the system. The CPU time was just under 1 minute, which is relatively fast.
| Grid Size | Free energy (eV) |
|---|---|
| 1x1x1 | -40.930301 |
| 2x2x2 | -40.926609 |
| 3x3x3 | -40.926432 |
| 4x4x4 | -40.926450 |
| 5x5x5 | -40.926463 |
| 10x10x10 | -40.926480 |
| 20x20x20 | -40.926483 |
| 25x25x25 | -40.926483 |
For a similar system such as CaO, which has slightly larger lattice parameters as Ca is larger in size compared to Mg, the grid size required for this calculation would be roughly the same. For a much larger system such as a zeolite, for example faujasite, a smaller grid size is needed. This is because a greater lattice parameter leads to a smaller BZ in k-space, meaning that less k-points are required to obtain the same information as in the case of MgO.
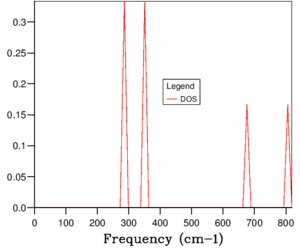
For a 1x1x1 grid, a single k-point k=(0.5, 0.5, 0.5) was selected by the program, which represents the symmetry point L at the centre of the BZ. The phonon DOS can be related to the dispersion relation as you can trace the peaks to the frequencies at which the k-point L intersects the bands on the dispersion relation. At two frequencies the peak is double in size as there are two states with the same frequency. However, 1 k-point is not sufficient to count the energy levels of the 6 branches. As the shrink factor is increased, more features appear on the DOS, and the curve is smoother (Figure 4). The DOS essentially counts the number of states corresponding to a value of k at a given frequency, and it's clear from the 40x40x40 grid size that the density is highest between 300 and 500 cm-1.
Free Energy and the Quasi-Harmonic Approximation
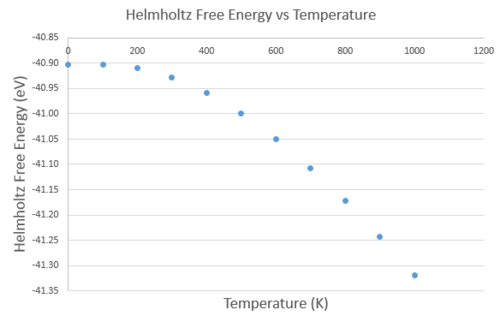
A plot of free energy vs temperature shows that the free energy decreases as temperature increases (Figure 5). This can be related to the equation for Helmholt's Free Energy introduced in the methodology, where the third term relates to the entropy of the system. As temperature increases, phonons from the ground state distribute over higher vibrational energy levels, and thus the multiplicity and entropy of the system increases. The population of higher thermal states is also accommodated by an increase in lattice parameter, as seen in a plot of lattice parameter vs temperature (Figure 6), as the system's equilibrium bond length is shifted. The volume coefficient of thermal expansion was found from the gradient of a volume against temperature graph of the system, divided by the volume at 0 K V0 in order to normalise the measurement. The first 3 points at 0, 100 and 200 K were discarded from the calculation of as they do not follow a linear relationship like the rest of the data; they all have the same volume. These points at low temperature, as mentioned in the methodology, have a low vibrational entropic contribution and the system behaves as a regular harmonic oscillator and hence the volume does not change. The result is , where the V0 used was the extrapolated y-intercept . Additionally, the was found to be .
 |
 |
Molecular Dynamics
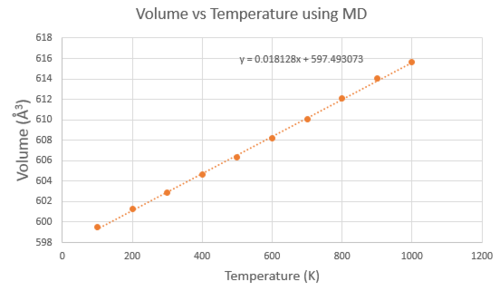
The MD calculation also involved a volume vs temperature plot (Figure 7), where the V0 term used was the volume at 0 K extrapolated from the graph, 597.493 Å3. The value of was found to be 3.033x10⁻⁵ K-1, and for it was 1.000x10⁻⁵ K-1. There were no deviations in linearity at lower temperatures, however it was not possible to run the computation at 0K as the zero point energy of the system is not considered and there is no kinetic energy to simulate vibrations. The limitation on MD is the size of the cell- the 2x2x2 supercell only takes into account the dynamics of 64 atoms, and therefore does not give a very accurate description of the crystal. To find the optimal cell size, the simulation should be computed with several bigger systems until the values of properties converge. The problem is that the CPU times increase and it will take too long to collect data for several temperatures. Since a 20x20x20 cell was able to accurately describe the density of states in reciprocal space, a 20x20x20 supercell would be required to identify the configurations that correspond to the same amount of vibrational modes.
Comparison with literature value and between methods
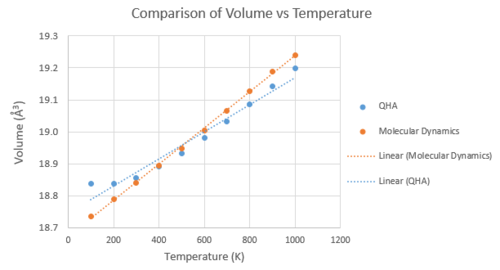
The experimental value for volume coefficient of thermal expansion is 1.39 x 10⁻⁵ [7], found between 25 and 1000 K, which is much smaller than the values found in this computational study. This difference can be attributed by the two approximations made in the models. The first is the fact that the model is using a perfect, infinite crystal, without defects, although at lower temperatures it has negligible effect as the thermal equilibrium defect concentration is low [8] . In any case, defects would weaken ionic interactions, which would lead to a greater thermal expansion coefficient. The second and most significant approximation is that the atoms are charged spheres of pure ionic character, with no sharing of electrons. In reality there is always some covalent character, and this would be reflected on how the material would expand; the expansion would be more difficult. The difference in between the two models displayed in Figure 8 is due to the difference in the approximation of their potential energies and how the system behaves at higher temperatures. The molecular dynamics model uses interatomic potentials with a dissociation limit (the Lennard Jones Potential) and thus introduces anharmonic effects which are not taken into account in the QHM model. Running the calculation at temperatures above 1000 K shows that the linear relationships start to deviate. As the system approaches its melting temperature, the atoms will become further apart. These high temperature anharmonic contributions are also seen experimentally, at a particular critical temperature (TC) at which the normal modes of the lattice are fully excited and there is a significant interaction between point defects and phonons [8]. Above the TC, the thermal expansion coefficient no longer varies linearly with temperature, and is parabolic in shape. In fact, in literature it is often reported for different temperatures. The main advantage of the QHA is that due to the periodicity of the crystal, the thermodynamic properties can be efficiently computed in reciprocal space [9], while in MD the same level of accuracy would require a much larger supercell leading to a greater unfavourable computational expense.
Conclusion
This study has highlighted the main features of the Quasi-Harmonic Approximation and the Molecular Dynamics models, and their advantages and drawbacks. The QHA is a fast computational method which is limited at high temperatures. The MD model shows a better approximation at higher temperatures but its accuracy is limited to the size of the supercell. Both models use the approximation that the interaction between Mg and O ions is purely ionic, which is why they produce a larger value for the thermal expansion coefficient compared to the literature experimental value. In further investigations, the computational models can be used to investigate other properties under different conditions, for example the effect of properties at extreme temperatures and pressures where no experimental techniques can operate at. With the knowledge of the DOS, other thermodynamic properties such as the heat capacity can be calculated.
References
Template loop detected: Template:Reflist
- ↑ 1.0 1.1 L.S. Dubrovinsky and S.K. Saxena, Phys. Chem. Minerals, 1997, 24, 547-550
- ↑ R. M. Hazen, Am. Mineral, 1976, 61, 266-271
- ↑ 3.0 3.1 C.Y. Ho, R. E. Taylor, Thermal Expansion of Solids, ASM International, 1998
- ↑ T. Tohei et. al, Mater. Trans., 2015, 56, 1452-1456
- ↑ S. Baroni et al., Rev. Mineral. Geochem., 2009, 71
- ↑ http://www.phys.ubbcluj.ro/~tbeu/MD/C2_for.pdf
- ↑ Y.S. Touloukian, R.K. Kirby, R.E. Taylor, T.Y.R. Lee, Thermophysical properties of Matter, IFI/Plenum, New York, vol. 13, 1977,p. 288
- ↑ 8.0 8.1 R. Reeber, K. Goessel and K. Wang, Eur. J. Mineral, 1995, 7, 1039-1047
- ↑ H. Zhao et al., J. Appl. Phys., 2006, 99

