Rep:Mod:MgOLY2412
Introduction
Computer simulation has been proved to be an extremely useful tool in predicting the structures and properties of solids. Over the past few decades, the speed and accuracy of computer simulation has been greatly improved, and sometimes it can even give guidelines to experimental scientists.
In this experiment, the structures, internal energies and vibrational modes of MgO crystal were investigated using computational code, General Utility Lattice Program (GULP) , and visualised using DL Visualize. GULP was originally written by J.D. Gale back in 1990s and further developed in subsequent years. GULP is known for its ability of conducting different types of simulations at low computational cost.[1]
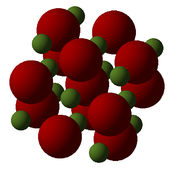
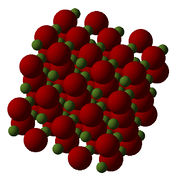
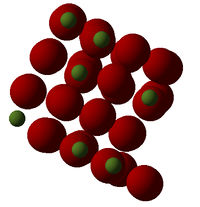
Two input files of MgO crystals were provided and shown in Figure 1, both of which were pre-optimised at 0 K. The left one is a conventional cell of MgO which contains four Mg and four O atoms and the right one is a super cell of MgO which has cell parameters two times as large as the conventional cell in each dimension. i.e. the super cell contains 32 Mg and 32 O atoms. The cell parameters of these two are exactly the same and summarised below in Table 1. The supercell is only used in the final step molecular dynamics calculation, whereas the conventional cell is used for the rest of this experiment.
| primitive cell | conventional cell | super cell | |
|---|---|---|---|
| a=b=c (Å) | 2.978 | 4.212 | 8.424 |
| α=β=γ (°) | 60.000 | 90.000 | 90.000 |
The most fundamental approximation embedded in all the calculation performed here is assuming that the Mg2+ and O2- ions are hard charged spheres and the only two interactions between them are the electrostatic interaction and Buckingham repulsive interaction.
Apart from the lattice energy and the phonon dispersion, by calculating the cell volume of MgO at different temperatures using both quasi-harmonic and molecular dynamics approaches, we can also determine the thermal expansion coefficient of MgO crystal, which is the final target of this experiment.
Results and Discussion
Lattice Energy of MgO
A single point energy calculation was performed on MgO crystal to obtain its total internal energy, which is essentially the same as lattice energy, at 0 K. The lattice energy obtained from this calculation is -41.0753 eV/primitive cell or -3963.14 KJ/mol which is not too far from the value determined using Born-Haber cycle - 3791KJ/mol at 298 K[2], and this indicates that the combination of Coulombic force and Buckingham repulsive potential is a relatively adequate approximation to the real interactions between Mg2+ and O2- ions in MgO crystal for the purpose of internal energy calculation.
Phonon Dispersion Curve and DOS
The phonon dispersion curve of the MgO crystal is calculated and shown below in Figure 2. It is clear to see that the dispersion curve of MgO is consisted of 6 bands which can be explained by the total number of two atoms in a primitive cell of MgO as each atom can form 3 bands corresponding to the tree dimensions in which an atom can vibrate.

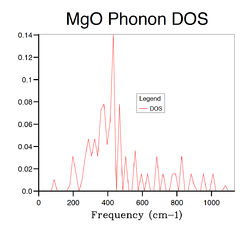
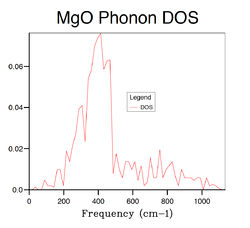
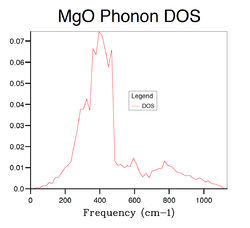
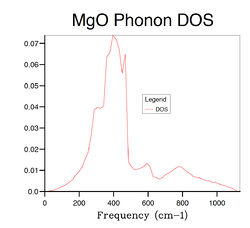
Several phonon DOS calculation are performed with different grid size varying from 1×1×1 to 32×32×32. The results are summarised in Table 2 below . When the grid size is 1×1×1, the DOS is consisted of 4 discrete peaks, and this is because the DOS is only calculated at one k point which is identified as L point with fractional coordinates of (1/2 1/2 1/2) from the log file of the calculation. By examining the L point on the dispersion curve, one can see that it crosses the dispersion curve at four frequencies, around 280,360,670 and 810 cm-1, respectively, which matches the frequencies on the phonon DOS computed with 1×1× grid. However, the first two frequencies consist of two degenerate vibrational modes and hence they have twice as large densities as the latter two, which is again consistent with the 1×1×1 DOS graph. The reason that GULP chooses L point for single k point DOS calculation is because that it generally gives better results than any other points due to its central position in k space. As the grid size increases, more peaks appears and finally merge into a continuous function when the grid size reaches 16×16×16. Hence the 16×16×16 grid can be seen as the minimum requirement for DOS calculation of MgO crystal. Comparing the DOS computed from 16×16×16 grid with the ones calculated from smaller grids, there is a significant decrease in the quality of the DOS as a large portion of vibrational frequencies can not be sampled with smaller grids. On the other hand, when the grid size is larger than 16×16×16, the computational time becomes an emerging expense accompanied by limited improvement on the DOS. The phonon DOS is generally inversely proportional to the gradient of the dispersion curve. This is because, the flatter the dispersion curve, the more vibrational modes there are at a given frequency range. This should be consistent with the relationship between electronic band structure and its DOS of any solid.[3] Another factor that can influence the DOS is the degree of degeneracy. The more degenerate phonon levels there are at a given frequency, the higher the DOS. The phonon DOS of MgO has a maximum at around 400 cm-1, and if we look at this frequency on the phonon dispersion curve, we see both superimposed and flat bands.
The optimal grid size for MgO would be appropriate for a similar metal oxide such as CaO. This is because both of them have the same crystal structure, face-centred cubic, and similar lattice parameters, 4.212 vs. 4.800 Å [4], in conventional cells, which means that their cell parameters in reciprocal space would be similar, as a*=2π/a, where a and a* are lattice parameters in real and reciprocal spaces respectively. Therefore similar number of k points is needed to calculate the phonon DOS of CaO. On the other hand zeolite lattice has much larger lattice parameters in real space, typically in the order of 10 Å, which means that a zeolite lattice generally has smaller lattice parameter in reciprocal space, and this results in less k points being needed to calculate the phonon DOS. Therefore a smaller grid should be sufficient for a crystal of zeolite structure. On the contrast, a pure metal lattice such as Lithium, generally has smaller cell parameter in real space, 3.489 Å in the case of Lithium[5], therefore it has larger lattice constant in the reciprocal space, leading to a larger grid being required in order to sample as many k points as possible.
Helmholtz Free Energy of MgO
The Helmholtz free energy of the given MgO crystal was computed at 300 K with different grid sizes. As can be seen from Table 3 below, the difference in energy between adjacent grids decreases as the grid size increases which means that the accuracy of the calculation increases. The difference between the energy calculated from the 2×2×2 grid and that from the 4×4×4 grid is 0.000159 eV, which means the 4×4×4 grid is accurate to 0.5 meV. Similarly, the 8×8×8 grid is accurate to 0.1 meV. Similar to the phonon DOS calculation, as the grid size increases, the computational time increases. However, the 32×32×32 grid is selected for latter computation because the amount of time it takes is still tolerable and it can give a very high accuracy (i.e. to the 5th decimal place).
Whether this grid is good enough for free energy calculations of crystals of a similar oxide, a zeolite or a metal, the argument from earlier section still applies. i.e. A similar oxide may require a similar grid size, whereas a zeolite and a metal requires smaller and larger grids, respectively.
| grid size | G (eV)* | calculation time (s) |
|---|---|---|
| 1×1×1 | -40.930(301) | 0.004 |
| 2×2×2 | -40.926(609) | 0.010 |
| 4×4×4 | -40.926(450) | 0.051 |
| 8×8×8 | -40.926(478) | 0.129 |
| 16×16×16 | -40.926(482) | 3.578 |
| 32×32×32 | -40.926(483) | 39.501 |
* Numerical values in this wiki page are generally reported to three decimal places. Here the numbers in brackets are mean to indicate the precision after the third decimal place.
Thermal Expansion Simulation using Quasi-Harmonic Approximation
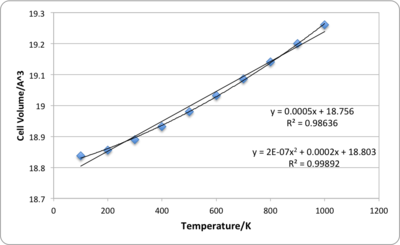
In this calculation, the Gibbs free energy of MgO is minimised at different temperatures by optimising its structures. The grid size used here is 32×32×32 as it gives the most accurate results within an affordable CPU time. The data obtained from this computation are summarised in Table 4 and Table 5. As temperature increases, lattice constant of MgO increases but the Gibbs free energy of the system decreases. The increase in lattice constant is expected as higher temperature allows the lattice to enter more vibrational levels which in turn increases the the amplitude and the energy of the harmonic oscillator. However, when two ions comes too close to each other, the short range repulsion becomes significant, and therefore the harmonic oscillator will prefer to have a larger equilibrium distance which increases the lattice constant and the total volume of a unit cell. The change in equilibrium distance is only possible in the quasi-harmonic oscillator approximation as it assumes that a parabola potential surface can be found at any internuclear distances. On the other hand, for a diatomic molecule following a perfect harmonic potential, its bond length is always constant as the equilibrium distance between two atoms is constant. The definition of Gibbs free energy is G=H-TS=U+pV-TS. As temperature increases, although the second and third terms on the right hand side have opposite impacts on Gibbs free energy , the increase in Gibbs free energy caused by the increase in volume is not enough to compensate the decrease caused by temperature and entropy.
By fitting the volume vs. temperature data to a linear or second order polynomial using Excel, the thermal expansion coefficient can be calculated as 26×10-6 K-1 or 17×10-6 K-1 at 300K according to the equation αv=(1/V0)·(dV/dT)p. However the thermal expansion coefficient calculated using linear is about twice as large as the experimental value(14×10-6 K-1 at 298K [6]) and even the value obtained from the second order fit is still larger than the highest known experimental value. This is not surprising considering the strong approximation used in these calculation, i.e. modelling the Mg and O ions as charged hard spheres and totally ignoring the existence of electron densities.
| Temperature (K) | Primitive Cell Volume(Å3) | Lattice Constant (Å) | Gibbs Free Energy (eV) |
|---|---|---|---|
| 0 | 18.836 | 2.987 | -40.902 |
| 100 | 18.838 | 2.987 | -40.902 |
| 200 | 18.856 | 2.988 | -40.909 |
| 300 | 18.890 | 2.989 | -40.928 |
| 400 | 18.933 | 2.992 | -40.959 |
| 500 | 18.980 | 2.994 | -40.999 |
| 600 | 19.032 | 2.997 | -41.049 |
| 700 | 19.085 | 3.000 | -41.107 |
| 800 | 19.141 | 3.003 | -41.172 |
| 900 | 19.200 | 3.006 | -41.243 |
| 1000 | 19.260 | 3.009 | -41.320 |
| Lattice Constant (Å) vs. Temperature (K) | Primitive Cell Volume(Å3 vs. Temperature (K) | Gibbs Free Energy (eV) vs. Temperature (K) |
|---|---|---|
 |
 |

|
Molecular Dynamics Simulation
The molecular dynamics (MD) simulation consists of two parts, equilibration and production. During the equilibration stage, particles are given random initial speed so that it can reach the pre-set temperature , and then during the production stage the motions of molecules are calculated according to Newtonian mechanics. The molecular dynamics approach does not work very well at low temperatures as molecules tend to move at nearly zero velocities at near 0 K, which results in nearly zero volume being computed by GULP. However, at high temperature, molecular dynamics can correctly predict the melting of the crystal, despite the piece of crystal employed here only contains 64 atoms, we can still see voids appearing in the animation of the lattice movement as shown in Figure 5, which is a good indication of melting. Figure 5 contains two screen shots from a molecular dynamics simulation performed at 3400K, which is higher than the melting point of MgO (3130K[7]). The picture on the top is the structure at the start of simulation and the bottom one is some point close to the end of the production with voids indicated with blue arrows. (In this computation, the production step is set to 5 ns rather than 0.5 ns for the calculation summarised in Table 6.)
Although signals of melting are seen in the molecular dynamics simulation, a full melting motion would require a much larger cell on which more reliable calculations are performed. By contrasting to the minimal grid size needed for a reliable phonon DOS calculation, the smallest lattice that should be used here should be at least as large as 16×16×16 of the primitive cell of MgO crystal. At sufficiently high enough temperature, the molecular dynamics method can successfully predict the melting of the crystal and the volume of which becomes constant, whereas the quasi-harmonic calculation would give unrealistic phonon modes with non-existent long bond length until the computation fails.
Figure 6 shows that cell volume is in a linear relationship with temperature from 100K to 2500K and gives an expansion coefficient of 32×10-6 K-1, which is even higher than the values obtained from QH method. This is probably caused by the inaccuracy of the MD method at low temperatures. As temperature increases beyond 2500K, fluctuations in cell volume starts to appear, and this is probably due to the relative short production time in which the crystal has not entered a relatively stable state. An increase in the length of production step may be able to solve this problem.
| Temperature (K) | Super Cell Volume(Å3)* | Primitive Cell Volume(Å3) ** |
|---|---|---|
| 100 | 599.513 | 18.735 |
| 200 | 601.242 | 18.789 |
| 300 | 602.899 | 18.841 |
| 400 | 604.609 | 18.894 |
| 500 | 606.323 | 18.948 |
| 600 | 608.167 | 19.005 |
| 700 | 610.085 | 19.065 |
| 800 | 612.103 | 19.128 |
| 900 | 614.061 | 19.189 |
| 1000 | 615.635 | 19.239 |
| 1100 | 617.642 | 19.301 |
| 1200 | 620.020 | 19.376 |
| 1300 | 621.914 | 19.435 |
| 1400 | 623.623 | 19.488 |
| 1500 | 625.156 | 19.536 |
| 1600 | 626.541 | 19.579 |
| 1700 | 627.756 | 19.617 |
| 1800 | 629.245 | 19.664 |
| 1900 | 632.250 | 19.758 |
| 2000 | 633.691 | 19.803 |
| 2100 | 634.021 | 19.813 |
| 2200 | 637.799 | 19.931 |
| 2300 | 639.964 | 19.999 |
| 2400 | 644.233 | 20.132 |
| 2500 | 642.740 | 20.086 |
| 2600 | 647.342 | 20.229 |
| 2700 | 647.949 | 20.248 |
| 2800 | 646.426 | 20.201 |
| 2900 | 650.763 | 20.336 |
| 3000 | 658.0715 | 20.565 |
| 3100 | 6357.171 | 20.537 |
| 3200 | 667.236 | 20.851 |
* The number reported in this column is the volume of the super cell at the end of each production stage.
**The volume of the super cell is 32 times the volume of the unit cell as the former contains 32 times the total number of atoms of the primitive cell.

Conclusions
In this experiment, the lattice energy, phonon dispersion and thermal expansion coefficients of a simply modelled MgO crystal were investigated using different computational methods. Despite a strong approximation being made in these calculation which is assuming the particles in MgO crystal are hard charged spheres, satisfactory results on internal energy have been achieved. However, the thermal expansion coefficient calculated using both QH and MD methods are not in good agreement with experimental results. QH method is useful for low temperature calculation because in this regime, the Coulombic and Buckingham potentials employed here are good approximations to the real situation. In the high temperature regime, QH method can not properly predict the melting of MgO crystal, in stead, it just allows MgO crystal to expand to an unphysical volume. On the hand, MD method can predict the melting of MgO at high temperature but the volume computed from this method in the low temperature region is too small comparing to actual lattice and this is due to the slow speed of atoms at temperatures close to 0 K. Phonon dispersion, phonon DOS and Helmholtz free energy of MgO crystal are also computed via single point calculations and these calculations show that by increasing the number of points being calculated, the accuracy of calculation can be improved. However, the competition between CPU time and accuracy must always be considered in any computer simulations.
If high performance computers were available for this computation, more complicated models, i.e. a quantum mechanical model that considers the wavefunctions of electron densities in the crystal, and ab initio method may be employed to investigate the properties of a even larger MgO cell, which theoretically should yield in results that are more in alignment with the experimental data.
References
- ↑ J.D. Gale, JCS Faraday Trans., 93, 629 (1997).
- ↑ W.M. Haynes & D.R. Lide, CRC handbook of chemistry and physics : a ready-reference book of chemical and physical data, Boca Raton, 93, 12-200 (2012)
- ↑ R. Hoffmann, Angew. Chem. Int. Edit. , 26, 846-878(1987).
- ↑ H. Zhang & M.S.T. Bukowinski, Phys. Rev B , 44, 2495(1991) .
- ↑ W.E. Rudge, Phys. Rev. , 181, 1033(1969).
- ↑ W. Buessem,M. Bluth & G. Grochtmann, Ber. Dtsch. Keram. Ges., 16, 387 (1935).
- ↑ B. Kumar, S.J. Rodrigues, & L.G. Scanlon, J. Electrochem. Soc. , 148, A1191-A1195(2001).

