Rep:Mod:MgO-jv1214
INTRODUCTION & METHODOLOGY
The widespread use of relatively structurally non-complex solids in heterogeneous catalysis, microelectronics and electrochemistry requires a good understanding of their physical properties.[1] Many of the important properties (specific heat, thermal and electrical conductivities, or thermal expansion coefficient) can be obtained to a satisfactory accuracy by using modern computational methods to analyse the valence band electronic structure and the phonon dispersion for a given material.[1][2] The aim of this project is to study the thermal expansion coefficient (α) of magnesium oxide (MgO: face-centered cubic crystal structure). MgO was chosen since, as an exemplar insulating ionic solid, it is widely studied, both experimentally and theoretically, which makes it an excellent model system.[1] The thermal expansion coefficient is defined as: , thus the change of volume with temperature at constant pressure has to be examined in order to determine α. This is achieved in this project through two different methods: lattice dynamics (LD) and molecular dynamics (MD).
The LD model operates in the reciprocal space and uses the quasi harmonic approximation to simulate the vibrational modes of the atoms in a rigid crystal lattice. In the lattice dynamics model, the atoms are bonded in the crystal lattice and interact with each other through Coulombic forces (pseudo-harmonic behaviour similar to the weight on a spring is a reasonable approximation), thus a displacement of one atom from its equilibrium position creates a vibrational wave along the crystal lattice as the other atoms have to react to this displacement. The combined periodic vibrations of the atoms in the lattice cell are collectively referred to as phonons. The number of independent phonons for a lattice cell is equal to number of atoms in the lattice cell multiplied by the number of dimensions (primitive cell for MgO contains 2 atoms, thus in 3 dimensions there should be 6 phonons). The energy of the phonons can be studied along different k-points in the reciprocal space to produce a phonon dispersion plot with different branches for each of the phonons (6 branches for MgO primitive cell). The quasi harmonic approximation is used in the LD in order to be able to explain the thermal expansion, since normal harmonic approximation fails to explain the thermal expansion as the equilibrium position in harmonic oscillator is temperature-independent. The quasi-harmonic approximation introduces dependence of the equilibrium position on volume which is dependent on temperature (T) and pressure (p). The phonons follow harmonic approximation at each specific volume (volume found for given T and p by minimising the Helmholtz free energy) but the equilibrium position of the harmonic oscillator is different for different Ts and ps.[2]
The MD model distributes random velocities (random directions and amplitudes, but the mean square velocity has to correspond to simulated T and p) to the simulated atoms at the beginning of the simulation (where the atoms are yet at their equilibrium positions). The atoms then start to move from their equilibrium positions in random directions increasing the potential energy and the simulation then aims to minimise the energy of the system (the energy of the system should converge to a certain value after several time-steps). The movement of one atom affects the remaining atoms but no separate ordered vibrational modes as in LD are studied. If we work in the NpT ensemble, the volume is free to change with temperature and the MD simulation allows for calculation of the thermal expansion coefficient by plotting the dependence mentioned above.
The important factor that has to be considered for both computational methods is the size of the simulated system. By increasing the system size, we increase the accuracy of the obtained results but simultaneously increase the computational time required to obtained these results. Thus, this project also investigates the effects of the system size on the result accuracy for the LD simulation.
RESULTS
Choosing the optimal grid size
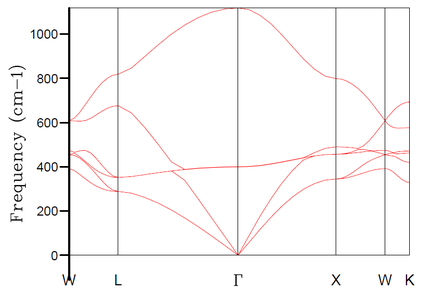
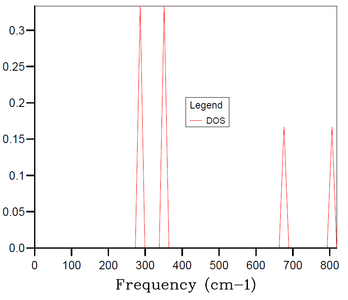
In the lattice dynamics model, we first simulated MgO primitive cell (rhombohedron containing 2 atoms - 1 Mg and 1 O). The obtained phonon dispersion calculated along 50 k-points (Figure 1) contains the 6 expected branches. The phonon dispersion plot highlights the special points along the conventional path in k-space, W-L-Γ-X-W-K (coordinates shown in Table 1). The special property of these points is that some of the branches become degenerate (i.e. 2 or more become isoenergetic with each other) at these points - e.g. at k-point X we can observe only 4 different frequencies. Because of the possibility of degeneracy of the branches (especially with higher number of branches when the phonon dispersion plot becomes less straightforward), it is advisable to supplement the phonon dispersion plot with a density of states (DOS) plot for a specific k-point. If we take e.g. k-point L from Figure 1, we observe 4 distinct frequency-points at approximately 280, 350, 680 and 810 cm-1. The plot of DOS at this k-point (Figure 2) then reveals the degeneracy at the frequencies ~280 and ~350 cm-1 - the peaks at these frequencies are twice as high as the peaks at the frequencies ~680 and ~810 cm-1. This corresponds to what we see in Figure 1 - as we move along the k-space from k-point W towards L, two of the branches become isoenergetic at ~280 cm-1 when reaching point L and two become isoenergetic at ~350 cm-1 when reaching point L. Following the same logic, we would expect to see 3 peaks in the plot of DOS at the point Γ at 0, ~400 and ~1100 cm-1 and the respective heights should be in ratios 3:2:1, respectively.
In the above part, we conducted the calculations for the MgO primitive cell 1x1x1 grid containing only 2 atoms and depending on a chosen k-point we can get 3 to 6 distinct peaks in the DOS plot - this, however, does not correspond well to an actual DOS in the bulk of MgO solid with e.g. Avogadro's number of atoms for which we would expect a continuous DOS plot rather than distinct peaks. Therefore, the 1x1x1 grid is not sufficient to obtain results (e.g. thermal expansion coefficient) that would correspond sufficiently to experimental data. Thus, it is necessary to increase the grid size and the number of atoms in the simulation. By increasing the simulated real space, the size of the reciprocal space has to decrease proportionally. And by increasing the number of simulated atoms, the number of branches in the phonon dispersion also has to increase proportionally. Thus, by increasing the grid size, we get a more restrained k-space with higher number of branches in the phonon dispersion, and at certain grid size the number of branches becomes sufficient for the DOS at any k-point to be continuous. As mentioned in Introduction, we aim to find balance between the accuracy of our data (in this case the smoothness of the DOS plot) and the required computational time.
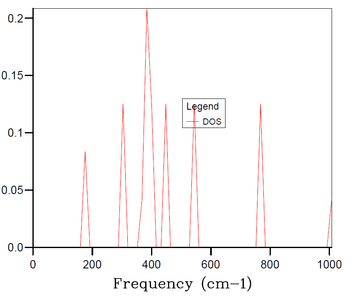
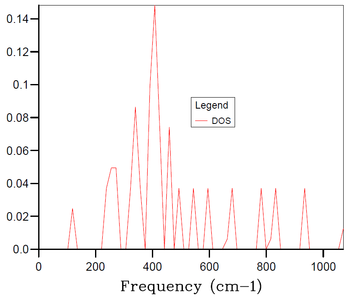
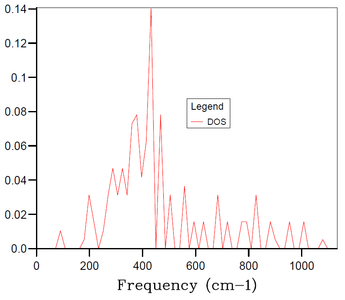
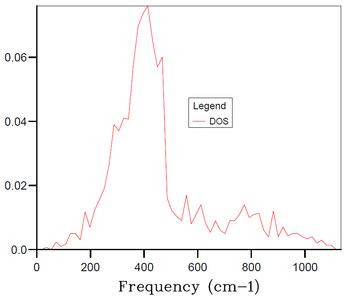
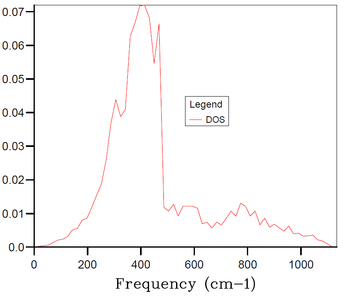
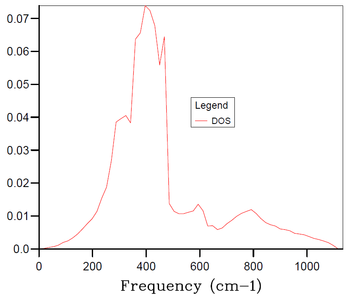
The DOS plots for simulations of MgO primitive cell 2x2x2, 3x3x3, 4x4x4, 10x10x10, 15x15x15 and 30x30x30 grids are shown in Figures 3-8, respectively. For the 2x2x2 grid, isolated peaks are still observed. With 4x4x4 grid, the beginning of combining of the peaks into a continuous plot is observed. For the 30x30x30, the desired continuous and smooth DOS plot is observed. The 15x15x15 grid is chosen as an optimum as the DOS plot is sufficiently smooth and the computational time is 20-times smaller than for the 30x30x30 grid. There are 20250 (number of primitive cells 15x15x15 times 2 atoms in primitive cell times 3 dimensions) branches in the 15x15x15 grid.
An interesting connection showing the folding of the phonon dispersion with increasing grid size can be shown using Figures 1 and 8. By examining the phonon dispersion for the 1x1x1 grid and considering the folding of the branches with decreasing the reciprocal space, a high DOS would be expected around ~400 cm-1 since the branches around this frequency are the least dispersed and and high increase in DOS for a given k-point is expected to happen with reduction of the reciprocal space. This corresponds well to the observed high DOS for 30x30x30 grid at frequencies around 400 cm-1 in Figure 8.
However, the continuity and smoothness of the DOS plot is not an easily quantifiable property of the different DOS plots. Thus, an alternative and more quantifiable method for choosing an optimal grid size is applied below.
 |
 |
 |
 |
 |
 |
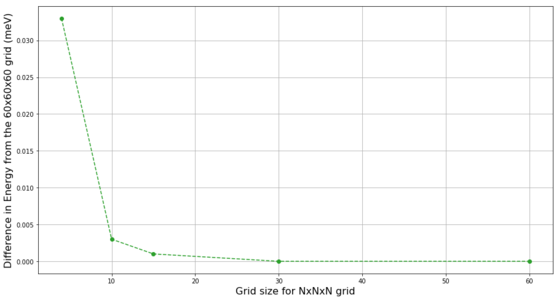
The GULP algorithm calculates the Helmholtz free energy (further referred to just as "energy") for the different grid sizes.[3] The energy is expected to converge for a large enough grid sizes. The change of energy with increasing grid size at 300 K is shown in Figure 9, and the plot of energy differences between different grid sizes and the 60x60x60 grid (at which the energy has fully converged) is shown in Figure 10. The energy for the 1x1x1 grid is significantly lower than the convergence value. With increasing the grid size, sharp increase in the energy is first observed, and once a maximum is observed for the 3x3x3 grid a steady decrease in energy towards the convergence value is observed with increasing grid size. Considering the accuracy of the energies, grid 2x2x2 (not shown in Figure 10) has already accuracy better than 0.5 meV (less than 0.1% of the total energy) and all larger grids have accuracy better than 0.1 meV. There is no detectable energy difference between 30x30x30 and 60x60x60 grids and the difference for 15x15x15 grid is still marginal. This further support the choice of 15x15x15 grid as the optimum.
 |
 |
Above, the optimal size 15x15x15 was found for a MgO which is an insulating ionic solid with two atoms in the primitive cell. The 15x15x15 grid is not a universal solution. Three examples of different solids are discussed below.
For a solid with similar nature and structure as MgO, for example CaO, the 15x15x15 grid can be expected to provide again the optimum between accuracy and computational time.
However, for a different insulating ionic solid with more complex crystal structure and thus higher number of atoms in its primitive cell, for example Faujasite (zeolite), the 15x15x15 is expected to be unnecessarily large and thus too time-requiring as the DOS can be expected to become smooth and the energy can be expected to converge to satisfactory level even for smaller grids. This is due to the increased number of atoms in the primitive cell which corresponds to much higher number of branches in the corresponding phonon dispersion which in turn means that smaller shrinking of the reciprocal space (and corresponding increase of the real space) is required to obtain continuous and smooth DOS.
When considering metals rather than insulating ionic solids, the connection between electronic band width and the phonon dispersion should be considered. The comparison in electronic band width[1] and in phonon dispersion between MgO[4] and Mg metal[5] can be seen in provided references, respectively. From Figure 1, the broad dispersion of phonons for MgO is visible, conversely the phonon dispersion for Mg metal in provided reference[5] is significantly narrower. Opposite trend is observed in the electronic band widths. The electronic band width of Mg metal is broad while the one for MgO is narrow (which would be expected due to its insulating ionic nature). Thus, to observe satisfactory DOS plot for the phonon dispersion of Mg metal, smaller grid should be sufficient than the one required for MgO, since with Mg metal the branches in phonon dispersion are less dispersed and constrained to a smaller frequency range and thus less folding of the branches due to shrinking of the k-space is required to obtain continuous and smooth DOS plot. Therefore, when studying metals rather than oxides, e.g. Li, a grid smaller than 15x15x15 should be sufficient to get the same level of accuracy in both DOS plots and the Helmholtz free energy.
Thermal expansion investigation
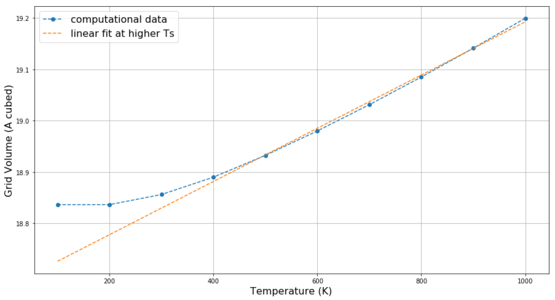
The previously determined optimal 15x15x15 grid is used to study the change in free energy and lattice volume with increasing temperature using the LD method. As mentioned previously, the MgO primitive cell is a rhombohedron with angle 60° and at 0 K lattice parameter 2.978 Å. The temperature was screened in 100 K steps from 100 K to 1000 K. The change in the angle with temperature is less than 0.01% - the shape of the crystal lattice remains unchanged. In case of the lattice parameter, due to using the quasi-harmonic approximation in the LD method, the lattice parameter and the lattice volume of the simulated 15x15x15 grid increase with temperature as shown in Figure 11. Above 300 K, this increase is satisfactorily linear. Similar behaviour is observed in Figure 12 for the change of free energy of the 15x15x15 grid with temperature, but the linear trend is less pronounced.
 |
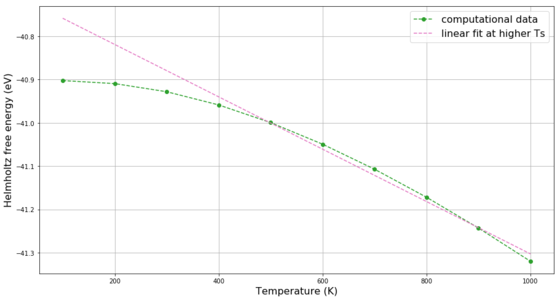 |
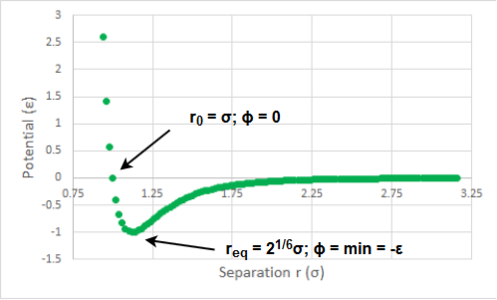
The overall trend in both curves is as expected: the material expands with increasing temperature and it has more free energy to act (i.e. more negative free energy). As briefly mentioned in the Introduction, the thermal expansion is the result of the anharmonicity of the particle interaction. If, for example, a Lennard-Jones potential is considered (Figure 13) it becomes apparent that if we increase the potential energy of a linear arrangement of 3 particles A-B-C and if we assume that the A-B distance decreased by x, then the distance B-C has to increase by more than x in order for the two distance changes to be isoenergetic. Thus, the new equilibrium position is larger than the initial one and the volume of the system has to increase. This is not observed for harmonic oscillator where with increasing potential energy both distances A-B and B-C increase equally and the equilibrium position remains constant.
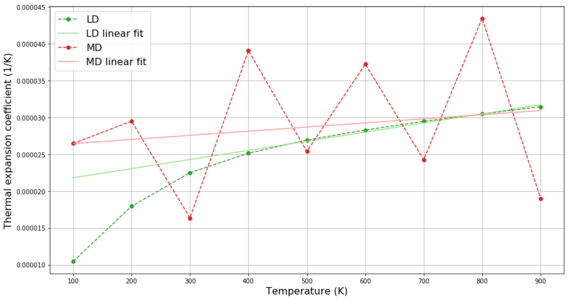
The data shown in Figure 11 for the LD method can be used to calculate the thermal expansion coefficient using the formula shown in Introduction. The thermal expansion coefficients calculated between each consecutive temperature pairs are shown in Figure 14 with the temperature on the x-axis corresponding to the initial temperature for which the thermal expansion coefficient was calculated. This graph compares the thermal expansion coefficients obtained using LD method with those obtained using MD method. In both cases, we observe increase of the thermal expansion coefficient with temperature as is expected from the Lennard-Jones potential. For temperatures between 300 and 900 K, the thermal expansion coefficients from both methods are in range 24-32 10-6 K-1 with the MD results being higher up to 800 K. The literature values for this temperature range increase in range 11-15 10-6 K-1.[6] Thus, the results obtained by our method are roughly 2-2.5 times higher than literature values. Better correspondence to literature values could be achieved by decreasing the temperature step.
For the MD calculations, 64 atoms (i.e. 32 MgO units) were simulated. If we applied the same criteria for accuracy as in LD (i.e. 15x15x15 grid of primitive cell containing 1 MgO unit) it would be necessary to simulate 6750 atoms in the MD model. This would provide more accurate results but we would have to simulate 100-times more atoms even though the agreement between the two models is already sufficiently accurate. Additional interesting observation from Figure 14 is the behaviour obtained from the two methods. While the LD results continuously increase following the quasi-harmonic approximation, the MD results randomly oscillate around the average value - this is due to the operating mode of the MD method which assigns the simulated atoms random velocities at the beginning of the simulation (slightly different results are obtained in MD when the same conditions are simulated).
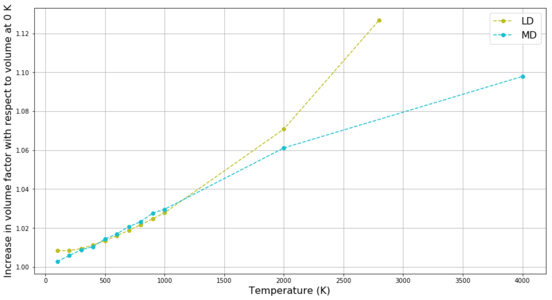
Further, both LD and MD were used to attempt to examine the thermal expansion of MgO up to its melting point (3125 K).[6] These results are compared in Figure 15. In LD, system volume continues to increase as expected up to 2800 K (sharper increase at higher temperatures as follows from Lennard-Jones potential), but once calculations are attempted closer to the melting point (3000 and 3125 K) the simulation fails to return any meaningful results - at these temperatures the energy in the system is too high to be accommodated by the ordered phonons as melting is expected but the LD method cannot interpret anything else than a lattice bound solid. The MD method, on the other side, can accommodate even high energies in the random motion of the particles and thus the volume from MD continues to increase linearly even far above the melting point.
 |
 |
CONCLUSION
The optimal grid size for MgO simulations using lattice dynamics was investigated and the 15x15x15 grid was found to provide best balance between accuracy and computational time. The thermal expansion coefficient for MgO was obtained at different temperatures using both lattice dynamics and molecular dynamics. A good agreement between the two methods was observed especially at temperatures 500-900 K. The computationally obtained thermal expansion coefficient were 2-2.5 times higher than experimental values. The explanation for this trend and investigation of the system size on the accuracy of MD calculations are yet to be provided.
REFERENCES
- ↑ 1.0 1.1 1.2 1.3 S. A. Canney, V. A. Sashin, M. J. Ford and A. S. Kheifest, J. Phys: Condens. Matter, 1999, 39, 7507–7522.
- ↑ 2.0 2.1 N. Singh and S. K. Joshi, Physica, 1964, 30, 2105-2118.
- ↑ J. D. Gale, J. Chem. Soc., Faraday Trans., 1997, 93, 629-637.
- ↑ G. Peckham, Proc. Phys. Soc., 1967, 90, 657-670.
- ↑ 5.0 5.1 J. R. Maurya and R. S. Srivastava, Physics Lettersi, 1974, 50a, 297-298.
- ↑ 6.0 6.1 A. S. Madhusudhan Rao and K. Narender, J. of Thermodyn., 2014, 2014, 1-8.

