
Rep:Mod:Mbi31M90
Y3C Inorganic Module: Week 1
Optimisations: Trigonal Planar Molecules
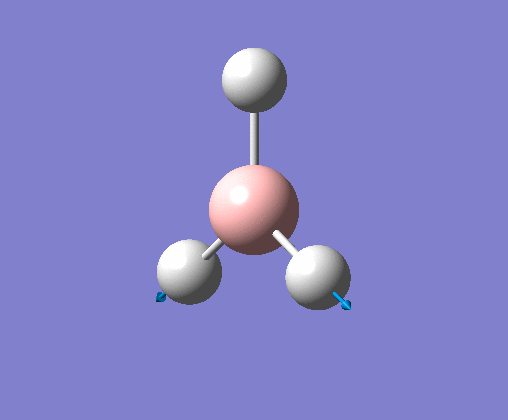
BH3
| File Name | BH3 opt lkb | LKB BH3 OPT 631G(d,p) |
| File Type | .log | .log |
| Calculation Type | FOPT | FOPT |
| Calculation Method | RB3LYP | RB3LYP |
| Basis Set | 3-21G | 6-31G(d,p) |
| E(RB3LYP) | -26.46226447 a.u. | -26.61532374 a.u. |
| RMS Gradient Norm | 0.00001380 a.u. | 0.00001791 a.u. |
| Dipole Moment | 0.00 Debye | 0.00 Debye |
| Point Group | C2V | C2V |
| Calculation Time (s) | 276 | 97 |
A borane molecule was constructed in GaussView, and all bond lengths set to 1.5Å, before being optimised using the B3LYP method and 3-21G basis set. The resulting structure was then optimised again using the more accurate 6-31G basis set. The table to the left provides summaries of both these calculations. After each optimisation, the C2v point group was assigned (instead of the correct D3h point group), and this is because the basis set was not accurate enough. The B-H bond distances of the 6-31G(d,p) optimised structure was in good agreement (within 2 decimal places) with literature, and bond angles were 120°, as expected for the trigonal planar shape. This data is presented in the table below. Links to the .log files for these calculations are included along with the Items tables to confirm that the calculations were complete and a stationary point in energy was reached.
| Gaussian | Literature [1] | ||
|---|---|---|---|
| Basis Set | 3-21G | 6-31G(d,p) | -- |
| B-H Bond Distance (Å) | 1.19438 | 1.19273 | 1.19001 |
| H-B-H Bond Angle (°) | 120.009 | 120.003 | |
Calculated values for bond distance and angle have been reported to 3d.p here, to show the effect of using a better basis set; for all subsequent data 2d.p will be used.
.log file for optimisation of BH3 using 3-21G Basis Set
          Item               Value     Threshold  Converged?
 Maximum Force            0.000027     0.000450     YES
 RMS     Force            0.000017     0.000300     YES
 Maximum Displacement     0.000157     0.001800     YES
 RMS     Displacement     0.000096     0.001200     YES
Predicted change in Energy=-5.138755D-09
Optimization completed.
-- Stationary point found.
.log file for optimisation of BH3 using 6-31G Basis Set
         Item               Value     Threshold  Converged?
 Maximum Force            0.000034     0.000450     YES
 RMS     Force            0.000017     0.000300     YES
 Maximum Displacement     0.000114     0.001800     YES
 RMS     Displacement     0.000071     0.001200     YES
 Predicted change in Energy=-3.683622D-09
 Optimization completed.
 -- Stationary point found.
A similar procedure was then used for two other trigonal planar molecules: GaBr3 and BBr3, however medium level basis sets and pseudo-potentials were used for the calculations. Summaries have been displayed below, as well as the final Items tables and links to .log files.
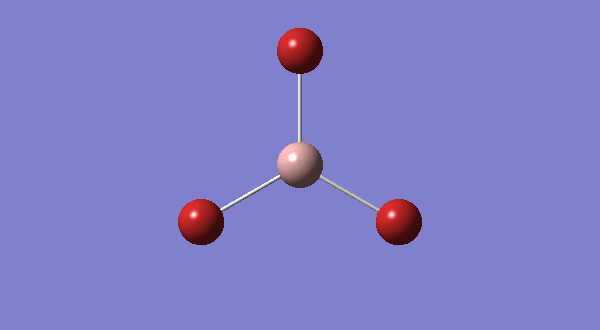
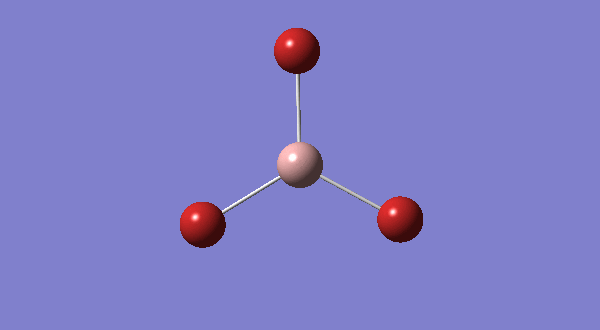
GaBr3
The calculations for this molecule were run on the HPC and completed calculations were published to D-Space; DOI:10042/25187
| File Name | LKB GaBr3 LanL2DZ |
| File Type | .log |
| Calculation Type | FOPT |
| Calculation Method | RB3LYP |
| Basis Set | LANL2DZ |
| E(RB3LYP) | -41.70082783 a.u. |
| RMS Gradient Norm | 0.00000016 a.u. |
| Dipole Moment | 0.00 Debye |
| Point Group | D3H |
| Calculation Time (s) | 28 |
| Gaussian | Literature[2] | |
| Ga-Br Bond Distance (Å) | 2.35 | 2.239 |
| Br-Ga-Br Bond Angle(°) | 120.0 | 120.2 |
         Item               Value     Threshold  Converged?
 Maximum Force            0.000000     0.000450     YES
 RMS     Force            0.000000     0.000300     YES
 Maximum Displacement     0.000003     0.001800     YES
 RMS     Displacement     0.000002     0.001200     YES
 Predicted change in Energy=-1.282680D-12
 Optimization completed.
    -- Stationary point found.
BBr3
Since BBr3 contains heavy bromine atoms and a light boron atom, a combination of pseudo-potential and basis set was used for optimisation. The "pseudo=read gfinput" keywords were used and the PPs/basis sets were chosen as 6-31G(d,p) for Boron and LanL2DZ for Bromine.
| File Name | LKB BBr3 Gen |
| File Type | .log |
| Calculation Type | FOPT |
| Calculation Method | RB3LYP |
| Basis Set | GEN |
| E(RB3LYP) | -64.43645277 a.u. |
| RMS Gradient Norm | 0.00000397 a.u. |
| Dipole Moment | 0.00 Debye |
| Point Group | C2V |
| Calculation Time (s) | 37 |
         Item               Value     Threshold  Converged?
 Maximum Force            0.000008     0.000450     YES
 RMS     Force            0.000005     0.000300     YES
 Maximum Displacement     0.000040     0.001800     YES
 RMS     Displacement     0.000025     0.001200     YES
 Predicted change in Energy=-4.333860D-10
 Optimization completed.
    -- Stationary point found.
Link to this calculation on D-Space: DOI:10042/25199
| Gaussian | Literature | |
| B-Br Bond Distance (Å) | 1.93 | 1.87 [3] |
| Br-B-Br Bond Angle | 120 | 120 [4] |
Interpreting the Results: Bond Distances
| Molecule | Bond Distance (Å) |
|---|---|
| BH3 | 1.19226 |
| GaBr3 | 2.35018 |
| BBr3 | 1.93395 |
| Atom | Electronegativity (Pauling scale)[5] |
|---|---|
| H | 2.20 |
| B | 2.04 |
| Ga | 1.81 |
| Br | 2.96 |
Hydrogen and bromine are both X-type ligands, donating 1 electron to the central atom, however they differ in both size and electronegativity. The electronegatvity difference between an atom and a ligand contributes to the bond strength, and therefore distance. Boron and bromine have a larger difference in electronegativity than boron and hydrogen, thus demonstrating some ionic character and a shorter, stronger bond in BBr3 would be expected. However, as the computed data shows, this is not the case. Efficient orbital overlap between the atomic orbitals is also key to bond strength. Boron and hydrogen are both small atoms, and therefore exhibit very good orbital overlap. The frontier orbitals of boron and bromine are far apart in energy, and though they still interact, this could be a contribution to the weakness of boron-bromide bonds in comparison to boron-hydrogen bonds.
Gallium forms a longer (+0.42Angstroms) with the bromine ligand than boron does, despite the greater difference in electronegativity. This can be attributed to the large size of a gallium atom, in comparison to boron. Bond distance can be approximated by summing the covalent radii of the two atoms involved; for Ga-Br this is 242pm and for B-Br it is 204pm. Whilst the values calculated by Gaussian were lower (due to the electronic interactions discussed), they are consistent with the prediction that Ga-Br is ~40pm longer than B-Br. Gallium and bromine have 4p orbitals of similar size and energy, however due to the diffuse nature of these atomic orbitals, their overlap is weak, which contributes to the weakness of the Ga-Br bond.
What is a Bond?
A bond occurs when electrons have a higher probablility of existing in an inter-nuclear region because the arrangement leads to an overall potential energy decrease and to a minimum potential energy at equilibrium distance. Despite initial rise in potential energy as atoms approach each other, the energy is lowered (by an amount known as the binding energy) due to the electron-nucleus attraction, and hence this is a favourable process resulting in an increased electron density between the two nuclei involved.
GaussView does not always depict a bond where we expect to see one. It uses database of common bond lengths to generate a specific distance between two given atoms that must be met for the programme to recognise a bond. If the distance between atoms in a structure is greater than this predetermined value, then no bond will be drawn; this does not mean that there is no bond. In fact there may be favourable attractive interactions between the atoms resulting in an energy minima at the equilibrium interatomic distance, which can be classified as a bond.
Frequency & Vibration Analysis
Gaussian was used to conduct frequency analyses for the optimised structures. In setting up the calculations, the method and basis set were left unchanged. This is important because changing any of these parameters would invalidate the results; the method and basis set respectively defines a set of assumptions put in place for solving the Schrodinger Equation and the accuracy to which the structure is optimised. These must be maintained for all subsequent calculations and new ones cannot be introduced.
Frequency analysis gives assurance that the energy computed in optimisation is indeed a minimum; all frequencies are expected to be positive and if negative values arise then the 'optimised' structure is not in fact the ground state, but a transition state maximum. In essence, this calculation is the 'second derivative' of the energy plot (the optimisation step being the 'first derivative').
The frequency calculation generates a list of vibrational modes, with frequencies and intensities, and these can be visualised in GaussView, along with a predicted Infrared Spectrum. For the molecules below, a summary of each calculation is presented, with a link to the .log or DSpace file. Low frequencies (copied from the .log file) have been included. The first line represents the frequencies at which the center of mass vibrates, and therefore these are very small. The second line provides larger "low frequencies" and these are the lowest of the 6 degrees of freedom (3N-6) which the tetratomic molecules experience.
BH3
| File Name | LKB_BH3_FREQ |
| File Type | .log |
| Calculation Type | FREQ |
| Calculation Method | RB3LYP |
| Basis Set | 6-31G(d,p) |
| E(RB3LYP) | -26.61532363 a.u. |
| RMS Gradient Norm | 0.00000820 a.u. |
| Dipole Moment | 0.00 Debye |
| Point Group | D3H |
| Calculation Time (s) | 202 |
Completed Frequency Analysis for BH3. Point group constrained to D3H
Low frequencies --- -0.5574 -0.2902 -0.0055 17.0570 19.8946 19.9024
Low frequencies --- 1163.0789 1213.2383 1213.2410
| No. | Form of Vibration | Image | Frequency (cm-1) | Intensity | Symmetry | Animation |
|---|---|---|---|---|---|---|
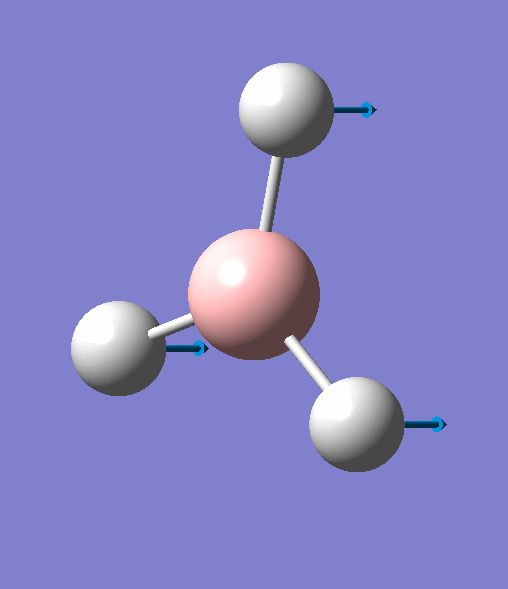
| 1 | Three hydrogens wagging out of the plane of the molecule in a concerted motion. |  |
1163 | 93 | A2" | View Vibration 1 |
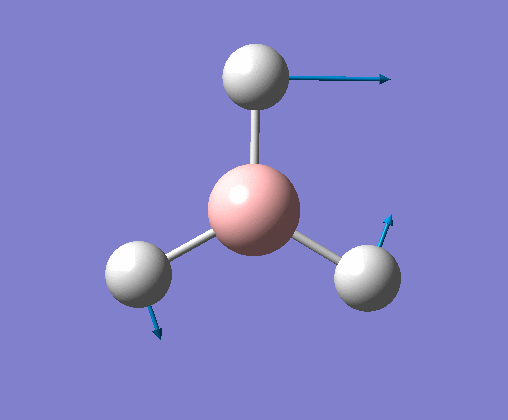
| 2 | Two hydrogens scissoring, in the plane of the molecule. B atom and one H atom undergo a small concerted oscillation. |  |
1213 | 14 | E' | View Vibration 2 |
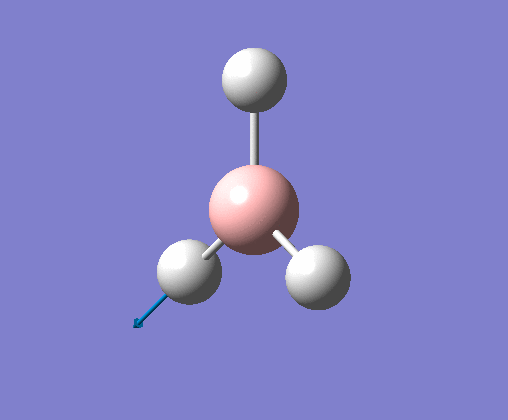
| 3 | All hydrogens rocking around The stationary B atom. Two Hs move in the same direction, and the third moves in the opposite direction. | 121 | 14 | E' | View Vibration 3 | |
| 4 | All hydrogens stretching in and out, in a concerted motion, with the B atom stationary. | 2582 | 0 | A1' | View Vibration 4 | |
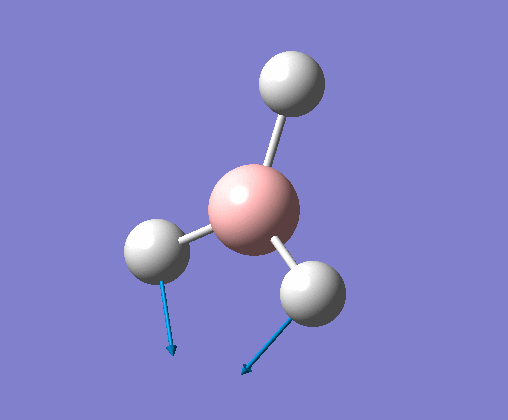
| 5 | One hydrogen remains stationary while the other two B-H bonds undergo an asymmetric stretch. |  |
2715 | 126 | E' | View Vibration 5 |
| 6 | Stretching of all B-H bonds. Two move in a concerted motion, asymmetric to the third. |  |
2715 | 126 | E' | View Vibration 6 |
GaBr3
| File Name | lkb_gabr3_freq |
| File Type | .log |
| Calculation Type | FREQ |
| Calculation Method | RB3LYP |
| Basis Set | LANL2DZ |
| E(RB3LYP) | -41.70082783 a.u. |
| RMS Gradient Norm | 0.00000011 a.u. |
| Dipole Moment | 0.00 Debye |
| Point Group | D3H |
| Calculation Time (s) | 17 |
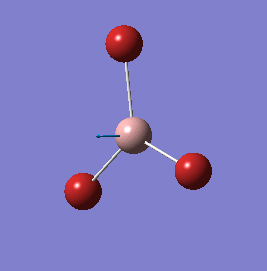
Frequency analysis for GaBr3 carried out on HPC and published to DSpace: DOI:10042/25208 Below are the Low frequencies as given in the calculation file. The lowest "real" normal mode for GaBr3 is at 76.3744cm-1, the rocking of bromine atoms around a stationary Ga.
Low frequencies --- -0.5252 -0.5247 -0.0024 -0.0010 0.0235 1.2011
Low frequencies --- 76.3744 76.3753 99.6982
Completed Frequency Analysis for GaBr3
| No. | Form of Vibration | Frequency | Intensity | Symmetry | Animation |
|---|---|---|---|---|---|
| 1 | All bromine atoms rocking around the stationary Ga atom. Two Br's move in the same direction, and the third moves in the opposite direction. | 76 | 3 | E' | View Vibration 1 |
| 2 | Two bromines scissoring, in the plane of the molecule. Ga atom and one Br atom are stationary. | 76 | 3 | E' | View Vibration 2 |
| 3 | Ga atom wagging out of the plane of the molecule while the bromines remain stationary. | 100 | 9 | A2" | View Vibration 3 |
| 4 | All Ga-Br bonds stretching in and out, in a concerted motion, with the Ga atom stationary. | 197 | 0 | A1' | View Vibration 4 |
| 5 | One bromine remains stationary while the other two Ga-Br bonds undergo an asymmetric stretch | 316 | 57 | E' | View Vibration 5 |
| 6 | Stretching of all Ga-Br bonds. Two move in a concerted motion, asymmetric to the third. | 316 | 57 | E' | View Vibration 6 |


Comparison of Vibrations
Vibrational frequencies are given by the equation below, where is the force constant and is the reduced mass.
The Gallium compound has a greater reduced mass than BH3 and should lead to a lower frequency. This is consistent to the values calculated in Gaussian. In addition to this, from the equation, the force constant for Ga-Br is expected to be smaller than that of B-H.
The order of the various vibrational modes is different for these two trigonal planar molecules; the A2" has the lowest frequency in BH3 whereas it is the third lowest frequency in GaBr3. This can be explained by stronger Pauli repulsions in the A2" vibration for GaBr3. When the bromine atoms move out of the σv plane, they experience strong steric repulsions due to their large size, making the motion highly energetic. This effect is not observed so much in BH3 since they hydrogens atoms are small and do not get close enough to cause strong repulsions.
The IR spectra for BH3 and GaBr3 both give three main peaks, two of low intensity, and one of very high intensity. The difference is that the GaBr3 peaks occur at much lower frequency (50-350cm-1) compared to BH3 (1050-2800cm-1).
It can be seen from the frequencies above that the modes lie in two groups: the bends (A2 and E1) and the stretches at a higher energy (A1' and E1). Stretching vibrations are higher in energy because they involve compression of bonds(atoms get closer together), leading to increased charge repulsions and a significant rise in potential energy.
Molecular Orbital Analysis: BH3
Population analysis was performed, on the HPC, using the "pop=full" keyword and "Full NBO" option. The 6-31G basis set was used again.
DSpace link for this calculation: DOI:10042/25237 .
View Checkpoint file for this calculation.
A molecular orbital diagram for the molecule (below) was constructed, using the Boron Atomic Orbitals and H3 Fragment Orbitals. The LCAOs have been shown, as well as the corresponding "real" molecular orbitals, generated in GaussView. Each pair of orbital interpretations demonstrate consistency in the positioning of nodes and orbital overlap, and so the LCAO method is accurate and a useful method for constructing MOs manually. However there are basic visible advantages to the computational method; the real MOs provide a realistic spatial view of where the electron exists, by merging the in phase orbital overlaps. Nodes are also more distinctly observable in the computed structures.

NBO Analysis: NH3
Optimisation completed: View .log file here The optimisation was first conducted using the 6-31G basis set and the "nosymm" keyword. This generated an energy value of -56.55776863 a.u. and assigned the point group at C3v. On running the calculation again, with the point group constrained to C3v, the same energy and gradient were computed. Frequency analysis was then carried out on the symmetry constrained optimised structure, using the same basis set, so that low frequencies and vibrational modes (with their corresponding symmetry labels) could be obtained.
| File Name | LKB_NH3_OPT_C3V |
| File Type | .log |
| Calculation Type | FREQ |
| Calculation Method | RB3LYP |
| Basis Set | 6-31G(d,p) |
| E(RB3LYP) | -56.55776863 a.u. |
| RMS Gradient Norm | 0.00000289 a.u. |
| Dipole Moment | 1.85 Debye |
| Point Group | C3v |
| Calculation Time (s) | 8 |
         Item               Value     Threshold  Converged?
 Maximum Force            0.000005     0.000450     YES
 RMS     Force            0.000003     0.000300     YES
 Maximum Displacement     0.000010     0.001800     YES
 RMS     Displacement     0.000007     0.001200     YES
 Predicted change in Energy=-7.830518D-11
 Optimization completed.
    -- Stationary point found.
Frequency Analsysis conducted: View .log file here
| File Name | LKB_NH3_FREQ |
| File Type | .log |
| Calculation Type | FREQ |
| Calculation Method | RB3LYP |
| Basis Set | 6-31G(d,p) |
| E(RB3LYP) | -56.55776863 a.u. |
| RMS Gradient Norm | 0.00000281 a.u. |
| Dipole Moment | 1.85 Debye |
| Point Group | C3v |
| Calculation Time (s) | 6 |
 Low frequencies ---  -30.8045    0.0011    0.0011    0.0012   20.2188   28.2150
 Low frequencies --- 1089.5530 1694.1235 1694.1861
From the positive frequencies we can see that the ground state (minimum energy) has been obtained successfully.

Molecular Orbital Analysis conducted, on the HPC, and deposited in DSpace: DOI:10042/25318 . View .log file here.
| File Name | lkb_nh3_mo_c3v |
| File Type | .fchk |
| Calculation Type | SP |
| Calculation Method | RB3LYP |
| Basis Set | 6-31G(d,p) |
| E(RB3LYP) | -56.55776863 a.u. |
| RMS Gradient Norm | 0.00000000 a.u. |
| Dipole Moment | 1.85 Debye |
| Point Group | C3v |

- Charge Distribution range
- -1.00 to 1.00
- Nitrogen: -1.125
- Hydrogens: 0.375
From .log file:
Summary of Natural Population Analysis:

                                       Natural Population
                Natural  -----------------------------------------------
    Atom  No    Charge         Core      Valence    Rydberg      Total
 -----------------------------------------------------------------------
      N    1   -1.12515      1.99982     6.11104    0.01429     8.12515
      H    2    0.37505      0.00000     0.62250    0.00246     0.62495
      H    3    0.37505      0.00000     0.62250    0.00246     0.62495
      H    4    0.37505      0.00000     0.62249    0.00246     0.62495
 =======================================================================
   * Total *    0.00000      1.99982     7.97852    0.02166    10.00000
 Natural Bond Orbitals (Summary):
                                                            Principal Delocalizations
           NBO                        Occupancy    Energy   (geminal,vicinal,remote)
 ====================================================================================
 Molecular unit  1  (H3N)
     1. BD (   1) N   1 - H   2          1.99909    -0.60417
     2. BD (   1) N   1 - H   3          1.99909    -0.60417
     3. BD (   1) N   1 - H   4          1.99909    -0.60416
     4. CR (   1) N   1                  1.99982   -14.16768
     5. LP (   1) N   1                  1.99721    -0.31756  24(v),16(v),20(v),17(v)
                                                    21(v),25(v)
Association Energies: NH3BH3
Optimisation completed: View.log file here
         Item               Value     Threshold  Converged?
 Maximum Force            0.000139     0.000450     YES
 RMS     Force            0.000063     0.000300     YES
 Maximum Displacement     0.000771     0.001800     YES
 RMS     Displacement     0.000338     0.001200     YES
 Predicted change in Energy=-2.028054D-07
 Optimization completed.
    -- Stationary point found.
| File Name | lkb_nh3bh3_opt |
| File Type | .log |
| Calculation Type | FOPT |
| Calculation Method | RB3LYP |
| Basis Set | 6-31G(d,p) |
| E(RB3LYP) | -83.22469007 a.u. |
| RMS Gradient Norm | 0.00006839 a.u. |
| Dipole Moment | 5.57 Debye |
| Point Group | C1 |
| Calculation Time (s) | 239 |
Frequency Analysis conducted on HPC and sent to DSpace DOI:10042/25297 . View .log file here
| File Name | LKB_NH3BH3_FREQ |
| File Type | .log |
| Calculation Type | FREQ |
| Calculation Method | RB3LYP |
| Basis Set | 6-31G(d,p) |
| E(RB3LYP) | -83.22469003 a.u. |
| RMS Gradient Norm | 0.00006832 a.u. |
| Dipole Moment | 5.57 Debye |
| Point Group | C1 |
| Calculation Time | 1min 3sec |
18 vibrational modes identified, all with positive frequencies

 Low frequencies ---   -0.0014   -0.0010    0.0004   19.0258   23.6755   42.9790
 Low frequencies ---  266.5871  632.3788  639.4542
E(NH3) = -56.55776856 a.u
E(BH3) = -26.61532374 a.u.
E(NH3BH3) = -83.22469007 a.u.
ΔE = E(NH3BH3)-[E(NH3)+E(BH3)] = -0.05159777 a.u. = -135.47 kJ/mol
References
- ↑ [Kawaguchi, Kentarou; 1992; Fourier transform infrared spectroscopy of the BH3 ν3 band; J. Chem. Phys; 96: 3411-3415; DOI:10.1063/1.461942 ]
- ↑ [B. Réffy, M. Kolonits, Ma. Hargittai; 1998; Gallium tribromide: molecular geometry of monomer and dimer from gas-phase electron diffraction; J. Mol. Struc.; 445(1–3):139-148; DOI:10.1016/S0022-2860(97)00420-1 ]
- ↑ [A. W. Laubengayer, R. P. Ferguson, and A. E. Newkirk; 1941; The Densities, Surface Tensions and Parachors of Diborane, Boron Triethyl and Boron Tribromide; J. Am. Chem. Soc., 63(2):559–561; DOI:10.1021/ja01847a057 ]
- ↑ [Henri A. Lévy and L. O. Brockway; 1937; The Molecular Structures of Boron Trimethyl, Trifluoride, Trichloride, and Tribromide. The Covalent Radius of Boron; J. Am. Chem. Soc., 59(11):2085–2092; DOI:10.1021/ja01290a002
- ↑ [A.L. Allred; 1961; Electronegativity values from thermochemical data; Journal of Inorganic and Nuclear Chemistry; 17(3–4):215-221;DOI:10.1016/0022-1902(61)80142-5 ]