Rep:Mod:MWBINORAGNIC
Optimisation of BH3
BH3 was optimised using 3-21G basis set and then re-optimised with a higher level basis set of 6-31G(d,p) using B3LYP method. Before optimisations B-H bond lengths were set to 1.55 Å, 1.54 Å and 1.53 Å in Gaussview. After this the two basis sets used in each optimisation were compared in order to determine the success of each method.
Optimisation with 3-21G basis set
| Property | Output |
|---|---|
| File Name | MWBBH3optimisation |
| File Type | .log |
| Calculation Type | FOPT |
| Calculation Method | RB3LYP |
| Basis Set | 3-21G |
| Charge | 0 |
| Spin | Singlet |
| E(RB3LYP) | -26.46226429 a.u. |
| RMS Gradient Norm | 0.00008851 a.u. |
| Dipole Moment | 0.0003 Debye |
| Point Group | CS |
| Job cpu time | 16.0 seconds |
        Item               Value     Threshold  Converged?
 Maximum Force            0.000220     0.000450     YES
 RMS     Force            0.000106     0.000300     YES
 Maximum Displacement     0.000940     0.001800     YES
 RMS     Displacement     0.000447     0.001200     YES
 Predicted change in Energy=-1.672478D-07
 Optimization completed.
    -- Stationary point found.
The optimisation has converged therefore a stationary point has been found on the BH3 potential energy surface.
The optimisation file is linked here
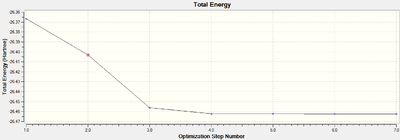

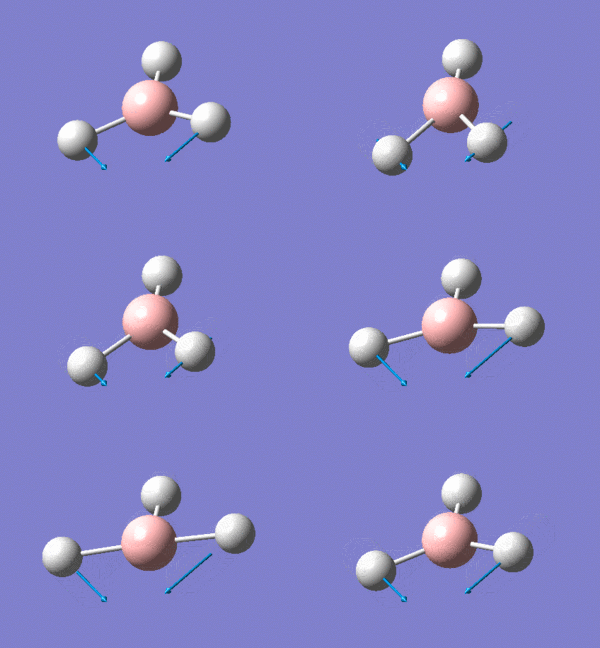
The RMS (root mean square) gradient of the second graph gives the energy of the BH3 molecule at each step of the optimisation performed. This corresponds to finding the sum of the energy gradient divided by the sum of the distance parameter gradient at each point and traversing the potential energy surface of the BH3 molecule to find the critical point at which the gradient is zero. This corresponds to a minima or maxima, through frequency analysis this can be determined and if a minimum is found this is due to the lowest energy optimised structure of BH3. The graphs show the result of solving the Schrodinger equation after each optimisation step, moving towards the lowest energy state of the molecule.

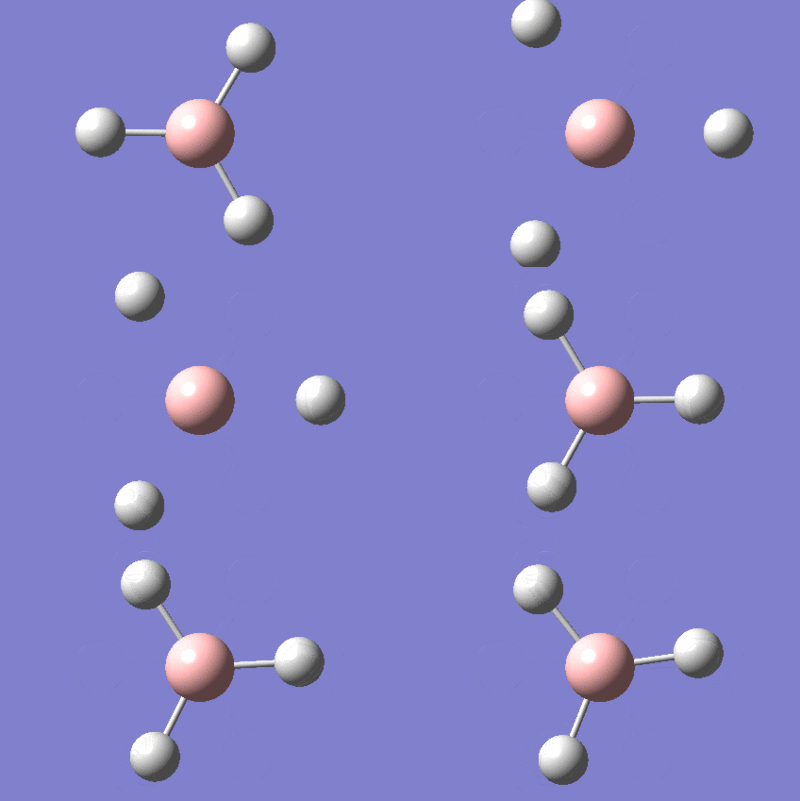
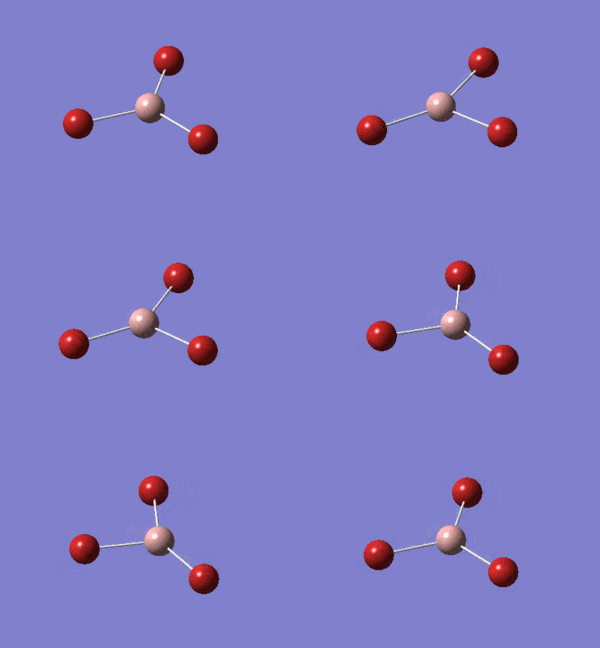
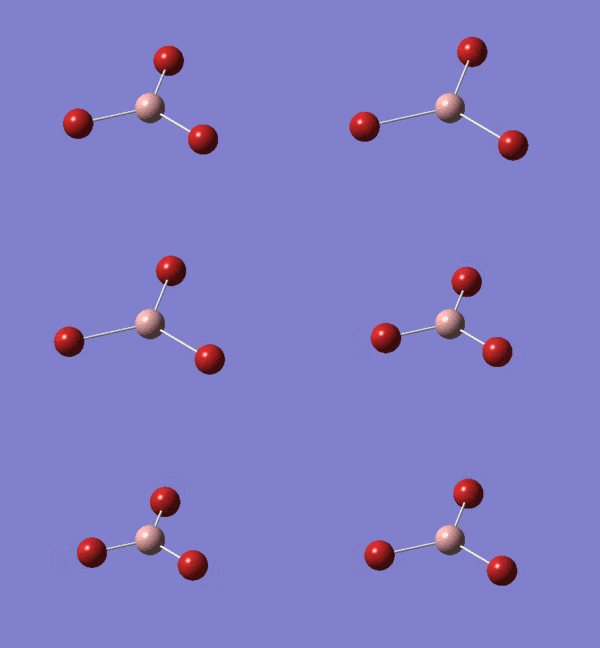
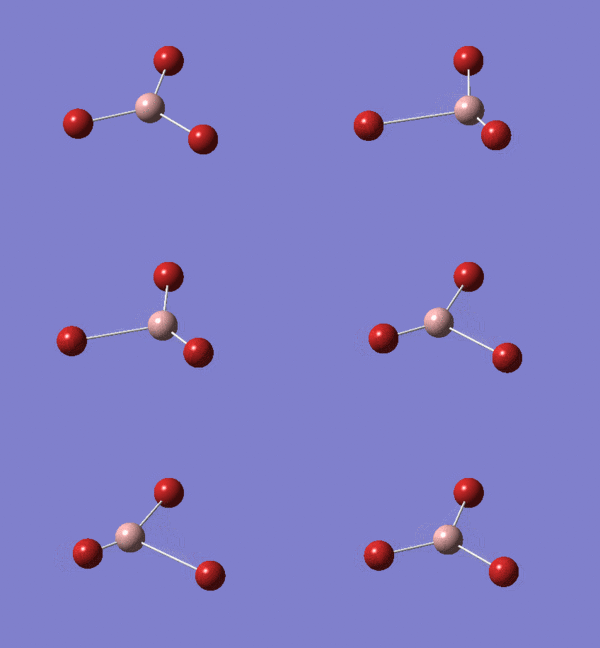
The movie above shows the optimisation steps of the BH3 molecule, it is important to note that the first structure has no visible bonds which highlights the fact that Gaussian visualises bonds based on distance dependent criteria. In fact the bond is present, albeit longer than the accepted pre-defined value.
Optimisation with 6-31G(d,p) basis set
| Property | Output |
|---|---|
| File Name | MWBBH3OPTIMISATION631gdp |
| File Type | .log |
| Calculation Type | FOPT |
| Calculation Method | RB3LYP |
| Basis Set | 6-31G(d,p) |
| Charge | 0 |
| Spin | Singlet |
| E(RB3LYP) | -26.61532360 a.u. |
| RMS Gradient Norm | 0.00000707 a.u. |
| Dipole Moment | 0.00 Debye |
| Point Group | CS |
| Job cpu time | 6.0 seconds |
      Item               Value     Threshold  Converged?
 Maximum Force            0.000012     0.000450     YES
 RMS     Force            0.000008     0.000300     YES
 Maximum Displacement     0.000061     0.001800     YES
 RMS     Displacement     0.000038     0.001200     YES
 Predicted change in Energy=-1.069047D-09
 Optimization completed.
    -- Stationary point found.
The optimisation has converged therefore a stationary point has been found on the BH3 potential energy surface.
The optimisation file is linked here
| Property | Value |
|---|---|
| Optimised average Bond length (Å) | 1.19 |
| Optimised average Bond angle (H-B-H,°) | 120.0 |
The literature value of the B-H bond length was found to be 1.190 Å which matches well with the computed value, but could be improved further by use of a larger basis set.[1]
Energies of molecules can only be compared if they have the same number of atoms and with exactly the same basis-set used on every atom. The energy difference the between the two optimisations using different basis sets was 0.15305931 a.u., which is about 402 kJ/mol. This is a large amount of energy and so comparisons between the basis sets are not valid and have no quantitative significance. However it can be seen that the the 6-31G(d,p) basis set gives a much better approximation than the 3-21G basis set as the 6-31G double-zeta basis set includes two polarisation functions which account for the distortion of orbitals from their ideal shapes and so gives an overall more accurate description.
GaBr3 Optimisation
GaBr3 was constrained to a D3h geometry and was optimised using a medium level LanL2DZ basis set and B3LYP method, which includes pseudo potentials applied to heavier non first row atoms due to the increase in electron density in gallium compared to boron. This can cause the system to exhibit relativistic effects which cannot be recovered by the standard Schrodinger equation and so pseudo potentials are used to account for this.
| Property | Output |
|---|---|
| File Name | log_88461(1) |
| File Type | .log |
| Calculation Type | FOPT |
| Calculation Method | RB3LYP |
| Basis Set | LANL2DZ |
| Charge | 0 |
| Spin | Singlet |
| E(RB3LYP) | -41.70082783 a.u. |
| RMS Gradient Norm | 0.00000016 a.u. |
| Dipole Moment | 0.00 Debye |
| Point Group | D3H |
| Job cpu time | 27.8 seconds |
       Item               Value     Threshold  Converged?
 Maximum Force            0.000000     0.000450     YES
 RMS     Force            0.000000     0.000300     YES
 Maximum Displacement     0.000003     0.001800     YES
 RMS     Displacement     0.000002     0.001200     YES
 Predicted change in Energy=-1.282680D-12
 Optimization completed.
    -- Stationary point found.
The optimisation has converged therefore a stationary point has been found on the GaBr3 potential energy surface.
The optimisation file is linked here
| Property | Value |
|---|---|
| Optimised average Bond length (Å) | 2.35 |
| Optimised average Bond angle (Br-Ga-Br,°) | 120.0 |
The GaBr3 monomer has a literature bond length of 2.250 Å which is in good agreement with the computed value, however a more accurate value could be obtained by using a larger basis set in the optimisation.[2]
BBr3 Optimisation
BBr3 molecule was optimised using the GEN basis set, a pseudo potential was also applied to the Br atoms by using the keyword "pseudo=read gfinput", the LanL2DZ basis set was used for the bromine atoms while the 6-31G(d,p) basis set was used for boron.
| Property | Output |
|---|---|
| File Name | BBr3optGEN |
| File Type | .log |
| Calculation Type | FOPT |
| Calculation Method | RB3LYP |
| Basis Set | Gen |
| Charge | 0 |
| Spin | Singlet |
| E(RB3LYP) | -64.43644911 a.u. |
| RMS Gradient Norm | 0.00000968 a.u. |
| Dipole Moment | 0.00 Debye |
| Point Group | CS |
| Job cpu time | 38.9 seconds |
Item               Value     Threshold  Converged?
 Maximum Force            0.000018     0.000450     YES
 RMS     Force            0.000010     0.000300     YES
 Maximum Displacement     0.000112     0.001800     YES
 RMS     Displacement     0.000064     0.001200     YES
 Predicted change in Energy=-2.260115D-09
 Optimization completed.
    -- Stationary point found.
The optimisation has converged therefore a stationary point has been found on the BBr3 potential energy surface.
The optimisation file is linked here
| Property | Value |
|---|---|
| Optimised average Bond length (Å) | 1.93 |
| Optimised average Bond angle (Br-B-Br,°) | 120.0 |
The BBr3 monomer has a literature bond length of 1.904 Å which is in good agreement with the computed value, however a more accurate value could be obtained by using a larger basis set in the optimisation.[3]
Bond Comparison
| Molecule | Bond length (Å) |
|---|---|
| BH3 | 1.19 |
| BBr3 | 1.93 |
| GaBr3 | 2.35 |
On changing the ligand from H to Br, in the case of boron as the central atom, had the effect of weakening and lengthing the bond. Both atoms act as X-type ligands, donating one electron to form a single bond between itself and the central atom. The larger B-Br bond is due to the fact that bromine is a heavier and more electronegative atom and so has more electrons and more diffuse orbitals which forms longer and more polarised bonds than the hydrogen atom. This leads to weaker orbital overlap between the bromine and boron orbitals and so to a weaker and longer bond.
B and Ga are both group 13 elements and so both form single bonds with a trigonal planer structure with bromine. On changing the central atom from B to a heavier Ga atom, the bond was seen to weaken and increase in length. This is due to the fact that Ga has larger more diffuse orbitals compared to boron and so the orbital overlap between the central atom and the Br ligands is weaker, which results in a larger bond length than the B-Br bond.
Bond Discussion
In optimisation calculations it is important to note that some structures have no visible bonds which highlights the fact that Gaussian visualises bonds based on distance dependent criteria. The bond is in fact present, albeit longer than the accepted pre-defined value.
A bond is the directional net attractive force between two atoms,which is a stabilising interaction, and so the total energy of the bond has a lower energy than the separated atoms. A bond is usually an electrostatic interaction between two atoms, as seen in ionic bonding, which results from the transfer of electrons from an electropositve atom to an electronegative atom causing the formation of an anion and cation pair which bond to each other through electrostatic attraction. In the case of covalent bonding, a bond is formed through the sharing of one or more pair of valence electrons between two atoms and the resulting electrostatic attraction between the atoms nuclei and the shared pair of electrons. Metallic bonding is described as the non-directional electrostatic attractions between the cationic metal centres and "sea of electrons" donated from the valence metal orbitals.
Another type of bonding can be described which are much weaker than conventional bonds, these are so called non-covalent interactions. An example of this is a hydrogen bond which is an attractive interaction between a hydrogen atom from a molecule or a molecular fragment X-H where X is more electronegative than H and so an electrostatic force is seen via a dipole-dipole interaction.
Frequency analysis for BH3 and GaBr3
Frequency analysis was performed on BH3 and GaBr3 in order to compare the vibrational modes of the two molecules.
BH3 Frequency Calculation
It was found that when the frequency analysis was performed on the symmetry broken BH3 molecule, which was used in previous calculations, the energy did not converge well to the minimum as the low frequency values were greater than +/- 15cm-1. This indicated a large deviation of the centre of mass translational and rotational frequencies from the accepted values and showed a minimum in the potential energy surface was not found. Therefore BH3 with D3h symmetry was optimised using DFT 6-31G(d,p) basis set and the frequency calculation was run on this.
| Property | Output |
|---|---|
| File Name | MWBBH3OPTIMISATION631GDPFREQ5 |
| File Type | .log |
| Calculation Type | FOPT |
| Calculation Method | RB3LYP |
| Basis Set | 6-31G(d,p) |
| Charge | 0 |
| Spin | Singlet |
| E(RB3LYP) | -26.61532364 a.u. |
| RMS Gradient Norm | 0.00000215 a.u. |
| Dipole Moment | 0.00 Debye |
| Point Group | D3H |
| Job cpu time | 7.0 seconds |
Item               Value     Threshold  Converged?
 Maximum Force            0.000012     0.000450     YES
 RMS     Force            0.000008     0.000300     YES
 Maximum Displacement     0.000061     0.001800     YES
 RMS     Displacement     0.000038     0.001200     YES
 Predicted change in Energy=-1.069047D-09
 Optimization completed.
    -- Stationary point found.
The optimisation file is liked to here
The optimisation has converged therefore a stationary point has been found on the BH3 potential energy surface.
Low frequencies ---  -11.7227  -11.7148   -6.6070   -0.0010    0.0278    0.4278
 Low frequencies --- 1162.9743 1213.1388 1213.1390
The frequency calculation file is liked to here
Here we can see that the low frequencies are not negative and so a minimum energy structure has been found, with the second derivative of the potential energy surface for BH3 being positive, therefore avoiding finding a possible transition state structure.
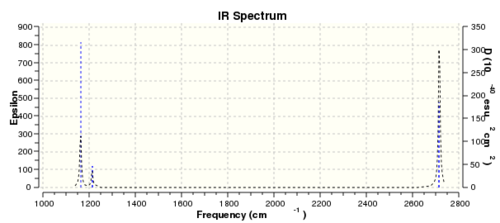
There are only three peaks in the IR spectrum of BH3 as two sets of two of the vibrations are degenerate with the same vibrational frequencies and intensities they overlap and correspond to one peak each(this is seen for the two E' symmetry labelled peaks at 1213 and 2716 cm-1). The symmetrical stretching vibrational mode has no dipole moment and so is IR inactive, therefore doesn't show a peak in the IR spectrum. The remaining peak corresponds to the A2" symmetry labelled bending mode at 1163 cm-1 . Therefore we can see why six vibrations in the BH3 molecule only produce three peaks in the IR spectrum.
GaBr3 Frequency calculation
Frequency analysis was performed on the previously optimised GaBr3 so that the vibrational modes of the molecule could be inspected, low frequency values were shown to be less than +/- 15cm-1, therefore it can be said with some confidence that the minimum energy structure was found.
 Low frequencies ---   -0.5252   -0.5247   -0.0024   -0.0010    0.0235    1.2010
 Low frequencies ---   76.3744   76.3753   99.6982
The frequency calculation file is liked to here
Here we can see that the low frequencies are not negative and so a minimum energy structure has been found, with the second derivative of the potential energy surface for GaBr3 being positive.
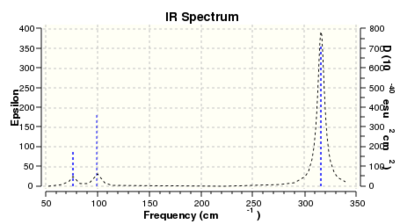
There are three peaks in the IR spectrum of GaBr3 as the two sets of the two E' symmetry labelled vibrations are degenerate with the same vibrational frequencies and intensities. They overlap and correspond to one peak each at 76 and 316 cm-1 wave-numbers respectively. The symmetrical stretching vibrational mode with A1' symmetry has no dipole moment and so is IR inactive, therefore doesn't show a peak in the IR spectrum. The remaining peak corresponds to the A2" symmetry labelled bending mode at 100 cm-1 . Therefore just as with BH3 we can see why six vibrational modes in the GaBr3 molecule only produce three peaks in the IR spectrum.
The lowest real normal vibrational mode is due to the peak at 76 cm-1 with the E' symmetry element.
Vibrational comparison
| No. | BH3 Vibrational frequencies (cm-1) | GaBr3 Vibrational frequencies (cm-1) |
|---|---|---|
| 1 | 1163 | 76 |
| 2 | 1213 | 76 |
| 3 | 1213 | 100 |
| 4 | 2583 | 197 |
| 5 | 2716 | 316 |
| 6 | 2716 | 316 |
The large difference in frequency values between BH3 and GaBr3 indicates that the GaBr3 molecule has weaker bonds, which is due to the poorer orbital overlap of the Ga sp2 orbital with Br and a larger difference in electronegativty compared with B and H leading to a more polarised and weaker bond. The difference in frequency values also stems from the fact that the Ga-Br bond has a much higher reduced mass than the B-H bond due to the fact the atoms are much heavier, this relationship can be seen in the equation below.

It can be seen from the comparison of the vibrational modes of both molecules that a reordering of modes has occured, the A2" mode in GaBr3 is higher in energy than the degenerate E' mode, which is the opposite way around in the BH3 molecule. This is due to the fact that in the GaBr3 molecule the Br ligands are heavier than the central Ga atom and so remain much more stationary relative to the Ga atom vibrating up and down. This is reversed in the case of BH3 as the H atoms are much lighter than the B atom and so they vibrate more than the relatively stationary central atom in the A2" mode. This differnce leads to the relative shift and reordering of energies in the E' and A2" vibrational modes. However the two spectra are similar as they both have three peaks due to the fact that both molecules have D3h symmetry and four atoms, leading to both spectra having 3N-6 (N=4) vibrational modes. It can also be seen that in both spectra the A2" and E' modes at low energy, and also the A1' and E' modes at higher energy, lie close together. This is due to the fact that the lower energy vibrations are both bending vibrational modes and the higher energy vibrations are both stretching modes.
The same method and basis set must be used for both optimisation and frequency analysis to ensure that the frequency calculations can be performed on the same potential energy surface that the molecule was optimised one so that the values obtained are meaningful. The purpose of carrying out a frequency analysis is to ensure a minimum in the potential energy surface for the molecule has been found, and also that the computationally obtained results can be compared to experimental findings to check the accuracy of the computational methods employed. Low frequencies represent the centre of mass motion of the molecule through the three translational and three rotational eigenvalues reported, and theoretically should equal zero, however in this case they are within an accepted range of +/-15cm-1 which corresponds to a well optimised molecule at an energy minimum.
Molecular Orbitals of BH3
A population analysis was done using the previously optimised BH3 molecule with 6-31G(d,p)basis and B3LYP method with keywords pop=full, opt=tight, int=ultrafine, scf=conver=9.
The population analysis file is liked to here

The real MOs computed by Gaussian match up well with the LCAO MOs predicted by MO theory. This shows us that for small molecules like BH3 qualitative MO theory is accurate, however for larger molecules deviations would be expected due to larger basis sets needed to model the molecule accurately.
NBO Analysis for NH3
NH3 was optimised using the 6-31G(d,p) basis set and B3LYP method using keywords opt=tight, int=ultrafine, scf=conver=9. As the molecule is small a higher level basis set can be used straight away to model it.
| Property | Output |
|---|---|
| File Name | NH3optmisation631gdpFREQ |
| File Type | .log |
| Calculation Type | FREQ |
| Calculation Method | RB3LYP |
| Basis Set | 6-31G(d,p) |
| Charge | 0 |
| Spin | Singlet |
| E(RB3LYP) | -56.55776872 a.u. |
| RMS Gradient Norm | 0.00000322 a.u. |
| Dipole Moment | 1.85 Debye |
| Point Group | C3 |
| Job cpu time | 9.0 seconds |
  Item               Value     Threshold  Converged?
 Maximum Force            0.000006     0.000015     YES
 RMS     Force            0.000004     0.000010     YES
 Maximum Displacement     0.000012     0.000060     YES
 RMS     Displacement     0.000008     0.000040     YES
 Predicted change in Energy=-9.845967D-11
 Optimization completed.
    -- Stationary point found.
The optimisation has converged therefore a stationary point has been found on the NH3 potential energy surface.
The optimisation calculation file is liked to here
Low frequencies ---   -0.0137   -0.0025    0.0014    7.0781    8.0927    8.0932
 Low frequencies --- 1089.3840 1693.9368 1693.9368
Here we can see that the low frequencies are not negative and so a minimum energy structure has been found, with the second derivative of the potential energy surface for NH3 being positive.
The frequency calculation file is liked to here
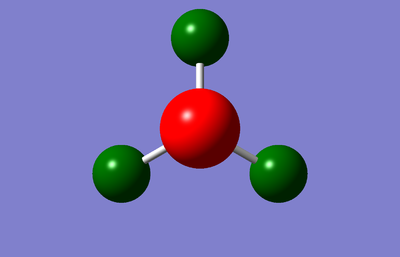
Charge range is from -1.125 to +1.125, it can be seen that the nitrogen atom has a highly negative charge as expected, as it has a much larger electronegativity value than the hydrogen atoms.

Above the charge distribution values for the individual atoms are shown (-1.125 for N, and +0.375 for the H atoms). The sum of the charges add up to zero which confirms the fact that NH3 is a neutral molecule.
The population analysis file is liked to here
Summary of Natural Population Analysis
                                       Natural Population
                Natural  -----------------------------------------------
    Atom  No    Charge         Core      Valence    Rydberg      Total
 -----------------------------------------------------------------------
      N    1   -1.12514      1.99982     6.11104    0.01429     8.12514
      H    2    0.37505      0.00000     0.62250    0.00246     0.62495
      H    3    0.37505      0.00000     0.62250    0.00246     0.62495
      H    4    0.37505      0.00000     0.62250    0.00246     0.62495
 =======================================================================
   * Total *    0.00000      1.99982     7.97852    0.02166    10.00000
The charge distribution for the atoms are shown as above, the majority of the electron density is seen to be located on the central nitrogen atom, which acts as a Lewis base, donating electron density into the hydrogen orbitals.
(Occupancy) Bond orbital/ Coefficients/ Hybrids
 ---------------------------------------------------------------------------------
     1. (1.99909) BD ( 1) N   1 - H   2
                ( 68.83%)   0.8297* N   1 s( 24.86%)p 3.02( 75.05%)d 0.00(  0.09%)
                                            0.0001  0.4986  0.0059  0.0000  0.0000
                                            0.0000  0.8155  0.0277 -0.2910  0.0052
                                            0.0000  0.0000 -0.0281 -0.0087  0.0014
                ( 31.17%)   0.5583* H   2 s( 99.91%)p 0.00(  0.09%)
                                            0.9996  0.0000  0.0000 -0.0289  0.0072
     2. (1.99909) BD ( 1) N   1 - H   3
                ( 68.83%)   0.8297* N   1 s( 24.86%)p 3.02( 75.05%)d 0.00(  0.09%)
                                            0.0001  0.4986  0.0059  0.0000 -0.7062
                                           -0.0239 -0.4077 -0.0138 -0.2910  0.0052
                                            0.0076  0.0243  0.0140  0.0044  0.0014
                ( 31.17%)   0.5583* H   3 s( 99.91%)p 0.00(  0.09%)
                                            0.9996  0.0000  0.0250  0.0145  0.0072
     3. (1.99909) BD ( 1) N   1 - H   4
                ( 68.83%)   0.8297* N   1 s( 24.86%)p 3.02( 75.05%)d 0.00(  0.09%)
                                            0.0001  0.4986  0.0059  0.0000  0.7062
                                            0.0239 -0.4077 -0.0138 -0.2910  0.0052
                                           -0.0076 -0.0243  0.0140  0.0044  0.0014
                ( 31.17%)   0.5583* H   4 s( 99.91%)p 0.00(  0.09%)
                                            0.9996  0.0000 -0.0250  0.0145  0.0072
     4. (1.99982) CR ( 1) N   1           s(100.00%)
                                            1.0000 -0.0002  0.0000  0.0000  0.0000
                                            0.0000  0.0000  0.0000  0.0000  0.0000
                                            0.0000  0.0000  0.0000  0.0000  0.0000
     5. (1.99721) LP ( 1) N   1           s( 25.38%)p 2.94( 74.52%)d 0.00(  0.10%)
                                            0.0001  0.5036 -0.0120  0.0000  0.0000
                                            0.0000  0.0000  0.0000  0.8618 -0.0505
                                            0.0000  0.0000  0.0000  0.0000 -0.0310<
The information in the table above shows that the electron density in the two centre two electron bonds are primary from the nitrogen atom orbitals which makes up 69% of the bond and have a hybridisation of 25%s+75%p, whilst 31% of the electron density of the bond comes from the H orbital which is 100%s.
Second Order Perturbation Theory Analysis of Fock Matrix in NBO Basis
Threshold for printing: 0.50 kcal/mol
This table summarises interactions from bonding NBOs into non-bonding or antibonding orbitals. However it is not of interest as the value is below 20 kcal/mol.
Natural Bond Orbitals (Summary)
                                                            Principal Delocalizations
           NBO                        Occupancy    Energy   (geminal,vicinal,remote)
 ====================================================================================
 Molecular unit  1  (H3N)
     1. BD (   1) N   1 - H   2          1.99909    -0.60417
     2. BD (   1) N   1 - H   3          1.99909    -0.60417
     3. BD (   1) N   1 - H   4          1.99909    -0.60417
     4. CR (   1) N   1                  1.99982   -14.16768
     5. LP (   1) N   1                  1.99721    -0.31757  16(v),20(v),24(v),17(v)
The table above summarises the energy and occupation of the N-H bonds, and the nitrogen lone pair. All the N-H bonds are at the same energy of -0.6 a.u., whereas the core nitrogen orbital is higher in energy with an energy of -14.2 a.u. This is why we leave the core orbitals off an MO diagram, as they are very deep in energy compared to the valence orbitals and so are low-lying enough to be irrelevant in terms of the valence bonding scheme.
Association energies: Ammonia-Borane
In the molecule the nitrogen atom formally donates two electrons to the boron atom. However in reality the electrons are shared between the boron and nitrogen, this was shown in the NBO analysis above.
NH3BH3 was optimised using the 6-31G(d,p) basis set and B3LYP method with the keywords opt=tight, int=ultrafine, scf=conver=9.
| Property | Output |
|---|---|
| File Name | NH3BH3optimisation631Gdp |
| File Type | .log |
| Calculation Type | FOPT |
| Calculation Method | RB3LYP |
| Basis Set | 6-31G(d,p) |
| Charge | 0 |
| Spin | Singlet |
| E(RB3LYP) | -83.22468908 a.u. |
| RMS Gradient Norm | 0.00000138 a.u. |
| Dipole Moment | 5.56 Debye |
| Point Group | C1 |
| Job cpu time | 1 minutes 30.0 seconds |
         Item               Value     Threshold  Converged?
 Maximum Force            0.000002     0.000015     YES
 RMS     Force            0.000001     0.000010     YES
 Maximum Displacement     0.000034     0.000060     YES
 RMS     Displacement     0.000010     0.000040     YES
 Predicted change in Energy=-1.180805D-10
 Optimization completed.
    -- Stationary point found.
The optimisation has converged therefore a stationary point has been found on the NH3BH3 potential energy surface.
The optimisation calculation file is liked to here
Low frequencies ---   -2.9451   -0.0014   -0.0011   -0.0010    1.7800    3.7236
 Low frequencies ---  263.3834  632.9581  638.4631
Here we can see that the low frequencies are not negative and so a minimum energy structure has been found, with the second derivative of the potential energy surface for NH3BH3 being positive.
The frequency calculation file is liked to here
Association energy calaculations
An analysis of the bond association energy of the combination of NH3 and BH3 to form NH3BH3 is provided below.
| Molecule | Energy (a.u.) |
|---|---|
| NH3 | -56.55776872 |
| BH3 | -26.61532364 |
| NH3BH3 | -83.22468908 |
The association energy of NH3 and BH3 can be calculated by using the following equation:
ΔE = E(NH3BH3) − [(E(BH3) + E(NH3)]
ΔE = -83.22468908(a.u.) - [( -26.61532364(a.u.)) + ( -56.55776872(a.u.)]
ΔE = − 0.05159672(a.u.)
The energy value was then converted from Hartrees to kJ/mol by multiplying by a conversion factor of 2625.50 producing a value of ΔE = -135.46719868 kJ/mol. Conversely we can see that the value of NH3BH3 dissociation bond energy is +135.46719868 kJ/mol.
This value of the bond association energy is a reasonable value as it is within the usual range of bond energies being hundreds of kJ/mol, roughly 100-600 kJ/mol for common molecules.
References
- ↑ Kawaguchi Kentarou,Fourier transform infrared spectroscopy of the BH3 ν3 band, Journal of Chemical Physics, 1992, 96 (5),3411
- ↑ Balazs Reffy, Maria Kolonits and Magdolna Hargittai,Gallium tribromide: molecular geometry of monomer and dimer from gas-phase electron diffraction, Journal of Molecular Structure, 1998, 445, 139
- ↑ Martinsen, Kjell-Gunnar; Vogt, Natalja; Volden, Hans Vidar; Lyutsarev, Vasilii S. and Vogt, Jurgen,Molecular structure and force field of boron tribromide as determined from combined analysis of gas electron diffraction and spectroscopic data and supported by quantum-chemical density-functional calculations, Journal of Molecular Structure, 1996, 385 (3), 159


