Rep:Mod:MN1315
EX3
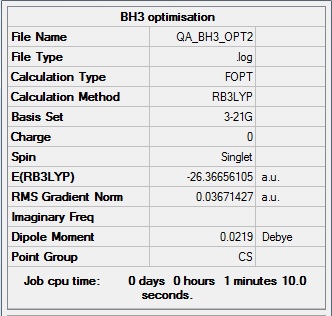
BH3:
B3LYP/6-31G(d,p) level
"Item" table from optimisation
         Item               Value     Threshold  Converged?
 Maximum Force            0.000012     0.000450     YES
 RMS     Force            0.000008     0.000300     YES
 Maximum Displacement     0.000064     0.001800     YES
 RMS     Displacement     0.000039     0.001200     YES
Link to frequency *.log file: MN_BH3_FREQ.LOG
 Low frequencies ---  -98.4446  -42.9135  -30.3868   -5.4378   -5.1683   -1.2984
 Low frequencies ---   -0.0064    0.0046    0.0066
Jmol dynamic image
Optimised BH3 molecule |
BH3 calculated IR spectrum
BH3 Vibrations
| Frequency / cm-1 | Intensity | Symmetry | IR Active? | Type of Vibration |
|---|---|---|---|---|
| 1163 | 93 | A2" | Yes | Bend: out-of-plane |
| 1213 | 14 | E' | Slightly | Bend |
| 1213 | 14 | E' | Slightly | Bend |
| 2582 | 0 | A1' | No | Stretch - Symmetrical |
| 2716 | 126 | E' | Yes | Stretch - Asymmetrical |
| 2716 | 126 | E' | Yes | Stretch - Asymmetrical |
As seen above, only three peaks are present in the IR spectrum while the table of BH3 lists six vibrational modes. The reason for this is twofold: the vibration at 2582 cm-1 is symmetrical, and hence there is no net change in dipole moment. Hence, acccording to the vibrational selection rule, no peak is observed in the spectrum. Also, there is degeneracy amongst the remaining vibrations: two share the frequency of 1213 cm-1 and two share the frequency of 2716 cm-1. Only one peak will be observed for each in the spectrum, and therefore only three peaks are present in the spectrum overall.
MO diagram for BH3
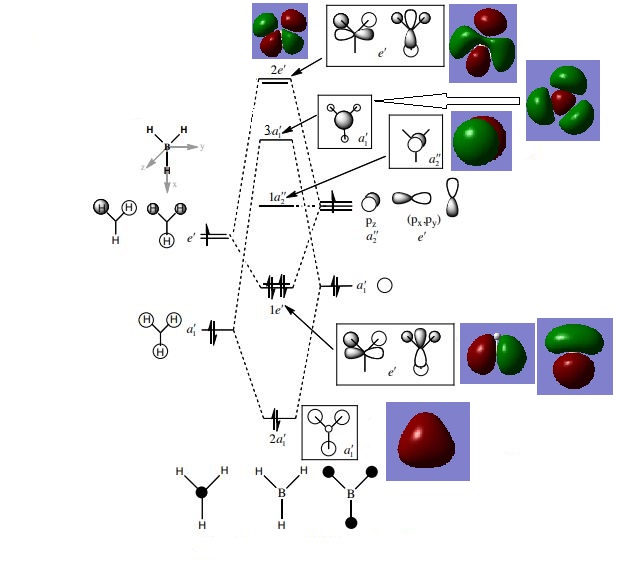
Are there any significant differences between the real and LCAO MOs? As can be seen in this diagram, there are no significant differences between the real and LCAO MOs. For simple molecules, a good depiction of the real orbitals can be attained from LCAO: they have similar shapes and correct numbers of nodes.
Ng611 (talk) 20:52, 29 May 2019 (BST) Are there any discrepancies at all?
What does this say about the accuracy and usefulness of qualitative MO theory? As mentioned this indicates that, for simple molecules, qualitative MO theory is both a useful and accurate way of generating representations of molecular orbitals.
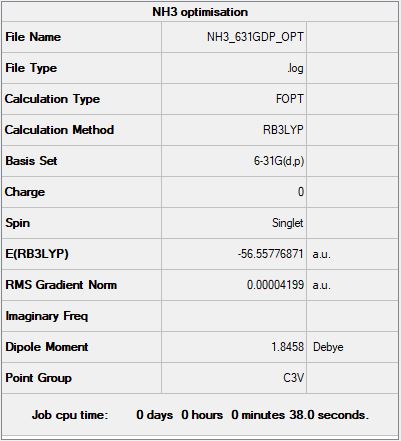
NH3:
B3LYP/6-31G(d,p) level
"Item" table from optimisation
          Item               Value     Threshold  Converged?
 Maximum Force            0.000060     0.000450     YES
 RMS     Force            0.000040     0.000300     YES
 Maximum Displacement     0.000369     0.001800     YES
 RMS     Displacement     0.000162     0.001200     YES
Link to frequency *.log file: MN_NH3_FREQ.LOG
Low frequencies ---  -32.4235  -32.4224  -11.4276   -0.0050    0.0112    0.0476
Low frequencies --- 1088.7628 1694.0251 1694.0251
Jmol dynamic image
Optimised NH3 molecule |
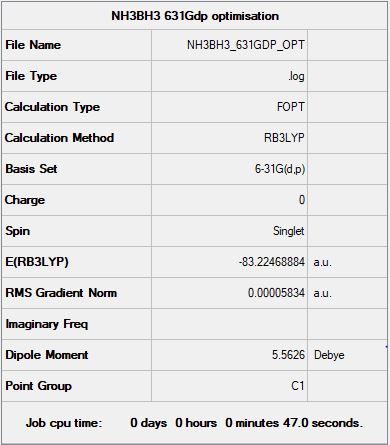
NH3BH3:
B3LYP/6-31G(d,p) level
"Item" table from optimisation
Item               Value     Threshold  Converged?
 Maximum Force            0.000138     0.000450     YES
 RMS     Force            0.000038     0.000300     YES
 Maximum Displacement     0.001020     0.001800     YES
 RMS     Displacement     0.000224     0.001200     YES
Link to frequency *.log file: MN_NH3BH3_FREQ.LOG
Low frequencies ---  -22.2141    0.0006    0.0011    0.0017   14.6753   19.2320
Low frequencies ---  262.2651  631.2340  638.2655
Jmol dynamic image
Optimised NH3BH3 molecule |
Ammonia-Borane association energy calculation
E(NH3) = -56.55777 a.u.
E(BH3) = -26.61532 a.u.
Ng611 (talk) 20:53, 29 May 2019 (BST) This doesn't match the result of your BH3 calculation. Why?
E(NH3BH3) = -83.22469 a.u.
ΔE=E(NH3BH3)-[E(NH3)+E(BH3)] = (-83.22469)-((-56.55777)+(-26.61532))
Association Energy (a.u.) = -0.05160 a.u.
Association Energy (kJ/mol) = -135 kJ/mol
Therefore the B-N dative bond is weak, with a dissociation energy of 135 kJ/mol, in comparison to the C-C bond in ethane which has a dissociation energy of 377 ± 0.8 kJ/mol. Luo, Y. R. Comprehensive Handbook of Chemical Bond Energies, CRC Press, Boca Raton, FL, 2007
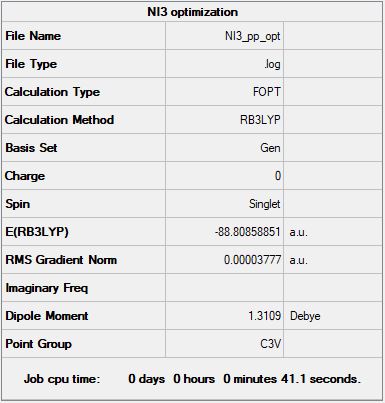
NI3:
B3LYP/6-31G(d,p)LANL2DZ level
Ng611 (talk) 20:54, 29 May 2019 (BST) Where's your bond length?
"Item" table from optimisation
       Item               Value     Threshold  Converged?
 Maximum Force            0.000067     0.000450     YES
 RMS     Force            0.000044     0.000300     YES
 Maximum Displacement     0.000482     0.001800     YES
 RMS     Displacement     0.000327     0.001200     YES
Link to optimization *.log file: NI3_pp_opt.log
Jmol dynamic image
Optimised NI3 molecule |
Project section
Main group halides
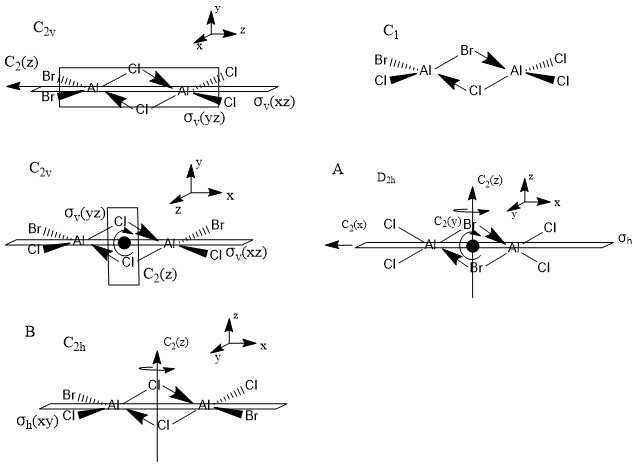
There are five possible isomers of Al2Cl4Br2, pictured below along with their point groups and symmetry elements:
Isomers A (with two bridging Br ions) and B (trans terminal Br and bridging Cl ions) were investigated.
Isomer A
B3LYP/6-31G(d,p) level
"Item" table from optimisation
 Item               Value     Threshold  Converged?
 Maximum Force            0.000003     0.000450     YES
 RMS     Force            0.000001     0.000300     YES
 Maximum Displacement     0.000030     0.001800     YES
 RMS     Displacement     0.000013     0.001200     YES
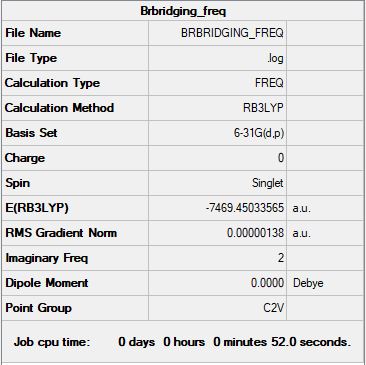
Link to frequency *.log file: BRBRIDGING_FREQ.LOG
Low frequencies ---  -75.7495  -51.3004   -6.9523   -4.2931   -3.3253   -0.0088
Low frequencies ---   -0.0049   -0.0018   30.4972
Jmol dynamic image
Optimised Isomer A |
Isomer B
B3LYP/6-31G(d,p) level
"Item" table from optimisation
  Item               Value     Threshold  Converged?
 Maximum Force            0.000152     0.000450     YES
 RMS     Force            0.000068     0.000300     YES
 Maximum Displacement     0.001500     0.001800     YES
 RMS     Displacement     0.000646     0.001200     YES
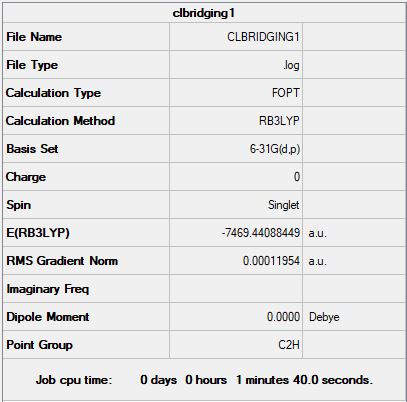
Link to frequency *.log file: CLBRIDGINGFREQ1.LOG
 Low frequencies ---  -98.4446  -42.9135  -30.3868   -5.4378   -5.1683   -1.2984
 Low frequencies ---   -0.0064    0.0046    0.0066
Jmol dynamic image
Optimised Isomer B |
Relative stability of isomers A and B
E(isomer A) = -7469.45034 a.u.
E(isomer B) = -7469.44088 a.u.
ΔE = (-7469.44088) - (-7469.45034)- = 0.00946 a.u.
ΔE = 24.84 kJ/mol
Isomer B, with trans terminal Br and bridging Cl ions, is 24.84 kJ/mol higher in energy than isomer A, with two bridging Br ions. This could be due to the larger Br ions relieving some of the angle strain in the molecule.
Ng611 (talk) 20:57, 29 May 2019 (BST) Unfortunately, your starting energies were incorrect (as you used 6-31G and not 6-31G/LANL2DZ) and this has led you to predict the wrong trend.
Al2Cl2Br
B3LYP/6-31G(d,p) level
"Item" table from optimisation
Item               Value     Threshold  Converged?
 Maximum Force            0.000021     0.000450     YES
 RMS     Force            0.000014     0.000300     YES
 Maximum Displacement     0.000190     0.001800     YES
 RMS     Displacement     0.000105     0.001200     YES
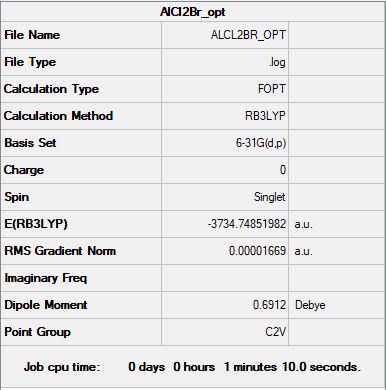
Link to frequency *.log file: ALCL2BR_FREQ.LOG
Low frequencies ---   -2.8061   -2.1898    0.0058    0.0067    0.0129    5.8239
Low frequencies ---  125.0193  137.5089  194.8968
Jmol dynamic image
Al2Cl2Br |
Dissociation energy for isomer A into 2AlCl2Br
E(isomer A) = -7469.45034 a.u.
E(AlCl2Br) = -3734.74851 a.u.
ΔE = 2E(AlCl2Br)-[E(isomer A)] = -0.0467 a.u.
Dissociation energy (a.u.) = -0.0467 a.u.
Association Energy (kJ/mol) = -122.6 kJ/mol
Therefore the product is less stable than the isolated isomers.
Molecular Orbitals of isomer A
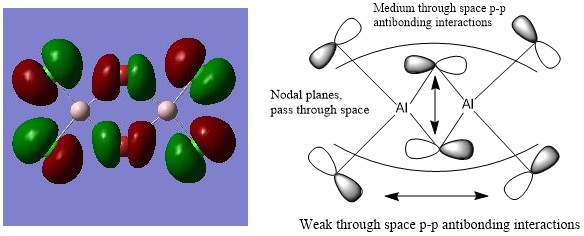
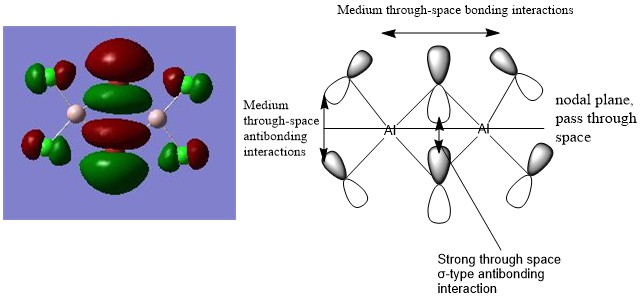
Antibonding: HOMO
Nonbonding: HOMO - 5
Bonding: HOMO - 10
Ng611 (talk) 21:00, 29 May 2019 (BST) Do you mean to have s-orbitals on your Br atoms, or are you just trying to represent the atoms themselves?

