Rep:Mod:MLW1152
Computational Molecular Analysis
BH3
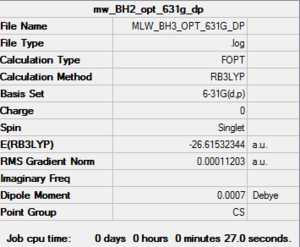
Optimisation
B3LYP/ 6-31G (d,p)
Item Table
Item               Value     Threshold  Converged?
 Maximum Force            0.000283     0.000450     YES
 RMS     Force            0.000116     0.000300     YES
 Maximum Displacement     0.001036     0.001800     YES
 RMS     Displacement     0.000587     0.001200     YES
Opt + Freq
After having discussed with Dr. Hunt an opt+freq was carried out constraining the point group to D3h. The difference in energy was negligible (last 2 dp) so the following work was not altered, but the opt+ freq is included:
B3LYP/ 6-31G (d,p)
  Item               Value     Threshold  Converged?
 Maximum Force            0.000004     0.000450     YES
 RMS     Force            0.000003     0.000300     YES
 Maximum Displacement     0.000017     0.001800     YES
 RMS     Displacement     0.000011     0.001200     YES
Frequency Analysis
Frequency Analysis Log File
 Low frequencies ---   -4.3230   -1.1744   -0.0055    1.1443    9.3739    9.4472
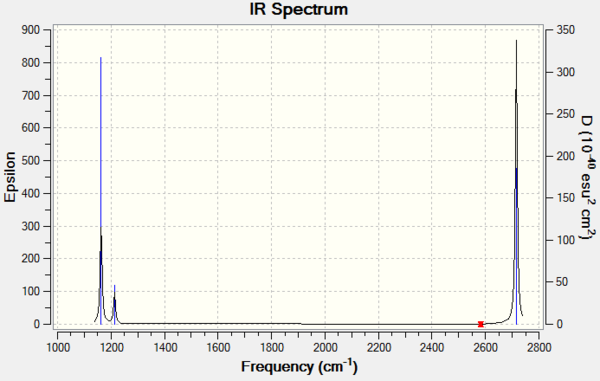
 Low frequencies --- 1162.9805 1213.1719 1213.1746
BH |
| Mode | Wavenumber (cm-1 ) | Intensity (arbitrary units) | Symmetry | IR Active | Type |
|---|---|---|---|---|---|
| 1 | 1163 | 93 | A2 | Yes | Out of plane bend |
| 2 | 1213 | 14 | E' | Very slight | Bend |
| 3 | 1213 | 14 | E' | Very slight | Bend |
| 4 | 2582 | 0 | A1' | No | Symmetric stretch |
| 5 | 2716 | 126 | E' | Yes | Asymmetric stretch |
| 6 | 2716 | 126 | E' | Yes | Asymmetric stretch |
Note: Systematic errors on frequency are around 10%
There are 3 vibrational peaks shown on the IR spectrum above. There are 6 vibrational modes however. Mode 1, 2/3 and 5/6 are shown on the spectrum. 2 and 3 are both bends occurring at the same frequency so only one peak is shown as they are degenerate. Similarly 5 and 6 are both asymmetric stretches absorbing at the same frequency. 4 is symmetric and results in no net change in dipole moment so is not IR active
MO Diagram
Ng611 (talk) 18:50, 21 May 2018 (BST) Don't forget to include the computed MOs for the highest antibonding orbitals.
The initial MO diagram was taken from Dr Hunt's lecture notes with the generates MO's added in. [1]
The computer calculated MOs appear larger and more diffuse than the predicted ones. They are also shown to be combined. However in general the predicted MOs correspond exactly to the general shape and pattern. This demonstrates the qualitative MO approach is extremely useful to assess the MOs of molecules.
NH3
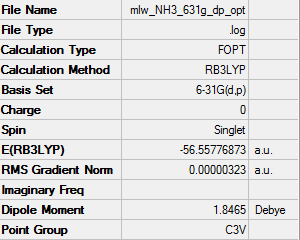
Optimisation
B3LYP/ 6-31G (d,p)
Item Table
         Item               Value     Threshold  Converged?
 Maximum Force            0.000006     0.000450     YES
 RMS     Force            0.000004     0.000300     YES
 Maximum Displacement     0.000012     0.001800     YES
 RMS     Displacement     0.000008     0.001200     YES
Frequency Analysis
Frequency Analysis Log File MWILLS_NH3_FREQ.LOG
Low frequencies ---   -8.5646   -8.5588   -0.0041    0.0455    0.1784   26.4183
 Low frequencies --- 1089.7603 1694.1865 1694.1865
BH |
NH3BH3
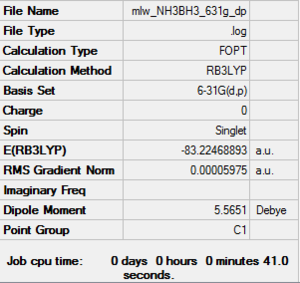
Optimisation
B3LYP/ 6-31G (d,p)
Item Table
         Item               Value     Threshold  Converged?
 Maximum Force            0.000122     0.000450     YES
 RMS     Force            0.000058     0.000300     YES
 Maximum Displacement     0.000513     0.001800     YES
 RMS     Displacement     0.000296     0.001200     YES
Frequency Analysis
Frequency Analysis Log File MLWILLS_NH3BH3_FREQ.LOG
Low frequencies ---   -0.0014   -0.0014   -0.0013   15.2004   18.7944   42.3939
 Low frequencies ---  266.2666  632.2878  639.1356
BH |
Association Energies: Ammonia-Borane
Energies
| Molecule | Energy (Hartree ) |
|---|---|
| NH3 | -26.61532 |
| BH3 | -56.55776 |
| NH3BH3 | -83.22468 |
B-N Bond Strength:
ΔE= E(NH3BH3)-[E(NH3)+E(BH3)]
ΔE=-0.0516 hartree
ΔE=-135 kJ mol-1
The calculated bond strength is low, compared to an average B-B bond strength at 293 kJ mol-1. The bond length is 1.67 Å, compared to B-H 1.21 Å and N-H 1.02 Å which have average bond energies of 389 kJ mol-1 and 386 kJ mol-1 respectively. [2]. This reflects that the bond is dative covalent and so if weaker than a typical covalent bond. The nitrogen is donating electron density into the vacant anti-bonding orbitals of BH2.
Ng611 (talk) 18:52, 21 May 2018 (BST) Good calculation and good comparison to the literature. Well done!
BBr3
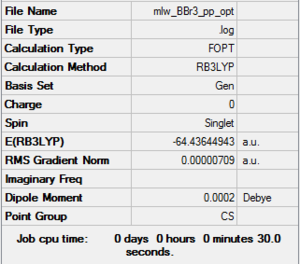
Optimsation
B3LYP/6-31G(d,p)LANL2DZ Optomised D-Space Link: DOI:10042/202369
Item Table
         Item               Value     Threshold  Converged?
 Maximum Force            0.000018     0.000450     YES
 RMS     Force            0.000012     0.000300     YES
 Maximum Displacement     0.000150     0.001800     YES
 RMS     Displacement     0.000085     0.001200     YES
Frequency Analysis
Frequency D-Space Link: DOI:10042/202374
Frequency Analysis Log File
Mlw_BBr3_freq_pp_SC.log
Low frequencies ---   -4.1517   -0.0001    0.0000    0.0001    1.9974    3.3504
 Low frequencies ---  155.8993  155.9413  267.7015
BBr |
Investigating Aromaticity
Benzene
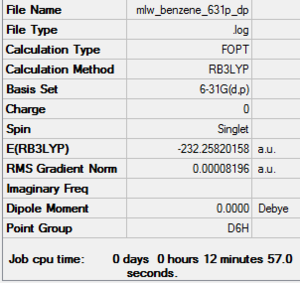
Optimisation
B3LYP/ 6-31G (d,p)
Item Table
   Item               Value     Threshold  Converged?
 Maximum Force            0.000193     0.000450     YES
 RMS     Force            0.000079     0.000300     YES
 Maximum Displacement     0.000830     0.001800     YES
 RMS     Displacement     0.000294     0.001200     YES
Frequency Analysis
Frequency Analysis Log File MLW_BENZENE_FREQ.LOG
Low frequencies ---   -8.5646   -8.5588   -0.0041    0.0455    0.1784   26.4183
Low frequencies --- 1089.7603 1694.1865 1694.1865
BH |
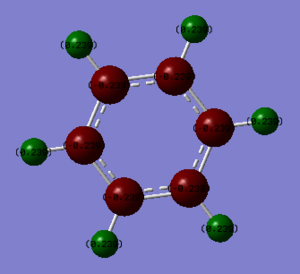
Charge Analysis
| Element | Charge |
|---|---|
| H | 0.239 |
| C | -0.239 |
Borazine
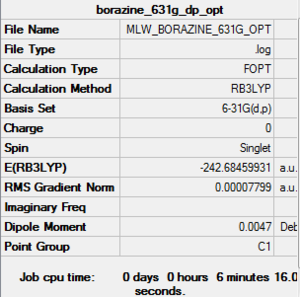
Optimisation
B3LYP/ 6-31G (d,p)
Item Table
          Item               Value     Threshold  Converged?
 Maximum Force            0.000081     0.000450     YES
 RMS     Force            0.000040     0.000300     YES
 Maximum Displacement     0.001792     0.001800     YES
 RMS     Displacement     0.000486     0.001200     YES
Frequency Analysis
Frequency Analysis Log File MLW_BORAZINE_FREQ_FINAL.LOG
  Low frequencies ---  -12.5623    0.0006    0.0009    0.0012    3.1314    8.4390
 Low frequencies ---  288.4703  290.3783  404.4088
BH |
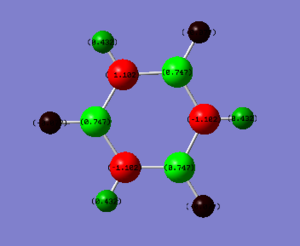
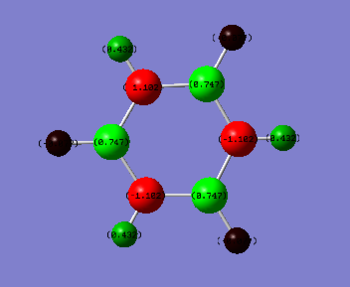
Charge Analysis
| Element | Charge |
|---|---|
| H(-N) | 0.432 |
| H(-B) | -0.077 |
| N | -1.102 |
| B | 0.747 |
Charge Comparison
| Borazine | Benzene |
|---|---|
 |
|
| H(-N) 0.432 | H(-C) 0.239 |
| H(-B) -0.077 | C -0.239 |
| N -1.102 | |
| B 0.747 |
Electronegativity of boron is 2.04, nitrogen 3.04, hydrogen 2.20 and carbon is 2.55 according to Pauling's scale. The polarisation of borazine is considerably more pronounced than benzene. The nitrogen atoms are more electronegative than carbon and the boron is less electronegative than carbon. The connected hydrogen atoms themselves become the most polarised, where the hydrogen atoms bonded to the nitrogen become much more 𝛿+ as the nitrogen withdraws electron density away.
Ng611 (talk) 18:54, 21 May 2018 (BST) Good discussion of the effects of electronegativity on the overall charge distribution. What do the partial charges sum to, and is there any difference in partial charge for atoms related by symmetry?
MO Comparison
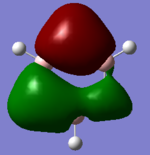
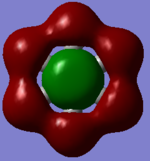
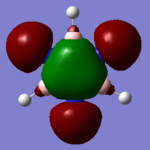
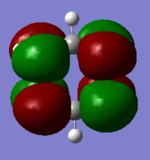
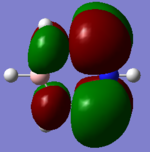
- Note: After having discussed with the demonstrator, the molecule was checked and I was advised to include the MO to demonstrate that often errors can occur and it highlights the importance of qualitatively working out the expected orbitals instead of relying on the calculation.
Each of the MO's shown above reflect the higher symmetry of benzene compared to borazine. The electronegativity differences is highlighted in borazine as the contribution from nitrogen decreases with increased antibonding character and vice versa for boron.
Ng611 (talk) 18:59, 21 May 2018 (BST) Well done for comparing the correct MOs by shape and not energetic ordering (which is not necessarily reliable). I would include a brief discussion of the overall symmetry in the molecules to improve this section further. Perhaps also consider discussing the constituent AOs that form the MOs and the overall symmetry of the MO.
Aromaticity Concepts
Huckel theory states that aromaticity is the stablisation of a molecule with a planar structure and 4n+2 π electrons, occuring in a cyclic array of p-orbitals perpendicular to the plane of the ring.[3] The delocalisation of electrons in this structure leads to stabilisation. However aromatic stabilisation is considerably more complex than that so it is important to consider all molecular orbitals of a system and the resulting stabilisation.
The main qualities of a molecule that are typically demonstrated by an aromatic system include: [4]
- Resonance energy ( aromatic stablisation)
- Equal bond lengths intermediate of single and double
- External magnetic field induces a ring current
- Undergoes aromatic substitution
The pz orbitals are the main orbitals to be considered in the above MO diagram of benzene. [5] However it isn't sufficient to only consider these orbitals. Clearly as it can be seen in the MO snapshots taken of both benzene and borazine that other orbitals aside from just pz are important to the distribution of electrons in the molecules.
The initial concept of aromaticity originated from benzene so the definition followed benzene's structure and chemical properties. However there are many examples that demonstrate aromatic stabilisation but don't strictly follow Huckels rules. At low temperature (20 K) benzene loses it's planarity but retains aromatic stabilisation. Loss of planarity will alter the effectiveness of the pz overlap, demonstrating the importance of the sigma orbital delocalisation. [6]
Benzene and borazine are isoelectronic compounds. In benzene the charge and delocalisation is equal for each carbon atom. In borazine nitrogen is more electronegative than nitrogen leading to an unequal distribution of charge. This results in a lower level of delocalisation and therefore less stablisation compared to benzene.
Ng611 (talk) 19:04, 21 May 2018 (BST) Overall, a good report - very well done. Remember to state what you think may be immediately obvious (such as the summation of partial charges and symmetry) as it's essential information for us to judge whether you've suitably understood the subject matter.
References
- ↑ Hunt, T, (2018), Molecular Orbitals, http://www.huntresearchgroup.org.uk/teaching/teaching_comp_lab_year2a/Tut_MO_diagram_BH3.pdf
- ↑ Cottrell, T,L, (1965) National Standard Reference Data Series
- ↑ https://onlinelibrary.wiley.com/doi/abs/10.1002/anie.199627501
- ↑ Palusiak, M, Krygowski, T, M (2007)Chem. Eur. J.
- ↑ Spivey, A, (2018), Aromaticity Lecture, http://www.imperial.ac.uk/media/imperial-college/research-centres-and-groups/spivey-group/teaching/org1aromatics/lecture11617.pdf
- ↑ Palusiak, M, Krygowski, T, M (2007)Chem. Eur. J.

