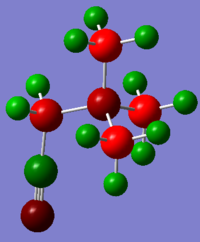
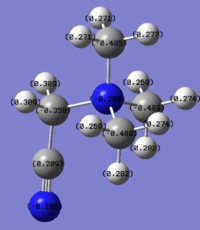
Rep:Mod:MAW210
Computational Lab, Module 2
Maya A Wright
Computational chemistry is a powerful tool in modern chemical research because of its ability to predict the reactivity of molecules that have yet to be synthesised. The purpose of this lab is to use computational chemistry in order to determine the structure, molecular orbitals, and vibrational frequencies of various molecules, and to rationalise the reactivity and properties of these molecules based on the obtained results. GaussView 5.0 was used throughout this module.
Week 1- The Basics
In the first week of this lab, simple trigonal planar molecules were optimised and their vibrational modes were analysed. In addition, a population analysis was conducted on BH3 and the results of the computation were compared to the orbitals predicted by qualitative MO theory. A Natural Bond Orbital analysis was conducted on NH3, and the association energy of NH3BH3 was calculated.
Day 1
BH3 optimisation using 3-21G basis set
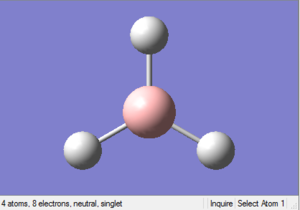
A BH3 molecule was created in GaussView 5.0. The molecule was then optimised using a low accuracy basis set as summarised in the table below:
| Calculation Type | Optimisation |
|---|---|
| Calculation Method | DFT, B3LYP |
| Basis Set | 3-21G |
| Keywords | opt b3lyp/3-21g geom=connectivity |
Optimised BH3 molecule:
The optimisation file is liked to here
| File Type | .log |
|---|---|
| Calculation Type | FOPT |
| Calculation Method | RB3LYP |
| Basis Set | 3-21G |
| Charge | 0 |
| E(RB3LYP) | -26.46226338 a.u. |
| RMS Gradient Norm | 0.00020672 a.u. |
| Dipole Moment | 0.00 Debye |
| Point Group | D3h |
| Job cpu time | 14 s |
The RMS Gradient Norm is less than 0.001, indicating that the optimisation is complete.
Results
Optimimum bond length: 1.193 Å
Optimimum bond angle: 120.0°
Log book:
- It is clear from the item table that the forces and displacements converged, and that the optimisation ran to completion.
 Item               Value     Threshold  Converged?
 Maximum Force            0.000413     0.000450     YES
 RMS     Force            0.000271     0.000300     YES
 Maximum Displacement     0.001610     0.001800     YES
 RMS     Displacement     0.001054     0.001200     YES
 Predicted change in Energy=-1.071764D-06
 Optimization completed.
    -- Stationary point found.
                           ----------------------------
                           !   Optimized Parameters   !
                           ! (Angstroms and Degrees)  !
 --------------------------                            --------------------------
 ! Name  Definition              Value          Derivative Info.                !
 --------------------------------------------------------------------------------
 ! R1    R(1,2)                  1.1935         -DE/DX =    0.0004              !
 ! R2    R(1,3)                  1.1935         -DE/DX =    0.0004              !
 ! R3    R(1,4)                  1.1935         -DE/DX =    0.0004              !
 ! A1    A(2,1,3)              120.0            -DE/DX =    0.0                 !
 ! A2    A(2,1,4)              120.0            -DE/DX =    0.0                 !
 ! A3    A(3,1,4)              120.0            -DE/DX =    0.0                 !
 ! D1    D(2,1,4,3)            180.0            -DE/DX =    0.0                 !
 --------------------------------------------------------------------------------
 GradGradGradGradGradGradGradGradGradGradGradGradGradGradGradGradGradGrad
Graphs:
- The first graph represents the energy of the molecule as a function of optimisation step number. Between steps 3 and 4 the graph forms a plateau, indicating that the system is approaching a stable energy minimum.
- The second graph plots the slope of the energy of the molecule against optimisation number. The force reaches zero at the end of the optimisation. Since (where is the interatomic distance), zero force means the system has reached an equilibrium bond length. From graph 1 we know that this corresponds to an energy minimum, thus the molecule has reached its most stable state.
Day 2
BH3 optimisation using 6-31G(d,p) basis set
| Calculation Type | Optimisation |
|---|---|
| Calculation Method | DFT, B3LYP |
| Basis Set | 6-31G(d,p) |
| Keywords | opt b3lyp/6-31g(d,p) geom=connectivity |
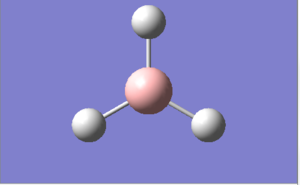
Optimised BH3 molecule
The optimisation file is liked to here
| File Type | .log |
|---|---|
| Calculation Type | FOPT |
| Calculation Method | RB3LYP |
| Basis Set | 6-31G(d,p) |
| Charge | 0 |
| E(RB3LYP) | -26.61532252 a.u. |
| RMS Gradient Norm | 0.00021672 a.u. |
| Dipole Moment | 0.00 Debye |
| Point Group | D3h |
| Job cpu time | 7.0 s |
Item Table:
Item               Value     Threshold  Converged?
 Maximum Force            0.000433     0.000450     YES
 RMS     Force            0.000284     0.000300     YES
 Maximum Displacement     0.001702     0.001800     YES
 RMS     Displacement     0.001114     0.001200     YES
 Predicted change in Energy=-1.189019D-06
 Optimization completed.
    -- Stationary point found.
                           ----------------------------
                           !   Optimized Parameters   !
                           ! (Angstroms and Degrees)  !
 --------------------------                            --------------------------
 ! Name  Definition              Value          Derivative Info.                !
 --------------------------------------------------------------------------------
 ! R1    R(1,2)                  1.1914         -DE/DX =    0.0004              !
 ! R2    R(1,3)                  1.1914         -DE/DX =    0.0004              !
 ! R3    R(1,4)                  1.1914         -DE/DX =    0.0004              !
 ! A1    A(2,1,3)              120.0            -DE/DX =    0.0                 !
 ! A2    A(2,1,4)              120.0            -DE/DX =    0.0                 !
 ! A3    A(3,1,4)              120.0            -DE/DX =    0.0                 !
 ! D1    D(2,1,4,3)            180.0            -DE/DX =    0.0                 !
 --------------------------------------------------------------------------------
 GradGradGradGradGradGradGradGradGradGradGradGradGradGradGradGradGradGrad
Results
Optimised bond length: 1.191 Å
Optimised bond angle: 120.0°
Total Energy of 3-21G Optimised structure: -26.46226338 a.u.
Total Energy of 6-21G(d,p) Optimised structure: -26.61532252 a.u.
TlBr3 Optimisation
| Calculation Type | Optimisation |
|---|---|
| Calculation Method | DFT, B3LYP |
| Basis Set | LANL2DZ |
| Keywords | opt b3lyp/lanl2dz geom=connectivity |
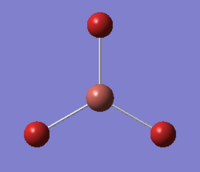
Optimised TlBr3
The optimisation file can be found at DOI:10042/21613
| File Type | .log |
|---|---|
| Calculation Type | FOPT |
| Calculation Method | RB3LYP |
| Basis Set | LANL2DZ |
| Charge | 0 |
| E(RB3LYP) | -91.21812851 a.u. |
| RMS Gradient Norm | 0.00000090 a.u. |
| Dipole Moment | 0.00 Debye |
| Point Group | D3h |
| Job cpu time | 37.5 s |
Item table
 Item               Value     Threshold  Converged?
 Maximum Force            0.000002     0.000450     YES
 RMS     Force            0.000001     0.000300     YES
 Maximum Displacement     0.000022     0.001800     YES
 RMS     Displacement     0.000014     0.001200     YES
 Predicted change in Energy=-6.084072D-11
 Optimization completed.
    -- Stationary point found.
                           ----------------------------
                           !   Optimized Parameters   !
                           ! (Angstroms and Degrees)  !
 --------------------------                            --------------------------
 ! Name  Definition              Value          Derivative Info.                !
 --------------------------------------------------------------------------------
 ! R1    R(1,2)                  2.651          -DE/DX =    0.0                 !
 ! R2    R(1,3)                  2.651          -DE/DX =    0.0                 !
 ! R3    R(1,4)                  2.651          -DE/DX =    0.0                 !
 ! A1    A(2,1,3)              120.0            -DE/DX =    0.0                 !
 ! A2    A(2,1,4)              120.0            -DE/DX =    0.0                 !
 ! A3    A(3,1,4)              120.0            -DE/DX =    0.0                 !
 ! D1    D(2,1,4,3)            180.0            -DE/DX =    0.0                 !
 --------------------------------------------------------------------------------
 GradGradGradGradGradGradGradGradGradGradGradGradGradGradGradGradGradGrad
Results
Optimised bond length: 2.651 Å
Optimised bond angle: 120.0°
Literature states that the Tl-Br bond length is 2.52 Å [1]. There is a 5% discrepancy between the literature value and the calculated value, which is not unreasonable.
BBr3 Optimisation
| Calculation Type | Optimisation |
|---|---|
| Calculation Method | DFT, B3LYP |
| Basis Set | Gen |
| Keywords | opt b3lyp/gen geom=connectivity pseudo=read gfinput |
Optimised BBr3
The optimisation file can be found at DOI:10042/21614
| File Type | .log |
|---|---|
| Calculation Type | FOPT |
| Calculation Method | RB3LYP |
| Basis Set | Gen |
| Charge | 0 |
| E(RB3LYP) | -64.43645296 a.u. |
| RMS Gradient Norm | 0.00000382 a.u. |
| Dipole Moment | 0.00 Debye |
| Point Group | D3h |
| Job cpu time | 36.2 s |
Item table:
 Item               Value     Threshold  Converged?
 Maximum Force            0.000008     0.000450     YES
 RMS     Force            0.000005     0.000300     YES
 Maximum Displacement     0.000036     0.001800     YES
 RMS     Displacement     0.000023     0.001200     YES
 Predicted change in Energy=-4.027671D-10
 Optimization completed.
    -- Stationary point found.
                           ----------------------------
                           !   Optimized Parameters   !
                           ! (Angstroms and Degrees)  !
 --------------------------                            --------------------------
 ! Name  Definition              Value          Derivative Info.                !
 --------------------------------------------------------------------------------
 ! R1    R(1,2)                  1.934          -DE/DX =    0.0                 !
 ! R2    R(1,3)                  1.934          -DE/DX =    0.0                 !
 ! R3    R(1,4)                  1.934          -DE/DX =    0.0                 !
 ! A1    A(2,1,3)              120.0            -DE/DX =    0.0                 !
 ! A2    A(2,1,4)              120.0            -DE/DX =    0.0                 !
 ! A3    A(3,1,4)              120.0            -DE/DX =    0.0                 !
 ! D1    D(2,1,4,3)            180.0            -DE/DX =    0.0                 !
 --------------------------------------------------------------------------------
 GradGradGradGradGradGradGradGradGradGradGradGradGradGradGradGradGradGrad
Results
Optimised bond length: 1.934 Å
Optimised bond angle: 120.0°
Comparison of Bond Lengths
Varying the ligand or central atom of a trigonal planar molecule has a marked effect on the central atom to ligand equilibrium bond length, as shown in the following table:
| BH3 | BBr3 | TlBr3 |
|---|---|---|
| 1.19 Å | 1.93 Å | 2.65 Å |
- What difference does changing the ligand have?
BBr3 has a longer central atom to ligand bond length than BH3. This can be explained as follows: Br is in row 4 of the periodic table and H is in row 1. Thus, Br has more filled electron shells and a larger atomic radius than H (van der Waals radii[2] of Br and H are 1.9 Å and 1.2 Å, respectively). This means that the B-Br bond will be longer than the B-H bond because the Br atom is intrinsically larger than the H atom. Also, Br has larger and more diffuse electron orbitals compared to H, meaning the B-Br overlap is less efficient than the B-H overlap, leading to a longer B-Br bond.
Another difference is that Br is more electronegative than H (Pauling electronegativities[3] are Χ(Br)= 2.74, X(H)=2.1, and X(B)=2.01). This leads to a more polar B-Br bond compared to the B-H bond.
The steric bulk of Br also causes repulsion between the Br atoms confined to a trigonal planar structure. A longer bond partially relieves this strain since it increases the distance between the Br atoms.
H and Br are similar in that they both exist as diatomic molecules in nature. This is because both H and Br can form covalent bonds to themselves in order to obtain a full outer electron shell. Despite this similarity, their difference in size and electronegativity alters the length and polarity of bonds that they form to other atoms, as explained above.
- What difference does changing the central element make?
TlBr3 has a longer central atom to ligand bond length than BBr3. Both Tl and Br are in group 3 of the periodic table, but Tl is in row 6 whereas B is in row 2. Thus, Tl is much larger than B and so the Tl-Br bond is intrinsically longer than the B-Br bond. Tl also has larger and more diffuse electron orbitals due to its size. This means the Tl-Br overlap is less efficient than the B-Br overlap, leading to a longer Tl-Br bond.
The Pauling electronegativities[4] are Χ(Br)= 2.74, X(B)=2.01, and X(Tl)=1.44. Thus the Tl-Br bond is more polar than the B-Br bond.
Finally, the oxidation state of Tl and B are both +3 in these trigonal planar complexes. However, larger group 3 elements tend to prefer the +1 oxidation state due to the inert pair effect. The fact that Tl adopts a +3 oxidation state shows that it is not in its 'preferred' oxidation state and that the TlBr3 molecule is relatively unstable.
Definition of a Bond
GaussView defines bonds based on a predefined value, so it will not draw a bond in if the distance between two atoms is greater than this value. For the 6-31G(d,p) optimised molecule for BH3, B-H bonds appeared between 1.41 Å and 1.23 Å. This indicates that the predefined value for the B-H bond distance lies in this range.
In general, a bond exists between two atoms when the interaction between them is favourable and leads to a lower energy overall. Whether or not an interaction is favourable can be determined by analysing the potential energy surface of the atoms. This is a graph of molecular energy against interatomic distance, and its shape is governed by the magnitude of the attraction/ repulsion between the nuclei/ electrons of the atoms. From this we can determine whether it is more favourable for the atoms to form a bond or for the atoms to exist as two separate entities.
Depending on the nature of the atoms, different types of bonding can be adopted. Ionic bonding occurs when an electron from atom A is transferred to atom B, giving A+ and B-. The electrostatic attraction between the two ions holds them together. Covalent bonds are observed when the electrons are shared between two atoms in order for both atoms to obtain a full octet in their electron shells.
Day 3
BH3 Frequency Analysis
A vibrational analysis was conducted on the 6-31G(d,p) optimised BH3 molecule.
| Calculation Type | Frequency |
|---|---|
| Calculation Method | DFT, B3LYP |
| Basis Set | 6-31G(d,p) |
| Keywords | opt=tight freq b3lyp/6-31g(d,p) geom=connectivity integral=grid=ultrafine symmetry=loose |
The frequency optimisation file is liked to here
| File Type | .log |
|---|---|
| Calculation Type | FREQ |
| Calculation Method | RB3LYP |
| Basis Set | 6-31G(d,p) |
| Charge | 0 |
| E(RB3LYP) | -26.61532364 a.u. |
| RMS Gradient Norm | 0.00000162 a.u. |
| Dipole Moment | 0.00 Debye |
| Point Group | D3h |
| Job cpu time | 5.0 s |
Low frequencies line:
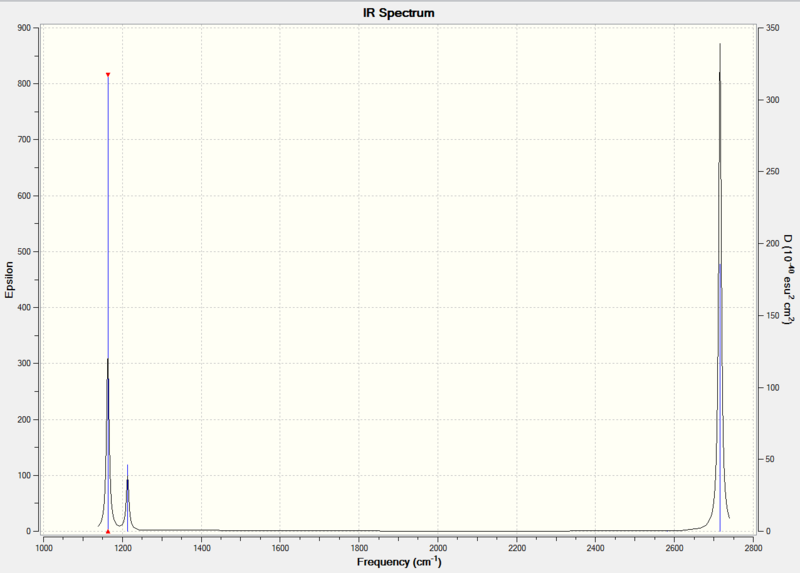
 Low frequencies ---   -7.0794   -7.0439   -0.0279    0.0007    0.7084    6.6303
 Low frequencies --- 1163.0023 1213.1577 1213.1579
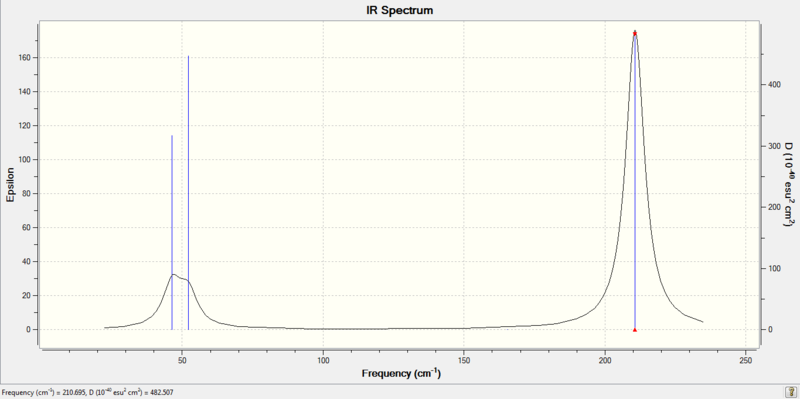
IR Spectrum:
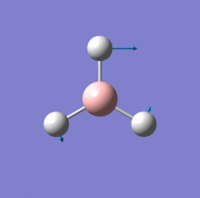
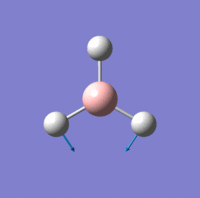
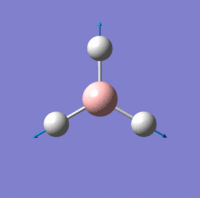
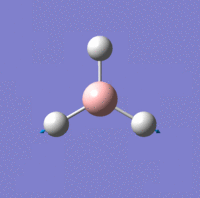
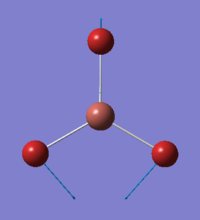
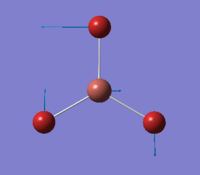
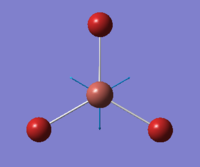
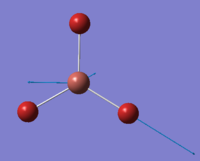
Nonlinear molecules have 3N-6 vibrational degrees of freedom, where N is the number of atoms. For BH3, there are N=4 atoms, thus, 6 vibrational modes are expected. These 6 modes are predicted correctly in the calculation, but not all of them show up on the IR spectrum. There are two sets of E' vibrational modes that have identical vibrational frequencies (at 1213cm-1 and 2716 cm-1). This means that the peaks overlap in the spectrum and appear as one peak. Also, the A'1 vibrational mode has an intensity of zero, thus it does not show up in the spectrum. This is because the B-H bonds vibrate in a concerted, symmetric fashion and there is no overall change in dipole moment of the molecule.
TlBr3 Frequency Analysis
A vibrational analysis was conducted on the LANL2DZ optimised TlBr3 molecule.
| Calculation Type | Frequency |
|---|---|
| Calculation Method | DFT, B3LYP |
| Basis Set | LANL2DZ |
| Keywords | freq b3lyp/lanl2dz geom=connectivity |
The frequency optimisation file can be found at DOI:10042/21687
| File Type | .log |
|---|---|
| Calculation Type | FREQ |
| Calculation Method | RB3LYP |
| Basis Set | LANL2DZ |
| Charge | 0 |
| E(RB3LYP) | -91.21812851 a.u. |
| RMS Gradient Norm | 0.00000088 a.u. |
| Dipole Moment | 0.00 Debye |
| Point Group | D3h |
| Job cpu time | 25.5 s |
Low frequencies line:
 Low frequencies ---   -3.4213   -0.0026   -0.0004    0.0015    3.9367    3.9367
 Low frequencies ---   46.4289   46.4292   52.1449
The lowest real normal mode is at 46 cm-1.
IR Spectrum:
| no. | BH3 frequency (cm-1) | TlBr3 frequency (cm-1) | |
|---|---|---|---|
| 1 | 1163 (A'2) | 46 (E') | |
| 2 | 1213 (E') | 46 (E') | |
| 3 | 1213 (E') | 52 (A'2) | |
| 4 | 2582 (A'1) | 165 (A'1) | |
| 5 | 2716 (E') | 211 (E') | |
| 6 | 2716 (E') | 211 (E') |
Comparison of BH3 vs TlBr3 vibrational frequencies
The BH3 vibrational frequencies are much higher than that of TlBr3, indicating that the BH3 vibrations are much faster and higher in energy. This makes sense because B and H are much lighter and smaller atoms than Tl and Br, hence they can vibrate faster at a higher energy. This also means that the B-H bond is much stronger and shorter than the Tl-Br bond length.
There has also been a reordering of vibrational modes in the three lowest frequencies (nos. 1-3). The E' vibrations are the lowest two modes in TlBr3, whereas in BH3 the lowest vibrational mode is A'2 followed by the E' modes. Despite this difference, the IR spectra for both molecules have 3 peaks, with the most intense peak occuring at the largest vibrational mode. The lowest two peaks (E' and A'2) in the TlBr3 spectrum have merged somewhat because they are within 10cm-1 of each other.
In both spectra there are two modes that are close in energy, the A'2 and E' modes, and two other modes that are higher in energy but still fairly close to each other, the A'1 and E' modes. This is due to the interaction between the electronic and nuclear vibrations of the molecule.
The importance of using the same basis set
It is crucial that the same basis set is used for both the optimisation and frequency analysis calculations. The basis set determines how many functions are linearly combined to describe the molecule's orbitals. Thus it is also a representation of how accurate the calculation is. If a different basis set were used it would not be possible to compare the results of the calculations.
Conducting a frequency analysis allows us to determine whether an optimisation was successful, i.e. it tells us whether the molecule has reached its minimum energy. We can also compute the frequencies, symmetry labels, and intensities of the 3N-6 vibrational modes of the molecule and produce an IR spectrum.
The low frequencies represent the motion of the centre of mass of the molecule (in this case B or Tl) and should be at least an order of magnitude smaller than the first vibration listed. The low frequencies are the '-6' part of the 3N-6 vibrational modes of the molecule, and are too small to be significant. Negative frequencies are ignored completely.
Molecular Orbitals of BH3
The molecular orbitals of the 6-31G(d,p) optimised BH3 were computed.
| Calculation Type | Population Analysis |
|---|---|
| Calculation Method | DFT, B3LYP |
| Basis Set | 6-31G(d,p) |
| Keywords | b3lyp/6-31g(d,p) pop=(nbo,full) geom=connectivity |
The optimisation file can be found at: DOI:10042/21694
| File Type | .log |
|---|---|
| Calculation Type | SP |
| Calculation Method | RB3LYP |
| Basis Set | 6-31G(d,p) |
| Charge | 0 |
| E(RB3LYP) | -26.61532252 a.u. |
| RMS Gradient Norm | |
| Dipole Moment | 0.00 Debye |
| Point Group | D3h |
| Job cpu time | 13.5 s |
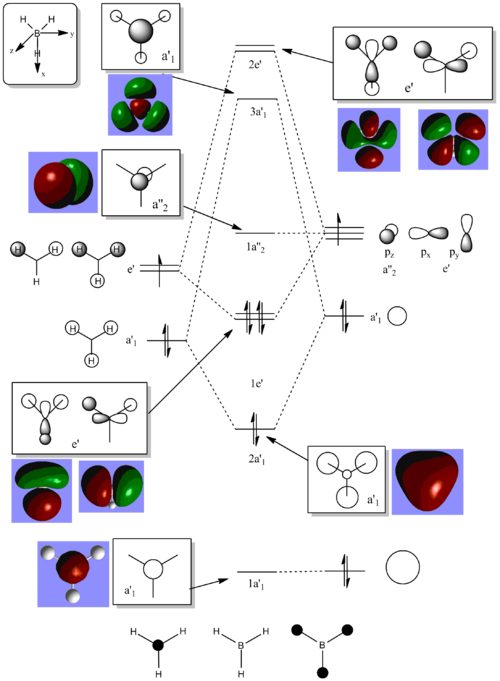
MO Diagram with calculated Orbitals shown:
The computed MOs are very similar to the LCAO MOs. This shows that qualitative MO theory provides an accurate description of the bonding taking place in molecules.
Day 4
Optimisation of NH3
NH3 was optimised using the 6-31G(d,p) basis set.
| Calculation Type | Optimisation |
|---|---|
| Calculation Method | DFT, B3LYP |
| Basis Set | 6-31G(d,p) |
| Keywords | opt b3lyp/6-31g(d,p) geom=connectivity nosymm |
The optimisation file is liked to here
| File Type | .log |
|---|---|
| Calculation Type | FOPT |
| Calculation Method | RB3LYP |
| Basis Set | 6-31G(d,p) |
| Charge | 0 |
| E(RB3LYP) | -56.55776856 a.u. |
| RMS Gradient Norm | 0.00000885 a.u. |
| Dipole Moment | 1.85 Debye |
| Point Group | C1 |
| Job cpu time | 10.0 s |
  Item               Value     Threshold  Converged?
 Maximum Force            0.000024     0.000450     YES
 RMS     Force            0.000012     0.000300     YES
 Maximum Displacement     0.000079     0.001800     YES
 RMS     Displacement     0.000053     0.001200     YES
 Predicted change in Energy=-1.629730D-09
 Optimization completed.
Frequency Analysis of NH3
A frequency analysis was conducted on the 6-31G(d,p) optimised molecule.
| Calculation Type | Frequency |
|---|---|
| Calculation Method | DFT, B3LYP |
| Basis Set | 6-31G(d,p) |
| Keywords | opt=tight freq b3lyp/6-31g(d,p) nosymm geom=connectivity integral=grid=ultrafine |
The frequency optimisation file is liked to here
| File Type | .log |
|---|---|
| Calculation Type | FREQ |
| Calculation Method | RB3LYP |
| Basis Set | 6-31G(d,p) |
| Charge | 0 |
| E(RB3LYP) | -56.55776872 a.u. |
| RMS Gradient Norm | 0.00000136 a.u. |
| Dipole Moment | 1.85 Debye |
| Point Group | C1 |
| Job cpu time | 11.0 s |
Low frequencies line:
Low frequencies ---   -9.3148   -8.1837   -6.2574   -0.0015   -0.0013   -0.0013
 Low frequencies --- 1089.3358 1693.9210 1693.9247
Population Analysis of NH3
The molecular orbitals of the 6-31G(d,p) optimised NH3 were computed.
| Calculation Type | Population Analysis |
|---|---|
| Calculation Method | DFT, B3LYP |
| Basis Set | 6-31G(d,p) |
| Keywords | b3lyp/6-31g(d,p) nosymm pop=(nbo,full) geom=connectivity |
The population analysis file can be found at DOI:10042/21708
| File Type | .log |
|---|---|
| Calculation Type | SP |
| Calculation Method | RB3LYP |
| Basis Set | 6-31G(d,p) |
| Charge | 0 |
| E(RB3LYP) | -56.55776856 a.u. |
| RMS Gradient Norm | |
| Dipole Moment | 1.85 Debye |
| Point Group | C1 |
| Job cpu time | 13.8 s |
NBO Analysis of NH3
A Natural Bond Orbital analysis was conducted on the optimised NH3 molecule.
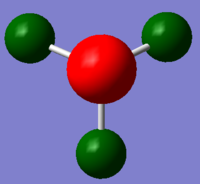
Charge distribution according to colour:
Colour Range: -1.125 to 1.125, with red being the most negatively charged and green the most positively charged.
Charge distribution according to number:
N:1.125, H:0.375
Optimisation of NH3BH3
NH3BH3 was optimised using the 6-31G(d,p) basis set.
| Calculation Type | Optimisation |
|---|---|
| Calculation Method | DFT, B3LYP |
| Basis Set | 6-31G(d,p) |
| Keywords | opt b3lyp/6-31g(d,p) geom=connectivity |
The optimisation file is liked to here
| File Type | .log |
|---|---|
| Calculation Type | FOPT |
| Calculation Method | RB3LYP |
| Basis Set | 6-31G(d,p) |
| Charge | 0 |
| E(RB3LYP) | -83.22468957 a.u. |
| RMS Gradient Norm | 0.00005842 a.u. |
| Dipole Moment | 5.57 Debye |
| Point Group | C1 |
| Job cpu time | 50.0 s |
 Item               Value     Threshold  Converged?
 Maximum Force            0.000124     0.000450     YES
 RMS     Force            0.000057     0.000300     YES
 Maximum Displacement     0.000660     0.001800     YES
 RMS     Displacement     0.000304     0.001200     YES
 Predicted change in Energy=-1.649838D-07
 Optimization completed.
    -- Stationary point found.
Frequency Analysis of NH3BH3
A frequency analysis was conducted on the 6-31G(d,p) optimised NH3BH3 molecule.
| Calculation Type | Frequency |
|---|---|
| Calculation Method | DFT, B3LYP |
| Basis Set | 6-31G(d,p) |
| Keywords | opt=tight freq b3lyp/6-31g(d,p) geom=connectivity integral=grid=ultrafine symmetry=loose |
The frequency optimisation file is liked to here
| File Type | .log |
|---|---|
| Calculation Type | FREQ |
| Calculation Method | RB3LYP |
| Basis Set | 6-31G(d,p) |
| Charge | 0 |
| E(RB3LYP) | -83.22468909 a.u. |
| RMS Gradient Norm | 0.00000125 a.u. |
| Dipole Moment | 5.57 Debye |
| Point Group | C3v |
| Job cpu time | 45.0 s |
Low frequencies line:
 Low frequencies ---   -5.5256   -0.3643   -0.0554    0.0009    0.9756    1.0843
 Low frequencies ---  263.2882  632.9538  638.4530
Association Energy of NH3BH3
- E(NH3)= -56.55776872 a.u.
- E(BH3)= -26.61532252 a.u.
- E(NH3BH3)= -83.22468909 a.u.
ΔE=E(NH3BH3)-[E(NH3)+E(BH3)]= -0.05159785 a.u. = -135.5 kJ mol-1
Week 2- Ionic Liquids, Designer Solvents Project
The second week of this lab consisted of a mini-project. The techniques used in the first week (optimisation, frequency analysis, population analysis, NBO analysis) were applied to more complex molecules.
Introduction
Ionic liquids are room temperature molten salts which consist of a large organic cation and an inorganic anion. Ionic liquids are currently gaining a lot of interest because of their non-volatile, non-flammable and environmentally friendly nature, and their potential application to heap leaching of copper and lubrication in cars [5][6]. In this project an optimisation, frequency analysis, population analysis, and natural bond orbital analysis is conducted for three "onium" cations: [N(CH3)4]+, [P(CH3)4]+, and [S(CH3)3]+. The bond distances, bond angles, geometry, and charge distribution of these cations are analysed using the obtained results. In part 2, the HOMO and LUMO of [N(CH3)4]+,[N(CH3)3(CH2OH)]+, and [N(CH3)3(CH2CN)]+ are compared, and the effect of the OH and CN groups on the molecular charge distribution is discussed.
[N(CH3)4]+
Optimisation
The optimisation file is liked to DOI:10042/21720
| File Type | .log |
|---|---|
| Calculation Type | FOPT |
| Calculation Method | RB3LYP |
| Basis Set | 6-31G(d,p) |
| Charge | 1 |
| E(RB3LYP) | -214.17488206 a.u. |
| RMS Gradient Norm | 0.00976156 a.u. |
| Dipole Moment | 0.04 Debye |
| Point Group | C1 |
| Job cpu time | 9 minutes 57.0 s |
 Item               Value     Threshold  Converged?
 Maximum Force            0.000094     0.000450     YES
 RMS     Force            0.000022     0.000300     YES
 Maximum Displacement     0.001245     0.001800     YES
 RMS     Displacement     0.000407     0.001200     YES
 Predicted change in Energy=-1.674770D-07
 Optimization completed.
    -- Stationary point found.
Frequency Analysis
The frequency optimisation file is liked to DOI:10042/21750
| File Type | .log |
|---|---|
| Calculation Type | FREQ |
| Calculation Method | RB3LYP |
| Basis Set | 6-31G(d,p) |
| Charge | 1 |
| E(RB3LYP) | -214.18127376 a.u. |
| RMS Gradient Norm | 0.00003854 a.u. |
| Dipole Moment | 0.0003 Debye |
| Point Group | C1 |
| Job cpu time | 10 minutes 8.5 s |
Low frequencies line:
 Low frequencies ---  -21.2298   -0.0006   -0.0005    0.0002   10.7001   18.1732
 Low frequencies ---  183.9688  286.8493  288.0155
Population Analysis
The population analysis file can be found at DOI:10042/21781
| File Type | .fch |
|---|---|
| Calculation Type | SP |
| Calculation Method | RB3LYP |
| Basis Set | 6-31G(d,p) |
| Charge | 1 |
| E(RB3LYP) | -214.18127382 a.u. |
| RMS Gradient Norm | 0.00000000 a.u. |
| Dipole Moment | 0.0003 Debye |
| Job cpu time | 1 minute 29.6 s |
Low frequencies line:
 Low frequencies ---   -3.4213   -0.0026   -0.0004    0.0015    3.9367    3.9367
 Low frequencies ---   46.4289   46.4292   52.1449
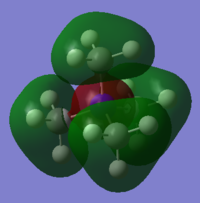
NBO analysis
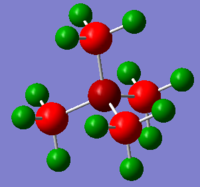
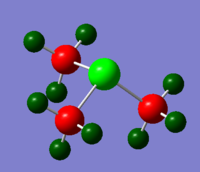
A Natural Bonding Orbital analysis was conducted on the optimised [N(CH3)4]+ cation:
Colour Range: -0.483 to 0.483, with red the most negative and green the most positive
N: -0.295, C: -0.483, H:0.269
[P(CH3)4]+
Optimisation
The optimisation file is linked to DOI:10042/21721
| File Type | .log |
|---|---|
| Calculation Type | FOPT |
| Calculation Method | RB3LYP |
| Basis Set | 6-31G(d,p) |
| Charge | 1 |
| E(RB3LYP) | -500.82699972 a.u. |
| RMS Gradient Norm | 0.00002960 a.u. |
| Dipole Moment | 0.0012 Debye |
| Point Group | C1 |
| Job cpu time | 16 minute 45.1 s |
 Item               Value     Threshold  Converged?
 Maximum Force            0.000053     0.000450     YES
 RMS     Force            0.000022     0.000300     YES
 Maximum Displacement     0.001010     0.001800     YES
 RMS     Displacement     0.000314     0.001200     YES
 Predicted change in Energy=-1.023340D-07
 Optimization completed.
    -- Stationary point found.
Frequency Analysis
The optimisation file is liked to DOI:10042/21758
| File Type | .log |
|---|---|
| Calculation Type | FREQ |
| Calculation Method | RB3LYP |
| Basis Set | 6-31G(d,p) |
| Charge | 1 |
| E(RB3LYP) | -500.82699998 a.u. |
| RMS Gradient Norm | 0.00002966 a.u. |
| Dipole Moment | 0.0012 Debye |
| Point Group | C1 |
| Job cpu time | 9 minutes 49.9 s |
Low frequencies line:
 Low frequencies ---  -16.0488  -13.8784   -6.9677   -0.0035   -0.0015   -0.0012
 Low frequencies ---  150.8222  185.2454  186.9885
Population Analysis
The population analysis file can be found at DOI:10042/21783
| File Type | .fch |
|---|---|
| Calculation Type | SP |
| Calculation Method | RB3LYP |
| Basis Set | 6-31G(d,p) |
| Charge | 1 |
| E(RB3LYP) | -500.82699972 a.u. |
| RMS Gradient Norm | 0.00000000 a.u. |
| Dipole Moment | 0.0011 Debye |
| Job cpu time | 1 minute 31.6 s |
NBO analysis
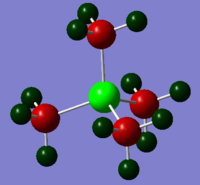
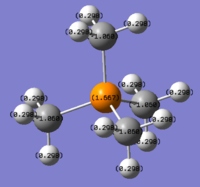
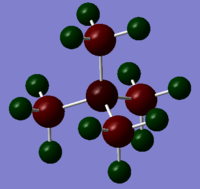
A Natural Bonding Orbital analysis was conducted on the optimised [P(CH3)4]+ cation:
Colour Range: -1.667 to 1.667, with red the most negative and green the most positive
P: 1.667, C: -1.060, H: 0.298
[S(CH3)3]+
Optimisation
The optimisation file is liked to DOI:10042/21760
| File Type | .log |
|---|---|
| Calculation Type | FOPT |
| Calculation Method | RB3LYP |
| Basis Set | 6-31G(d,p) |
| Charge | 1 |
| E(RB3LYP) | -517.68328619 a.u. |
| RMS Gradient Norm | 0.00009497 a.u. |
| Dipole Moment | 0.9632 Debye |
| Point Group | C1 |
| Job cpu time | 5 minutes 58.4 s |
  Item               Value     Threshold  Converged?
 Maximum Force            0.000174     0.000450     YES
 RMS     Force            0.000061     0.000300     YES
 Maximum Displacement     0.001646     0.001800     YES
 RMS     Displacement     0.000661     0.001200     YES
 Predicted change in Energy=-6.724330D-07
 Optimization completed.
    -- Stationary point found.
Frequency Analysis
The optimisation file is liked to DOI:10042/21764
| File Type | .log |
|---|---|
| Calculation Type | FREQ |
| Calculation Method | RB3LYP |
| Basis Set | 6-31G(d,p) |
| Charge | 1 |
| E(RB3LYP) | -517.68328628 a.u. |
| RMS Gradient Norm | 0.00009480 a.u. |
| Dipole Moment | 0.9632 Debye |
| Point Group | C1 |
| Job cpu time | 4 minutes 39.3 s |
Low frequencies line:
  Low frequencies ---  -19.4257   -0.0044   -0.0038   -0.0020   12.5380   32.8733
 Low frequencies ---  162.7647  193.9929  206.3457
Population Analysis
The population analysis file can be found at DOI:10042/21785
| File Type | .fch |
|---|---|
| Calculation Type | SP |
| Calculation Method | RB3LYP |
| Basis Set | 6-31G(d,p) |
| Charge | 1 |
| E(RB3LYP) | -517.68328618 a.u. |
| RMS Gradient Norm | 0.00000000 a.u. |
| Dipole Moment | 0.9632 Debye |
| Job cpu time | 58.9 s |
NBO analysis
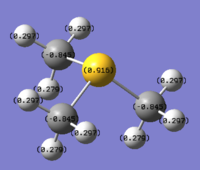
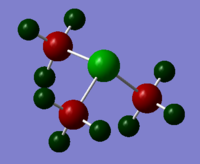
A Natural Bond Orbital analysis was conducted on the optimised [S(CH3)3]+:
Colour Range: -0.916 to 0.916, with red the most negative and green the most positive
S: 0.916, C: -0.845, H: 0.297
Analysis
| [N(CH3)4]+ | [P(CH3)4]+ | [S(CH3)3]+ | |
|---|---|---|---|
| X-C bond distance (Å) | 1.509 | 1.816 | 1.823 |
| C-X-C bond angle | 109.5° | 109.5° | 102.8° |
| Geometry of Central Atom | tetrahedral | tetrahedral | distorted tetrahedral |
The central atom to C bond distance is shortest for [N(CH3)4]+, whereas it is similar for [P(CH3)4]+ and [S(CH3)3]+. N is in row 2 of the periodic table, and P and S are next to each other in row 3. Since atomic radius decreases down a row, N has the smallest van der Waals radius, contributing to the shortest N-C bond. The N-C orbital overlap is also very efficient due to the similar size of N and C. Thus the nitrogen based cation has the shortest central atom to carbon bond length.
The S-C bond is slightly longer than the P-C bond. This can be rationalised by comparing the C-X-C bond angles and the overall structure of the molecules. The C-S-C bond angle is less than that of a perfect tetrahedron. Thus, one of the vertices of the tetrahedron must be occupied by a lone pair. The lone pair occupies a large amount of space, and so pushes the methyl groups closer together. Since the methyl groups repel each other, it is favourable for the S-C bond length to increase so that the distance between the methyl groups also increases. Thus the S-C bond is slightly longer than the P-C bond.
The Pauling electronegativites[7] of the three central atoms are X(N)=3.07, X(P)=2.06, and X(S)=2.44. The charge localised on each atom follows the trend in electronegativity. The most electronegative N atom has a -0.295 charge localised on it. As P and S are not as electron withdrawing, they have positive charges localised on them. P is more electropositive than S or N so P carries the highest positive charge.
The C atoms in the P based cation are the most negatively charged. This is because the P atom is so electropositive that it pushes electron density onto its C neighbours. On the other hand, the C atoms in the N based cation are the least negatively charged. This is because the N atom is so electron-withdrawing that it pulls the electron density away from its C neighbours. The charge on the methyl H atoms is similar for the P and S complexes, and less positive for the N complex. Because the N atom pulls electrons away from the methyl carbons, the methyl carbons have a δ+ charge. Thus it makes sense that the terminal H atoms have a δ- charge.
Relative Contribution of X and C atoms to X-C bond
- N-C bond
4. (1.98452) BD ( 1) C   1 - N  17
                ( 33.65%)   0.5801* C   1 s( 20.77%)p 3.81( 79.06%)d 0.01(  0.16%)
                                            0.0003  0.4551 -0.0237  0.0026  0.2134
                                            0.0091  0.4733  0.0201 -0.7209 -0.0306
                                            0.0090 -0.0137 -0.0304 -0.0079  0.0198
                ( 66.35%)   0.8146* N  17 s( 25.00%)p 3.00( 74.97%)d 0.00(  0.03%)
                                            0.0000  0.5000 -0.0007  0.0000 -0.2079
                                            0.0000 -0.4611  0.0001  0.7027 -0.0001
                                            0.0039 -0.0060 -0.0133 -0.0035  0.0087
The N atom contributes to 66% of the bond. It has 25% s character and 75% p character (sp3 hybridised). C only contributes to 34% of the bond.
- P-C bond
 4. (1.98030) BD ( 1) C   1 - P  17
                ( 59.57%)   0.7718* C   1 s( 25.25%)p 2.96( 74.67%)d 0.00(  0.08%)
                                           -0.0002 -0.5022 -0.0171  0.0020 -0.1331
                                            0.0025  0.6951 -0.0127 -0.4955  0.0091
                                            0.0062 -0.0045  0.0232  0.0157  0.0002
                ( 40.43%)   0.6358* P  17 s( 25.00%)p 2.97( 74.15%)d 0.03(  0.85%)
                                            0.0000 -0.0001 -0.5000  0.0008  0.0000
                                            0.0000  0.1328 -0.0002  0.0000 -0.6925
                                            0.0010  0.0000  0.4943 -0.0007  0.0198
                                           -0.0142  0.0738  0.0498  0.0005
The P atom contributes to 40% of the bond. It has 25% s character and 75% p character (sp3 hybridised). C contributes to 60% of the bond.
- S-C bond
 4. (1.98632) BD ( 1) C   1 - S  13
                ( 48.66%)   0.6976* C   1 s( 19.69%)p 4.07( 80.18%)d 0.01(  0.14%)
                                            0.0003  0.4435  0.0141 -0.0033  0.5642
                                           -0.0044  0.5928 -0.0046 -0.3631 -0.0097
                                            0.0265 -0.0166 -0.0174 -0.0013 -0.0096
                ( 51.34%)   0.7165* S  13 s( 16.96%)p 4.86( 82.41%)d 0.04(  0.63%)
                                            0.0000  0.0001  0.4117 -0.0076  0.0012
                                            0.0000 -0.5595  0.0246  0.0000 -0.5882
                                            0.0259  0.0000  0.4039  0.0259  0.0494
                                           -0.0427 -0.0449 -0.0024 -0.0051
The S atom contributes to 51% of the bond. It has 17% s character and 83% p character. C contributes to 49% of the bond.
- Results
N has the highest percentage contribution to the heteroatom-carbon bond. This shows that N can donate the most electrons to the X-C bond, and that N has the highest electron density. This is because N is the more electronegative than P and S, and so it is able to "collect" the most electrons. The S atom is the next best contributor to the X-C bond, which also follows the electronegativity trend. The S-C bond is also the most covalent X-C bond because the charge contributions are essentially 50% for both S and C. Finally, the P atom is the most electropositive and only contributes to 40% of the P-C bond. This analysis is consistent with the charge distribution analysis.
[NR4]+ charge distribution
Traditionally, [NR4]+ where R= alkyl is represented with the positive charge on the nitrogen atom. According to the analysis above, the N atom is the most negatively charged atom in the molecule. In the traditional picture, the represented positive charge is in fact a "formal charge", which is defined as the number of electrons an atom would have if the electron pairs were shared equally. The problem is, the electron pairs are not actually shared equally within the molecule, as seen from the percentage contribution analysis. Thus in reality the positive charge is distributed equally between the H atoms on the methyl groups.
[N(CH3)3(CH2OH)]+
Optimisation
The optimisation file is linked to DOI:10042/21881
| File Type | .log |
|---|---|
| Calculation Type | FOPT |
| Calculation Method | RB3LYP |
| Basis Set | 6-31G(d,p) |
| Charge | 1 |
| E(RB3LYP) | -289.39320048 a.u. |
| RMS Gradient Norm | 0.00002477 a.u. |
| Dipole Moment | 1.5787 Debye |
| Point Group | C1 |
| Job cpu time | 14 minutes 26.5 seconds |
 Item               Value     Threshold  Converged?
 Maximum Force            0.000077     0.000450     YES
 RMS     Force            0.000014     0.000300     YES
 Maximum Displacement     0.001283     0.001800     YES
 RMS     Displacement     0.000357     0.001200     YES
 Predicted change in Energy=-5.996079D-08
 Optimization completed.
    -- Stationary point found.
Frequency Analysis
The optimisation file is liked to DOI:10042/21882
| File Type | .log |
|---|---|
| Calculation Type | FOPT |
| Calculation Method | RB3LYP |
| Basis Set | 6-31G(d,p) |
| Charge | 1 |
| E(RB3LYP) | -289.39320048 a.u. |
| RMS Gradient Norm | 0.00002479 a.u. |
| Dipole Moment | 1.5787 Debye |
| Point Group | C1 |
| Job cpu time | 13 minutes 8.7 seconds |
Low frequencies line:
 Low frequencies --- -108.8576  -22.4759  -13.4795   -7.9400   -0.0015   -0.0013
 Low frequencies ---   -0.0009  120.6590  209.8808
Population Analysis
The population analysis file can be found at DOI:10042/21889
| File Type | .log |
|---|---|
| Calculation Type | SP |
| Calculation Method | RB3LYP |
| Basis Set | 6-31G(d,p) |
| Charge | 1 |
| E(RB3LYP) | -289.39320048 a.u. |
| RMS Gradient Norm | |
| Dipole Moment | 1.5787 Debye |
| Point Group | C1 |
| Job cpu time | 1 minutes 56.9 seconds |
NBO analysis
A Natural Bond Orbital analysis was conducted on the cation:
Colour Range: -0.756 to 0.756, with red the most negative and green the most positive
[N(CH3)3(CH2CN)]+
Optimisation
The optimisation file is linked to DOI:10042/21884
| File Type | .log |
|---|---|
| Calculation Type | FOPT |
| Calculation Method | RB3LYP |
| Basis Set | 6-31G(d,p) |
| Charge | 1 |
| E(RB3LYP) | -306.39377057 a.u. |
| RMS Gradient Norm | 0.00001004 a.u. |
| Dipole Moment | 5.7638 Debye |
| Point Group | C1 |
| Job cpu time | 16 minutes 36.8 seconds |
  Item               Value     Threshold  Converged?
 Maximum Force            0.000032     0.000450     YES
 RMS     Force            0.000007     0.000300     YES
 Maximum Displacement     0.001094     0.001800     YES
 RMS     Displacement     0.000255     0.001200     YES
 Predicted change in Energy=-1.639371D-08
 Optimization completed.
    -- Stationary point found.
Frequency Analysis
The optimisation file is liked to DOI:10042/21885
| File Type | .log |
|---|---|
| Calculation Type | FOPT |
| Calculation Method | RB3LYP |
| Basis Set | 6-31G(d,p) |
| Charge | 1 |
| E(RB3LYP) | -306.39377057 a.u. |
| RMS Gradient Norm | 0.00001003 a.u. |
| Dipole Moment | 5.7638 Debye |
| Point Group | C1 |
| Job cpu time | 15 minutes 15.0 seconds |
Low frequencies line:
 Low frequencies ---   -7.0676   -0.0009   -0.0007   -0.0005    6.4278   17.4180
 Low frequencies ---   92.0060  154.5708  212.7618
Population Analysis
The population analysis file can be found at DOI:10042/21888
| File Type | .log |
|---|---|
| Calculation Type | SP |
| Calculation Method | RB3LYP |
| Basis Set | 6-31G(d,p) |
| Charge | 1 |
| E(RB3LYP) | -306.39377057 a.u. |
| RMS Gradient Norm | |
| Dipole Moment | 5.7639 Debye |
| Point Group | C1 |
| Job cpu time | 2 minutes 32.3 seconds |
NBO analysis
A Natural Bond Orbital analysis was conducted on the cation:
Colour Range: -0.489 to 0.489, with red the most negative and green the most positive
Analysis Part 2
| [N(CH3)3(CH2OH)]+ | [N(CH3)3(CH2CN)]+ | |
|---|---|---|
| NBO charge on N | N: -0.313 | N: -0.289 |
| NBO Charges represented by colour
(Scaled so that the colour range is -0.756 to 0.756) |
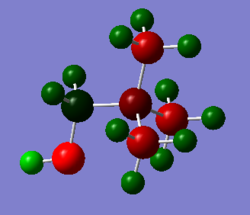
|
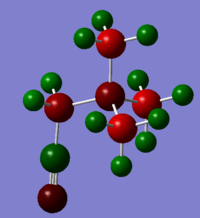
|
Because OH is electron donating it can push electron density onto the central N atom. Thus the N atom in [N(CH3)3CH2OH]+ has a more negative charge than that of [N(CH3)3CH2CN]+. The CN group is electron withdrawing so it competes for electron density, making the central N atom less negative.
| [N(CH3)4]+ | [N(CH3)3(CH2OH)]+ | [N(CH3)3(CH2CN)]+ | |
|---|---|---|---|
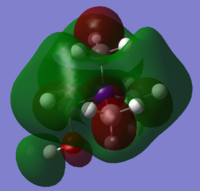
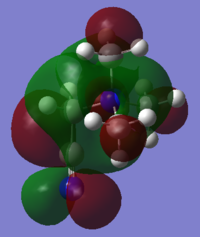
| LUMO | 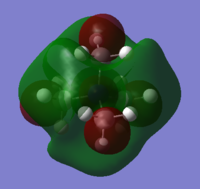
|
|
|
| LUMO Energy (a.u.) | -0.13303 | -0.11993 | -0.18184 |
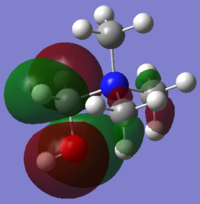
| HOMO | 
|
 |
|
| HOMO Energy (a.u.) | -0.57930 | -0.46626 | -0.50048 |
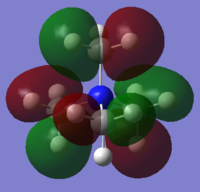
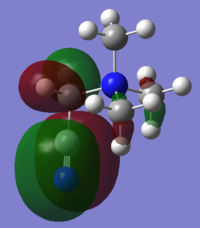
The cation with the OH functional group has the highest HOMO energy, whereas the [NMe4]+ molecule has the lowest HOMO energy. The OH molecule HOMO consists of four large lobes of alternating phase, which are distributed equally about the O-H bond. This leads to strong through space antibonding interactions which override the very weak through space bonding interactions between the oppositely coloured lobes. Thus, the OH HOMO is higher in energy than the [N(CH3)4]+ HOMO, in which the MOs are more delocalised throughout the molecule and hence lower in energy.
The OH has the most antibonding and highest energy LUMO. The central N atom has an opposite phase to the surrounding methyl groups. In addition, there are strong through-space antibonding interactions between the methyl groups which raises the LUMO energy significantly. The [N(CH3)3(CH2CN)]+ LUMO is the least antibonding because it has the fewest nodes.
As for the shape of the MOs, the HOMOs of the molecules with the OH and CN functional groups have a high electron density about the O-H and C-N bonds. This pulls most of the electron density away from the rest of the molecule so it is likely that the functional groups are more reactive than the central atom. The LUMO MO shapes are similar for all three complexes. The central atom carries electron density of the opposite phase to its immediate surroundings. Strong antibonding interactions exist between the methyl groups.
In general the energy of the orbitals increased with the introduction of functional groups. This is because of the electron-withdrawing/ electron-donating ability of the OH and CN groups. Their electronegative character leads to the MOs being highly localised about the functional groups, so the MOs cannot be spread over the entire molecule. Hence the energy of the HOMO/ LUMO goes up.
The HOMO-LUMO gap decreases with the introduction of functional groups to the molecule. This makes the molecule more reactive because it is easier to excite an electron from the HOMO to the LUMO. It is likely that the reactivity will take place at the functional groups because the HOMOs are localised the O-H and C-N bonds.
References
- ↑ Blixt J. et. al., J. Am. Chem. Soc., 1995, 117, 5089-5104
- ↑ Batsanov S. S., Inorganic Materials, 2001, 37, 871-885
- ↑ Little J., Jones M., Journal of Chemical Education, 1960, 37, 231-233
- ↑ Little J., Jones M., Journal of Chemical Education, 1960, 37, 231-233
- ↑ T. Dong, Y. Hua, Q. Zhang, D. Zhou, Hydrometallurgy, 2009, 99, 33-38.
- ↑ Jimenez, A.E., Bermudez, M.D., Tribology Letters, 2007, 26, 1, 53-60
- ↑ Little J., Jones M., Journal of Chemical Education, 1960, 37, 231-233

