Rep:Mod:MAP107 Module 2
Introduction:
This module will look into how the computer programme gaussien can be used to model inorganic molecules. Through the use of gaussien the geometries of molecules can be optimised and hence there energies, The MO's can be predicted as can the charge distributions.
Note: all calculations and figures are rounded to the following parapmeters: intensities are rounded to the nearest whole integer, bond distances are accurate to ≈ 0.01 Å, bond angles are accurate to ≈ 0.1°and the relative energies of molecules are compared.
Modelling BH3 and BCl3 using Gaussien:
Optimising BH3:
The first molecule to be modelled is BH3. The first task is to optimise the molecules geometry and energy. The molecule was modelled in gaussview. This is an interface with gaussien. The molecule was initially modelled with bond lengths of 1.5A and, bond angles of 120 degrees.
The molecule was then optimised using gaussien. This genterated a gaussien input file with the following coding:
 %chk=D:\Computational Chemistry Lab\Module 2\MichaelP_bh3_opt.chk
 # opt b3lyp/3-21g geom=connectivity
This file was submitted to the super computer to run the geometry optimization calculation. The b31yp refers to the method and the 3-21g refers to the basis set.
When the calculation was complete the relevant .log file was opened using gaussview. The molecule is shown below.

After the optimisation the the bond length chnged to 1.19A. The bond angle remained as 120 degrees.
A summary of the results as well as a log file were also generated.

https://www.ch.imperial.ac.uk/wiki/images/d/d0/Michael_Parkes_BH3_OPTIMISATION.LOG

Each point on the graph represents one point in the optimisation. the optimisation stops when the gradient reaches 0.01. this a paramenter used to produce relativly accurate results in a reasonable amount of time.
Molecular orbitals of BH3:
The MO's of BH3 can be modelled using gaussien and gaus view. It is important to use the geometry optimised BH3 molecule when modelling the MO's of this molecule. the input was sent to the super computer with the following input:
  %chk=D:\Computational Chemistry Lab\Module 2\MichaelP_bh3_opt.chk
  # b3lyp/3-21g pop=(nbo,full) geom=connectivity
The method is the b3lyp method and the basis set used was the 3-21g the nbo stands for Natural Bond Orbital. This looks at the charge ditribution within the moleculae and at the MO's to see how they interact.
The output file is shown below:
A literature MO diagram for BH3 is shown below. It can be seen how these predicted LCAO MO's compare to The MO's created in Gaussview.
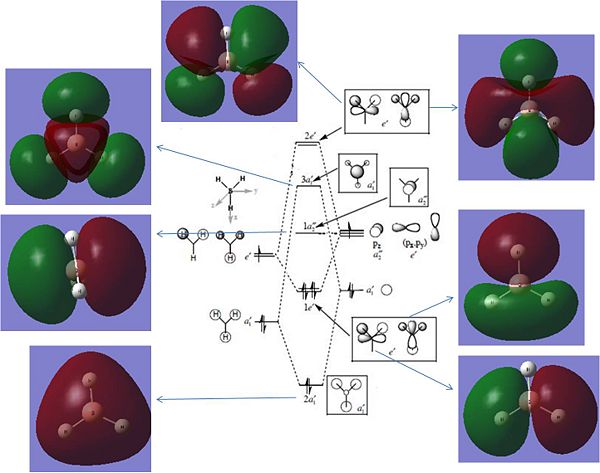
Reference:http://www.ch.ic.ac.uk/hunt/teaching/teaching_MOs_year2/L3_Tut_MO_diagram_BH3.pdf
The LCAO predicted MO's and the Gaussien MO's compare well for all bonding and and non bonding orbitals. These are orbitals 2 through to 5, where 5 is an empty p orbital. At orbital 6 there is an anomily. The LCAO predicted 3a'1 is predicted to have a different energy to both 2e' orbitals. Gaussien has predicted one of the 2e' to have a comparible energy to the 3a'1. These are orbitals 6 and 7 and are shown below:

This is odd, as orbital number 7 has only 2 nodes in the MO in comparison to orbital number 6 which has 4 nodes. Thus one would expect orbital 6 to be much higher in enegy.
From this it can be concluded that the LCAO and Gaussien predicted MO's compare well for bonding and non bonding orbitals however the comparrison breaks down for anti bonding orbitals. This is a reflection of the limitations of LCAO theory.
NBO analysis of BH3:
As mentioned previously the NBO calculation looks at the charge densities on each atom within a molecule. This can be predicted on Gaussien and graphically modelled on gauss view. To obtain more information from the NBO calculation the log file needs to be opened.
log file: https://www.ch.imperial.ac.uk/wiki/images/2/27/BH3_NBO_data.txt
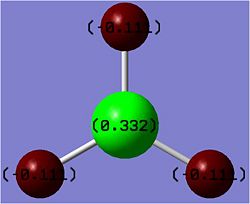
Note: the values in the image have been rounded to 3 significant figures.
After opening the log file more data on the molecule could be determined. The molecule is neutrally charged, however the boron has a positive charge of 0.33coulombs (C) and the 3 hydrogens each have a charge of -0.11C. The sum of these equals 0. The fact that the 3 hydrogens have the same charge demonstrates the D3h symmetry of the molecule.
Summary of Neutral Population Analysis:
                                      Natural Population
               Natural  -----------------------------------------------
   Atom  No    Charge         Core      Valence    Rydberg      Total
-----------------------------------------------------------------------
     B    1    0.33161      1.99903     2.66936    0.00000     4.66839
     H    2   -0.11054      0.00000     1.11021    0.00032     1.11054
     H    3   -0.11054      0.00000     1.11021    0.00032     1.11054
     H    4   -0.11054      0.00000     1.11021    0.00032     1.11054
=======================================================================
  * Total *    0.00000      1.99903     6.00000    0.00097     8.00000
The NBO data can also tell us information about the orbital contributions. This is shown below:
Orbital Contributions:
   (Occupancy)   Bond orbital/ Coefficients/ Hybrids
---------------------------------------------------------------------------------
    1. (1.99853) BD ( 1) B   1 - H   2
               ( 44.48%)   0.6669* B   1 s( 33.33%)p 2.00( 66.67%)
                                           0.0000  0.5774  0.0000  0.0000  0.0000
                                           0.8165  0.0000  0.0000  0.0000
               ( 55.52%)   0.7451* H   2 s(100.00%)
                                           1.0000  0.0000
    2. (1.99853) BD ( 1) B   1 - H   3
               ( 44.48%)   0.6669* B   1 s( 33.33%)p 2.00( 66.67%)
                                           0.0000  0.5774  0.0000  0.7071  0.0000
                                          -0.4082  0.0000  0.0000  0.0000
               ( 55.52%)   0.7451* H   3 s(100.00%)
                                           1.0000  0.0000
    3. (1.99853) BD ( 1) B   1 - H   4
               ( 44.48%)   0.6669* B   1 s( 33.33%)p 2.00( 66.67%)
                                           0.0000  0.5774  0.0000 -0.7071  0.0000
                                          -0.4082  0.0000  0.0000  0.0000
               ( 55.52%)   0.7451* H   4 s(100.00%)
                                           1.0000  0.0000
    4. (1.99903) CR ( 1) B   1           s(100.00%)
                                           1.0000  0.0000  0.0000  0.0000  0.0000
                                           0.0000  0.0000  0.0000  0.0000
From this data, the contributions of the different atomic orbitals make to the bonding can be seen. It can be determined that the boron is hybridised into three sp2 hybrid orbitals, and this is shown by the 33.33%contribution from the s orbital and the 66.67% contribution from the p orbitals. I.e. a 2:1 ratio leading to three atomic orbitals that make three molecular orbitals.
Second Order Pertibation Theory:
Second Order Perturbation Theory Analysis of Fock Matrix in NBO Basis:
    Threshold for printing:   0.50 kcal/mol
                                                                             E(2)  E(j)-E(i) F(i,j)
        Donor NBO (i)                     Acceptor NBO (j)                 kcal/mol   a.u.    a.u.
===================================================================================================
within unit  1
  4. CR (   1) B   1                / 10. RY*(   1) H   2                    1.51    7.54    0.095
  4. CR (   1) B   1                / 11. RY*(   1) H   3                    1.51    7.54    0.095
  4. CR (   1) B   1                / 12. RY*(   1) H   4                    1.51    7.54    0.095
This section shows the mixing of MO's such as the mixing between the boron p orbital and the BH3 anti bonds, however it does not show much mixing for BH3.
Natural Bond orbitals Summary:
This section of data shows how NBO can be used to convert delocalised MO's back into 2 electron bonds and lone pairs.
Natural Bond Orbitals (Summary):
                                                           Principal Delocalizations
          NBO                        Occupancy    Energy   (geminal,vicinal,remote)
====================================================================================
Molecular unit  1  (H3B)
    1. BD (   1) B   1 - H   2          1.99853    -0.43712
    2. BD (   1) B   1 - H   3          1.99853    -0.43712
    3. BD (   1) B   1 - H   4          1.99853    -0.43712
    4. CR (   1) B   1                  1.99903    -6.64476  10(v),11(v),12(v)
    5. LP*(   1) B   1                  0.00000     0.67666
    6. RY*(   1) B   1                  0.00000     0.37177
    7. RY*(   2) B   1                  0.00000     0.37177
    8. RY*(   3) B   1                  0.00000    -0.04532
    9. RY*(   4) B   1                  0.00000     0.43446
   10. RY*(   1) H   2                  0.00032     0.90016
   11. RY*(   1) H   3                  0.00032     0.90016
   12. RY*(   1) H   4                  0.00032     0.90016
   13. BD*(   1) B   1 - H   2          0.00147     0.41201
   14. BD*(   1) B   1 - H   3          0.00147     0.41201
   15. BD*(   1) B   1 - H   4          0.00147     0.41201
      -------------------------------
             Total Lewis    7.99463  ( 99.9329%)
       Valence non-Lewis    0.00441  (  0.0551%)
       Rydberg non-Lewis    0.00097  (  0.0121%)
      -------------------------------
           Total unit  1    8.00000  (100.0000%)
          Charge unit  1    0.00000
This is shown by the first 4 entries in the data. These entries represent the atomic orbitals the bonds come from and hence represent MO's. observe how the three B-H bonds have an occupancy of 1.99853. This roughly equals 2 and hence 2 electrons. The boron lone pair sits at the core and is shown by the fith entry. This has an occupancy of 1.9903, also roughly equal to 2. The first 4 molecular orbitals are all negative in energy, with the lone pair being the lowest in energy. This bonds all stabalise the molecule. Interestingly the 8th orbital is also negative. All the other orbitals are postive in energy, meaning if electron density is put into them then it would destabalise the molecule.
Vibrational Frequencies:
The first step in calculating the vibrational frequencies is to perform the calculations on the correct geometry optimised molecule. Below is a picture of the summary for the molecule which had the frequencies calculated on it. This is comparable to the summary of the geometry optimised molecule. Both summaries have been shown to have the same energy. Hence the geometry optimization calculation was correct.

The calculation was run on the geometry optimised molecule with the following input:
 %chk=D:\Computational Chemistry Lab\Module 2\MichaelP_bh3_opt.chk
 # freq b3lyp/3-21g geom=connectivity pop=(full,nbo)
where b31yp was the method and 3-21g is the basis set.
Output file: https://www.ch.imperial.ac.uk/wiki/images/d/d6/MICHAEL_PARKES_BH3_FREQUENCY.LOG
The output file was evaluated and the low frequencies analysed:
Low frequencies ---  -66.7625  -66.3592  -66.3589   -0.0020    0.0031    0.2123
Low frequencies --- 1144.1483 1203.6413 1203.6424
Diagonal vibrational polarizability:
       0.6013547       0.6012848       1.9090953
Harmonic frequencies (cm**-1), IR intensities (KM/Mole), Raman scattering
activities (A**4/AMU), depolarization ratios for plane and unpolarized
incident light, reduced masses (AMU), force constants (mDyne/A),
and normal coordinates:
                    1                      2                      3
                   A"                     E'                     E'
Frequencies --  1144.1483              1203.6413              1203.6424
Red. masses --     1.2531                 1.1085                 1.1085
Frc consts  --     0.9665                 0.9462                 0.9462
IR Inten    --    92.8665                12.3148                12.3173
 Atom  AN      X      Y      Z        X      Y      Z        X      Y      Z
    1   5     0.00   0.00   0.16     0.00   0.10   0.00    -0.10   0.00   0.00
    2   1     0.00   0.00  -0.57     0.00   0.08   0.00     0.81   0.00   0.00
    3   1     0.00   0.00  -0.57    -0.38  -0.59   0.00     0.14   0.38   0.00
    4   1     0.00   0.00  -0.57     0.38  -0.59   0.00     0.14  -0.38   0.00
                    4                      5                      6
The low frequencies refer to the motions of the centre of mass of the molecule. These frequencies should be much lower than the vibrational frequencies. The largest low frequency is 0.2123. The first vibrational frequency is 1144.1483. the low frequency is much smaller than this. This implies the results are ok. The better the method employed to calculate the vibrational frequencies, the closer the 6 low frequencies should be to 0. The fact that the 6 frequencies are not that close to 0 implies we have used a low method in calculating these frequencies.
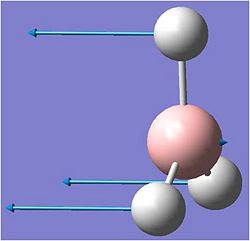
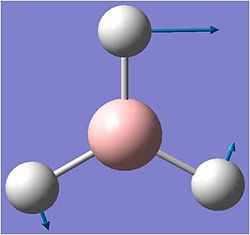
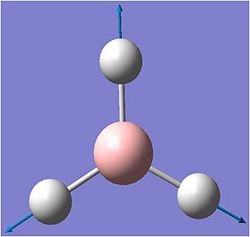
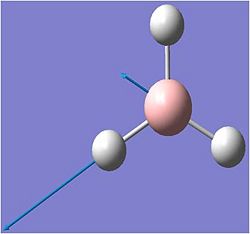
The vibrations were animated on gausview.. the results are shown below:
Predicted IR Spectra:
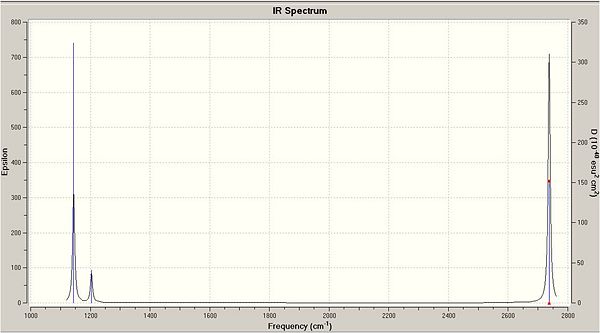
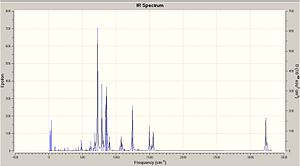
In the IR only 3 peaks can be seen despite there being 6 vibrations. This is due to certian Vibrations having the same frequencies I.e. No.'s 2 and 3 and 5 and 6. These will overlap on the IR spectra and appear as one peak. This is due to the symmetry of the stretches. Peak number 4 also has an intensity of 0 and will hence not be seen on the IR spectra.
Optimising BCl3:
BCl3 was modelled in gaussview. The geometry was optimised using the same method used for BH3. For this exercise the point group of the molecule had to be fixed to D3h. The tolerance on this was also changed to 0.0001. THe coding, molecule and summary are shown below:
 %chk=D:\Computational Chemistry Lab\Module 2\MichaelP_bcl33_opt.chk
 # opt b3lyp/lanl2mb geom=connectivity
The method used was the b3lyp method and the basis set was the lan12mb.


Output file:https://www.ch.imperial.ac.uk/wiki/images/7/78/BCL3_OPTIMISATION.LOG
The B-Cl bond length was measured as 1.87A. The bond angle remained as 120 degrees.
Vibrational Analysis:
Vibrational Analysis of the molecule was run to confirm that the geometry optimisation had been successful and that the correct geometry had been produced. The frequency analysis effectivly is the sevond dervative of the energy surface of the molecule. By taking the first derivative of the energy surface, equating it to zero and solving, we can determine the points at which the maxima and minima occur in the second derivative. Plugging these values into the sevond derivative will explain the nature of the maxima and the minima. if the value is positive we have a minima. If the value is negative then we have a maxima.
This means that the vibrational analysis can be used to determine the minimum energy and hence be used to confirm the geometry optimisation is correct.
The vibrational analysis was run with the following input:
 %chk=D:\Computational Chemistry Lab\Module 2\MichaelP_bcl33_opt.chk
 # freq b3lyp/lanl2mb geom=connectivity pop=(full,nbo)
Where b3lyp was the method used and lan12mb was the basis set used.
The results summary is shown below:
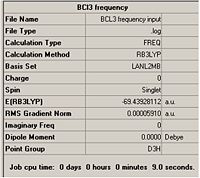
Output file: https://www.ch.imperial.ac.uk/wiki/images/2/2e/BCL3_frequency_output.txt
It can be seen from the reults table that the Energies of the geometry optimised molecule and the molecule that has had the vibrational analysis on it are identical to 4 decimal places. This means that the geometry optimised molecule was optimised correctly and has an energy that agrees with the Vibratioanl analysis.
Note, that the same basis set and method were used in both the geometry optimisation and the vibrational anlysis. It is important to do this as the basis set used effects how accurate the energy surface/potential curve is. Thus it is important to use the same basis set as to get comparable results. i.e. If a different basis set is used in the vibrational analysis then the total energy of the molecule may be more or less accurate and not comparable to the geometry optimised molecule.
A literature bond length for the B-Cl bond is 1.75A. This is less than the Gaussien predicted bond length, and this is due to the inaccurate basis set used. A more accurate basis set would lead to a better prediction of the bond length.
References:
Greenwood, Norman N.; Earnshaw, A. (1997), Chemistry of the Elements (2nd ed.), Oxford: Butterworth-Heinemann
M. Atoji and W. N. Lipscomb – B-Cl Distance in Boron Trichloride - J. Chem. Phys. 27, 195 (1957)
Sometimes Gaussien does not draw a Bond between two atoms. This is because the distance between the atoms is deemed too large to have a formal chemical bond drawn between them. This is only due to the preset distance parameter being set to low, and does not mean that gaussien fails to take into account the interactions between the atoms. The parameter is set low as it expects organic molecules with C-C bonds to be modelled. C-C bonds are often shorter than many bonds found in inorganic chemistry and, hence the programme does not draw the bonds in. The distance parameter can be changed to account for larger bonds.
Chemical bonding has been described in many ways. Chemical bonding refers to the interaction between two atoms. When atomic structure was first being investigated, it was believed that a chemical bond was due to 2 electrons occupying the space between 2 atoms. This is partially true, and gave rise to Valence Shell Electron Pair Repulsion Theory, or VSEPR for short. This produce relativly good results for good molecules however failed when hyper valency was discovered.
Developments in quantum mechanics led to the formation of the Linear Combination of Atomic Orbitals theory. This came about through the discovery of wave particle duality and observing the probability of find an electron at a given distance from the nucleus of an atom while it occupies a certian energy state. These electron distributions led to the discovery of atomic orbitals, which are a mathematical way of modelling the wave like behavour of an electron. These orbitals take on 5 different shapes depending on 4 quantum numbers that result from solving the Shrodinger equation. Hence Chemical bonding was described as being the constructive overlap of two wavefunctions/atomic orbitals. This leads to a new molecular orbital. By modelling this and the electrons within the molecular orbital chemical bonding could be explained.
The most accurate way of Describing chemical bonding is to describe a chemical bond as being the probability of finding electron density between two atoms. The greater the electron density the stronger the bond, the lower the electron density the weaker the bond. hence this has given rise to the Density Functional Theory.
The ground state point group is D3h. This can be expected by examining the symetry elements of the molecule: C3, 3C2, 1 sigma h perpendicular to the main rotational axis, and 3 sigma v's .Gaussview also uses this symetry. This symmetry is used in the optimal geometry calculation because it restricts it to a certian geometry meaning the Energy surface is restricted to a paticular region meaning the energy minima and maxima are found faster.
The geometry optimisation took 6 seconds
The vibrational analysis took 9 seconds
Cis and Trans Mo(CO)4L2
This exercise will look into modelling and predicting the vibrational frquencies of the carbonyl stretches in a the cis and trans isomers of a Molybdenum complex with the above chemical equation.
The exercise will model similar molecules to the ones synthesised in a second year lab experiment, where L=PPh3. PPh3 is a very large group and will take a long time to model, so for this task the Ph groups will be replaced with chlorines. The electronic behaviour of chlorine is simillar to Ph, so this is an appropriate approximation.
The first step is to draw the moleculles in Gaussview. Once this has been done a basic geometry optimisation will be performed to get rough estimates for the bond lengths and geometry of the molecule. The geometry shall then be manually edited and have a more complex geometry optimisation performed on it.
The accuracy of the optimisation can be determined through the basis set used. The better the basis set the better the optimisation.
the following method was used on both molecules fo the initial optimisation:
# opt=loose b3lyp/lanl2mb geom=connectivity
where b3lyp was the method and lan12mb was the basis set used. note the more accurate lan12mb basis set was used. this is more accurate than the 3-21g basis set. note that a loose optermisaion was performed i.e. opt=loose.
both molecules were submitted to the scan super computer. The log files are published below:
Trans:DOI:10042/to-3022
Cis:DOI:10042/to-3023
Time taken for Trans: 1 min 46 secs
Time taken for Cis: 4 min 52 secs
The log files were opened to confirm the following
      Item               Value     Threshold  Converged?
Maximum Force            0.002347     0.002500     YES
RMS     Force            0.000654     0.001667     YES
Maximum Displacement     0.009742     0.010000     YES
RMS     Displacement     0.003583     0.006667     YES
As both files possesed this the optimisations were succesful.
The molecules were opened and the following structures and properties were recorded:
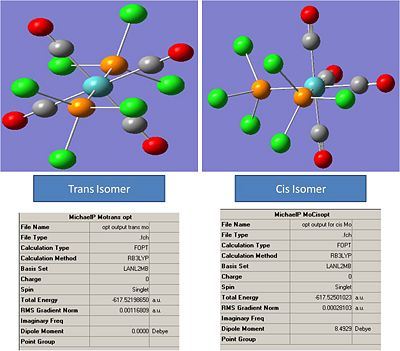
The Mo-C bond lengths were recorded as:
Trans: 2.11A
Cis: 2.06A
The P-Cl bond lengths were recorded as:
Trans: 2.4A
Cis: 2.39A
These geometries were then manually changed to produce the structures shown below:

The moleculres were then re sent to the SCAN super computer with the following input:
# opt rb3lyp/lanl2dz geom=connectivity int=ultrafine scf=conver=9
where b3lyp is the method and lan12dz is the basis set. The lan12dz basis set is more accurate than the lan12mb and hence will produce a better optimisation.
this produced two output files:
Trans:DOI:10042/to-3029
Cis:DOI:10042/to-3030
Again the output files were opened to confirm that they had converged and, indeed they had. The molecules were then opened in gaussview. This is shown below:

Comparing the Complex Geometries:
It can be seen from the images and results summary above that the molecules now adopt the desired geometry. The bond lengths generated were:
trans:
Mo-C = 2.06A
Mo-P = 2.24A
P-Mo-P = 177.4 degrees
C-Mo-C = 89.5, 89.5, 90.5, 90.5 degrees
Cis:
Mo-C = 2.012A, 2.059A
Mo-P = 2.24A
P-Mo-P = 94.146 degrees
C-Mo-C = 89.06, 89.69, 87.08, 89.07 degrees
In comparison to the first optimisation the bond lengths are shorter, hence showing the geometry optimisation was better.
Literature Bond lengths and angles for L = PPH3:
Trans:
Mo-C = 2.01A
Mo-P = 2.5A
P-Mo-P = 180 degrees
C-Mo-C = 87.2, 92, 92.1 degrees
Cis:
Mo-C = 1.972, 1.973, 2.059, 2.022
Mo-P = 2.576A, 2.577A
P-Mo-P = 104.62 degrees
C-Mo-C = 91.3, 87.0 90.1 degrees
The literature values compare well for the calculated values for the Mo-C bond lenghts and Mo-C bond angles (however thaere are small differences). The literature results do not compare well for the M0-P bonds and the angle between the phosphurus atoms in the cis complex. This is likely due to the fact that the literature gives bond lengths for the PPh3 ligand not the PCl3 ligand, and in the models an approximation was made.
The literature value for the P-Mo-P angle in the cis isomer is much larger than the predicted. This implies a large deviations from the optimum octahedral structure. This is due to the large bulky PPh3 ligands which due to sterics will cause this deviation. The PCl3 group is smaller and hence does not cause cause this deviation and is hence not observed in the predicted geometry.
In the literature Mo-PPh3 bond is longer than the Mo-PCl3 bond, and this could be due to sterics and the fact that the PPh3 ligand is very large and bulky. Furthermore, the D orbitals on the phosphurus were not taken into account in the optimisation. Taking these into account could well alter the length of the bonds.
References: http://pubs.acs.org/doi/pdf/10.1021/ic00131a055 , http://pubs.acs.org/doi/pdf/10.1021/ic00134a075 , http://www.sciencedirect.com/science?_ob=ArticleURL&_udi=B6TG5-3S9DKVH-V&_user=217827&_rdoc=1&_fmt=&_orig=search&_sort=d&_docanchor=&view=c&_acct=C000011279&_version=1&_urlVersion=0&_userid=217827&md5=b17d462536220bf19fdbb1c116308443
Vibrational Analysis:
The vibrational analysis of these complexes were run in order to determine the lowest enegy isomer and the carbonyl stretches. It is important to use the same basis set and method used in the optimisation when calculating the vibrational frequencies. Hence the files were submitted to the SCAN super computer with the following inputs:
 %chk=D:\Computational Chemistry Lab\Module 2\Mo trans isomer\Vibrations input attempt 2.chk
 # freq rb3lyp/lanl2dz geom=connectivity int=ultrafine scf=conver=9
This produced two output files,
Trans: DOI:10042/to-3209
Cis: DOI:10042/to-3210
It is important when calculating the vibrational frequencies that the 6 low frequencies are very close to zero and positive. If there are some negative frequencies, it is ok providd they are not greater than -5cm-1. To confirm the vibrational calculations had worked the log files were opened and the low frequencies examined.
Trans:
 Low frequencies ---   -2.1968   -1.5697   -0.0002   -0.0001    0.0003    3.2529
Low frequencies ---    5.1428    6.1986   37.2108
Diagonal vibrational polarizability:
     150.5642640      57.4507817     156.5271216
Harmonic frequencies (cm**-1), IR intensities (KM/Mole), Raman scattering
activities (A**4/AMU), depolarization ratios for plane and unpolarized
incident light, reduced masses (AMU), force constants (mDyne/A),
and normal coordinates:
                    1                      2                      3
                    A                      A                      A
Frequencies --     4.9741                 6.1107                37.2108
Red. masses --    21.7858                34.6922                27.0469
Frc consts  --     0.0003                 0.0008                 0.0221
IR Inten    --     0.0942                 0.0000                 0.4188
Cis:
 Low frequencies ---   -1.8056   -0.0003   -0.0003    0.0002    0.9974    1.8605
Low frequencies ---   10.2534   18.1599   42.2555
Diagonal vibrational polarizability:
     101.0703074      70.3704337      53.5155994
Harmonic frequencies (cm**-1), IR intensities (KM/Mole), Raman scattering
activities (A**4/AMU), depolarization ratios for plane and unpolarized
incident light, reduced masses (AMU), force constants (mDyne/A),
and normal coordinates:
                    1                      2                      3
                    A                      A                      A
Frequencies --    10.2168                18.1598                42.2555
Red. masses --    29.7514                32.3489                19.1033
Frc consts  --     0.0018                 0.0063                 0.0201
IR Inten    --     0.0268                 0.0102                 0.0023
It can be seen that the low frequencies are greater than -5 and very close to 0. Furthermore all vibrational frequencies in the cis and trans isomers are positive. This means that the geometries are found in and energy surface minimum. Thus it can be concluded that the calculation work successfully.
From the output files the IR spectra can be predicted. These are shown below:
IR Analysis:
Trans:

Cis:

The main functional groups to analyse in these molecules are the carbonyl stretches. The predicted carbonyl streches are shown below
Trans:
| Frequency/cm-1 | Intensity | Bond |
|---|---|---|
| 1950 | 1475 | two trans C=O bonds |
| 1951 | 1466 | other two trans C=O bonds |
| 1977 | 0.66 | all 4 asymmetric |
| 2031 | 3.8 | all 4 symmetric |
Cis:
| Frequency/cm-1 | Intensity | Bond |
|---|---|---|
| 1945 | 764 | C=O asymetric |
| 1948 | 1497.9 | C=O symetric |
| 1958 | 633 | C=O asymetric |
| 2023 | 597 | C=O symetric |
The trans isomer has 4 streches however only one stretch is seen on the IR. This is due to the low intensities of two of the stretches and the fact that two of the streches have roughly the same frequency. The presence of only one peak is predicted by the symmetry of the molecule.
The cis isomer has 4 unique stretches which can all be identified on the IR.
Literature values for these streches are shown below. these are taken from Michael Parkes's 2nd year 5s lab report on the Identification of steriochemical (geometrical) isomers of [Mo(CO)4(L)2] by infared spectroscopy.
| Cis/Frequency/cm-1 | Trans/Frequencies |
|---|---|
| 1888.05 with shoulders | 1888.87 |
| 1971.09 | n/a |
| 2013.11 | n/a |
It can be seen that the predicted results loosely relate to the experimental results. the predicted Cis frequencies equate better with the experimental frequencies than the predicted trans.
In general the frequencies are higher than the experimental frequencies. This can be explained through the approximations in the calculations made. Thes include using the PCl3 ligand instead of using the PPh3 ligand. Also the d orbitals on the phosphorus have not been taken into account in the geometry optimisation, prehaps by improving the optimisation would lead to better predictions.
Low Frequencies
As mentioned previously 6 low frequencies are obseerved. it is important hat these are close to 0. The numerical values for these were shown above. These low frequencies refer to the -6 in the vibrations = 3n-6 equation. These vibrations refer to the motion of the nuclei and not the bonds and come from equations made in the matrix. These vibrations can not be modelled graphically.
There were no negative bond frequencies observed in the Cis and Trans isomers. This is a good sign as it shows that the optimisations on the molecules worked succesfully. This is due to the fact that in classical physics frequency is derived from the force constant K. In Hooke's law this is known as the spring constant. The second derivative of the potential curve will provide K as Potential = 0.5KX^2. Natural frequency is directly proportional to this. If K is positive it means that we are in the minima of a poterntial surface. if it is negative it means we are in a maxima.
the lowest frequencies observed were
Trans:4.9Hz and 6.7Hz

Cis: 10.2Hz
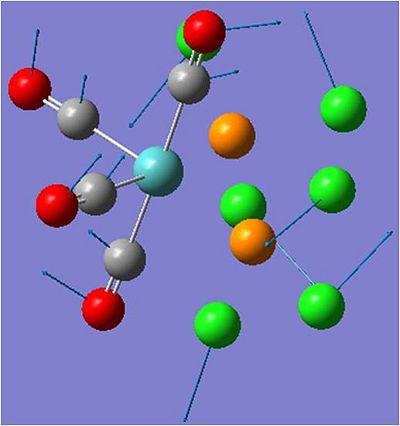
These are likely to be low level thermal vibrations and at room temperature will be vibrating very rapidly.
Relative Energies
The relative energies of the two isomers are shown below:
Trans Isomer:
| Energy/a.u. | Energy/kj/mol-1 |
|---|---|
| -623.576 | -1643.461 |
Cis Isomer:
| Energy/a.u. | Energy/kj/mol-1 |
|---|---|
| -623.577 | -1643.463 |
The Cis isomer is fractionally lower in energy (2 jmol-1) this is nearly insignificant in comparison the the 1000's of kilojoules.
The reason that the cis product is fractionally lower in energy than the trans isomer is the increased back bonding between the C-O pi* orbital and the D orbital on the metal. The reason that this back bonding is increased in the cis isomer is due to the reduced symmetry and hence there is less competition for back bonding from one single d orbital.
If the PR3 group was made more electron donating this could furter stabalise the two complexes and inparticular the cis isomer. This would increase the backbonding in the molecule and help stabalise it. This could be achieved through replacing the chlorine's with methyl groups or OMe or some group like this. The cis isomer could also be made more stable by decreasing the size of the L ligands hence decreasing the steric demands.
Mini Project:
Introduction:
This project will look into modeling the 4T polythiophene (T =thiophene). Polythiophenes are becoming increasingly more useful in the field of organic electronics, due to their high charge mobilities and abilities to act as P-type semi consuctors. They are also chemically stable. However large polythiophenes exhibit a number of properties such as low-crystallinity and chemical defects that make it difficult to determine vibrations and electronic properties. Thus small perfectly formed thiophenes have become increasingly more useful.
This Project will model the the 4T polythiophene where 4 represents the number of thiophene rings bonded together. Through the use of Gaussian, the optimum geometry for this molecule will be determined. This will be achieved through modelling a number of different isomers and determining the most stable one. Once the most stable isomer has been determined, the Vibrations of this molecule will be calculated and compared to literature. Fianally the electronic properties of the molecule will be investigated. The MO's will be modelled and the differences in energy between them recorded. Provided there is enough time a time dependent DFT will be run, in order to produce a predicted UV-Vis spectrum which should reveal the electronic transitions and the energies at which they occur. This will be compared to the MO band gaps to see how they compare.
Molecules to be modelled:
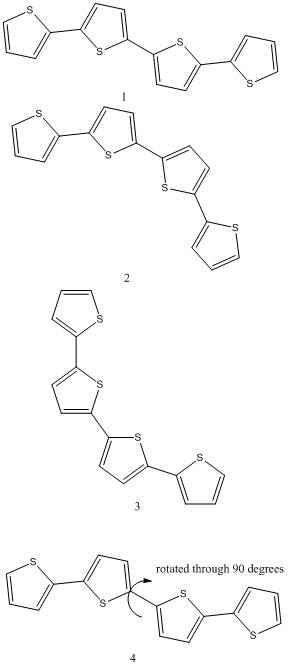
The molecules shown above shall have there geometries optimised, the isomer with the lowest energy shall then have further calculations run on it.
Molecule 4 is being run as an experiment to see if it has a minimum energy associated with this geometry. This can be determined by geometry optimising it with the dihedral angle between the carbon and the sulphur being fixed, and by running it withou the dihedral angle being fixed. If the result of the optimisation returns in a planar geometry it means there is no minimum energy associated with this geometry, and visa verca. It is important to note that this molecule will not cunduct electricity in this geometry as it needs to be planar.
Models: Optimised Geometries
Structure 1:
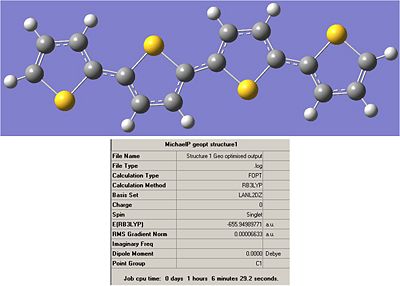
Output File:
        Item               Value     Threshold  Converged?
Maximum Force            0.000186     0.000450     YES
RMS     Force            0.000033     0.000300     YES
Maximum Displacement     0.000554     0.001800     YES
RMS     Displacement     0.000155     0.001200     YES
Structure 2:
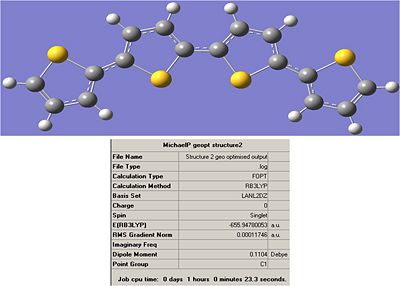
Output File:
        Item               Value     Threshold  Converged?
Maximum Force            0.000373     0.000450     YES
RMS     Force            0.000058     0.000300     YES
Maximum Displacement     0.001283     0.001800     YES
RMS     Displacement     0.000343     0.001200     YES
Structure 3:

        Item               Value     Threshold  Converged?
Maximum Force            0.000202     0.000450     YES
RMS     Force            0.000027     0.000300     YES
Maximum Displacement     0.000358     0.001800     YES
RMS     Displacement     0.000068     0.001200     YES
Structure 4:

        Item               Value     Threshold  Converged?
Maximum Force            0.000041     0.000450     YES
RMS     Force            0.000007     0.000300     YES
Maximum Displacement     0.000771     0.001800     YES
RMS     Displacement     0.000179     0.001200     YES
Structure 4 (Fixed Dihedral):

        Item               Value     Threshold  Converged?
Maximum Force            0.000032     0.000450     YES
RMS     Force            0.000006     0.000300     YES
Maximum Displacement     0.001053     0.001800     YES
RMS     Displacement     0.000320     0.001200     YES
Analysis of models:
The molecules were initially drawn in ChemBio3D and had an MM2 molecular force field method applied to it. The RMS gradient was set to 0.001 hence meaning the optimisation would be reasonably accurate. This was done to produce an initial optermisation.
The molecules were then opened in gaussview and submitted to the SCAN super computer to have the final optermisation run on them. The molecules were submitted with the following input:
# opt b3lyp/lanl2dz geom=connectivity int=ultrafine scf=conver=9
The method used was the b3lyp method, and the basis set used was the lanl2dz which is an accurate basis set and should produce a relativly accurate geometry optimisation.
once the optermisations were complete the molecules were opened in gaussview and the output files were checked to see if they had all converged. the answer as shown above was yes.
It was found that molecule 4 had indeed adopted the structure of molecule 1 once it had been optimised. This initially implies that there is no minimum energy associate with this geometry and could imply that this structure is a transition state. To confirm this the dihedral angle was fixed and the molecule resubmitted. This produced the molecule shown above.
The energies of the molecules were compared to see which molecule has been optimised to the lowest energy.
Structure 1:
Isomer 1 |
Structure 1:
Structure 4(fixed Dihedral):
Isomer 1 |
Structure 4(fixed Dihedral):
Energies:
| Molecule | Energy/a.u. | Energy/Kj/mol |
|---|---|---|
| 1 | -655.949898 | -1722.196 |
| 2 | -655.947800 | -1722.190 |
| 3 | -655.943249 | -1722.1789 |
| 4(dihedral fixed) | -655.94291 | -1722.178 |
It can be seen from the results that structure 1 is the most stable. This structure is 6kj/mol more stable than structure 2 and is 18 Kj/mol more stable than structure 4 with the fixed dihedral angle. This is not a huge amount relative to 1000's of kj/mol however it does show that this is the most stable structure. This can be eplained through the fact that the hydrogens on the thiophene rings interact less when the rings alternate. This is seen by the way structures 2 and 3 are bent and not linear.
Vibrational Analysis will be carried out on the structures to confirm that structure 1 is the preferred structure. This can be confirmed by seeing if all the stretching frequencies are positive or not. if some vibrations are negative it will imply the structure is more unstable.
Structure 4 (fixed dihedral) is believed to be a transition state. If it is, it is expected it will have a fairly large negative stretching frequency (between -15 and -50). This can be expected as a transition state is normally found at the maximum of the potential surface.
The stretching frequencies are derived from the energy surface of a molecule. In classical mechanics the potential of the simple harmonic oscillator can be modelled as potential = 0.5KX2 where k is the spring constant and x is the change in displacement. The second derivative with respect to displacement of the energy surface will hence be the spring constant. As natural frequency is directly proportional to the spring constant, the frequencies are derived from this. If the frequencies are negative then the spring constant must also be negative and hence be found at the maxima of a potential surface and thus not be the most stable structure.
If structure 4 is indeed a transition state then we would expect the sping constant to be negative and hence the frequency to be negative. If the negative frequency we are expecting is large and the difference in energy between this structure and the energy of structure 1 is also large (18J/mol) then it can tell us about the nature of the potential surface of the molecule. If these two quantities are large then we can determine that the potential surface is sharpe and steep. if they are both small then the potential surface must be relativly flat and shallow.
Vibrational analysis
Vibrational analysis was run on the molecules mentioned above. The data from the log files containining the relevant data are shown below with IR spectra:
Structure 1:
  Low frequencies ---   -1.2487   -0.0007    0.0005    0.0008    2.6331    4.0653
   Low frequencies ---   16.5245   20.3621   25.1747
   Diagonal vibrational polarizability:
       8.4738620       4.4824914     111.0072534
Harmonic frequencies (cm**-1), IR intensities (KM/Mole), Raman scattering
activities (A**4/AMU), depolarization ratios for plane and unpolarized
incident light, reduced masses (AMU), force constants (mDyne/A),
and normal coordinates:
                    1                      2                      3
                    A                      A                      A
Frequencies --    16.5245                20.3621                25.1726
Red. masses --     6.4163                 6.6608                 5.8911
Frc consts  --     0.0010                 0.0016                 0.0022
IR Inten    --     0.3702                 0.0126                 0.0000

Comments:
It can be seen from the output file that all the frequencies are poritive. this means that this molecule is found at a minimum of the potential curve and the sping constant is positive. The IR predicted IR shows several intense peaks and these show be compared to literature.
Structure 2:
Low frequencies ---   -7.4577   -0.0014   -0.0005    0.0009    1.7805    1.8722
Low frequencies ---    8.4888   18.7939   22.6383
******    1 imaginary frequencies (negative Signs) ******
Diagonal vibrational polarizability:
      10.1307661       3.4757776     106.9067045
Harmonic frequencies (cm**-1), IR intensities (KM/Mole), Raman scattering
activities (A**4/AMU), depolarization ratios for plane and unpolarized
incident light, reduced masses (AMU), force constants (mDyne/A),
and normal coordinates:
                    1                      2                      3
                    A                      A                      A
Frequencies --    -7.3194                18.7892                22.6378
Red. masses --     5.8957                 8.7181                 6.0006
Frc consts  --     0.0002                 0.0018                 0.0018
IR Inten    --     0.0000                 0.3490                 0.0000
        Item               Value     Threshold  Converged?
Maximum Force            0.000338     0.000450     YES
RMS     Force            0.000117     0.000300     YES
Maximum Displacement     0.001298     0.001800     YES
RMS     Displacement     0.000472     0.001200     YES

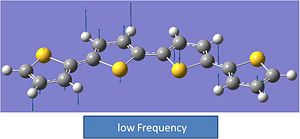
Comment:
Structure 2 shows one negative vibrational frequency. This is always a little strange however the value does fall within the experimental errors. More analysis was done to determine if the analysis had worked. All itmes converged, so it was decided to model the vibration. This was found to be a rocking motion of the two sulphurs that are adjacent in and out of the plane of the molecule. This could imply that the sulphur atoms do not like being adjacent to each other. This molecule is less stable than molecule 1.
Structure 3:
Low frequencies ---  -26.1605  -20.4448   -6.0730   -0.0024   -0.0009    0.0004
Low frequencies ---    0.3823    1.2958    1.5886
******    3 imaginary frequencies (negative Signs) ******
Diagonal vibrational polarizability:
      77.2391163       6.9358154       6.6819836
Harmonic frequencies (cm**-1), IR intensities (KM/Mole), Raman scattering
activities (A**4/AMU), depolarization ratios for plane and unpolarized
incident light, reduced masses (AMU), force constants (mDyne/A),
and normal coordinates:
                    1                      2                      3
                   A"                     A'                     A"
Frequencies --   -26.1599               -20.4437                -6.0528
Red. masses --     5.9032                 5.7975                 6.5662
Frc consts  --     0.0024                 0.0014                 0.0001
IR Inten    --     0.0000                 0.0254                 0.0000
        Item               Value     Threshold  Converged?
Maximum Force            0.000221     0.000450     YES
RMS     Force            0.000055     0.000300     YES
Maximum Displacement     0.001391     0.001800     YES
RMS     Displacement     0.000401     0.001200     YES

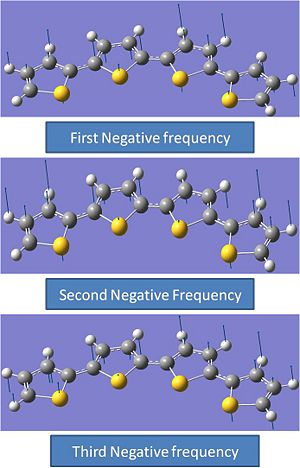
Comments:
Structure 3 shows 3 negative frequencies. This could initially imply that the calculation could have failed. However it was found that all items had converged and infact were an order of magnitude lower than the limit they were set to converge to. This is interesting. Hence the vibrations were graphically modelled on gaussview. These are shown above. Interestingly it can be seen that the motion of these three vibrations are a rocking motion in and out of the plane of the molecule. This follows the same trend that was observed in molecule 2. this implies that the sulphurs do not like being in this plane and adjacent to each other and hence are easily bent out of it. From this we could conclude that structures that have sulphurs adjacent and in the same plane are all unfavourable geometries however more molecules would need to be modelled to prove this.
This is definatly an unvfavourable structure and is much less stable than isomer 1. Sulphur is quite a soft atom and hence has a shallow potential curve so sometimes the minimum is hard to find.
Structure 4:
Low frequencies ---  -45.2485   -0.9717   -0.0004   -0.0001    0.0006    0.6000
Low frequencies ---    4.2748   14.8455   16.4910
******    1 imaginary frequencies (negative Signs) ******
Diagonal vibrational polarizability:
       8.8703941      91.8825542      72.7674657
Harmonic frequencies (cm**-1), IR intensities (KM/Mole), Raman scattering
activities (A**4/AMU), depolarization ratios for plane and unpolarized
incident light, reduced masses (AMU), force constants (mDyne/A),
and normal coordinates:
                    1                      2                      3
                    A                      A                      A
Frequencies --   -45.2484                14.8454                16.4790
Red. masses --     5.9669                 7.0804                 7.3353
Frc consts  --     0.0072                 0.0009                 0.0012
IR Inten    --     0.6655                 0.3729                 0.3284
       Item               Value     Threshold  Converged?
Maximum Force            0.000032     0.000450     YES
RMS     Force            0.000006     0.000300     YES
Maximum Displacement     0.000917     0.001800     YES
RMS     Displacement     0.000302     0.001200     YES

Comments:
As predicted, Molecule 4 has a large negative frequency (-45.2484Hz). This was initially suggested by the large low frequency which was predicted and observed. This was graphically modelled and indeed showed the rotation around the C-C bond which has the poly thiopene groups antiperiplanar to eachother. This is shown above. This evidence confirms the belief that this is a transition structure which is observed at the top of a potential surface
Analysis of Vibrations:
The vibrational analysis confirms that structure 1 is the most stable structure as all frequencies observed were positive and the low frequencies were all close to 0Hz. Structure 2 was the second most stable as this had only 1 negative frequency. This was followed by structure 3 which had 3 negative frequencies.
Initially it was believed that the calculations run on structures 2 and 3 had failed to work. However analysis of the output files showed that they had indeed worked. Through graphically modelling the vibrations a trend was observed. This trend suggested that when sulphurs are adjacent to eachother and in the same plane they are easily bent out of plane thus destabalising the molecule. The more sulphurs that are adjacent and in the same plane the more destabalised the molecule becomes, as more and more negative frequencies appear. More molecules need to be modelled in order to confirm this, however this could be useful in predicting the stabilities of polythiophen rings.
As predicted, Structure 4 (fixed Dihedral) has a single large negative frequency. Modelling this freqency also showed that this frequency showed the rotation abot the C-C bond where the thiophene rings are antiperiplanar to eachother. This implies that this Ffrequency occurs at the maximum of a potential surface, and hence is a transition state. This piece of information combined with the difference in energies between structure 1 and structure 4 (18J/mol) tell us some infomation about the potential curve. as the negative frequency is very large we can conclude that the rate of change of the surface at this point is large. The energy difference is not very large so the surface is probably quite flat but with a sharpe peak in it.
Structure 1 Comparison to Literature:
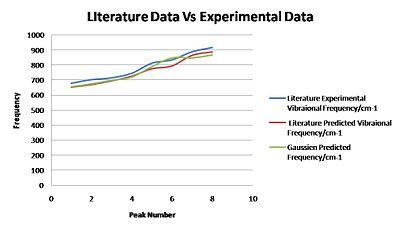
| Literature Experimental Vibraional Frequency/cm-1 | Literature Predicted Vibraional Frequency/cm-1 | Gaussien Predicted Frequency/cm-1 | Intensity | Symmetry frequency/cm-1 |
|---|---|---|---|---|
| 639 | 630 | N/A | N/A | Bg |
| 680 | 654 | 656 | 0.45 | Ag |
| 704 | 671 | 675 | 0 | Au |
| 716 | 696 | 699 | 7.16 | Bu |
| 746 | 727 | 720 | 215 | Ag |
| 813 | 776 | 789 | 85.8 | Au |
| 835 | 795 | 846.8 | 147.6 | Ag |
| 875 | N/A | N/A | N/A | N/A |
| 889 | 865 | 847 | 34 | Bg |
| 917 | 888 | 866 | 35 | Ag |
The Gaussien predicted frequencies compare well to the literature predicted frequencies for low frequencies however start to deviate at higher frequencies. This shows that the literature used a similar but more accurate method to predict the stretching frequencies.
both computated frequencies deviate away from experimentally observed vibrational frequencies. this is likely due to the fact that the computer programme predicts the frequencies in the gas phase however experimentally these were probably determined in the liquid or gas phase.
Molecular Orbitals:
Through vibrational analysis Structure 1 has been shown to be the most stable. As this molecule is a semi conductor it is important to investigate the molecular orbitals. If this molecule is indeed a semi conductor then it would be expected that it has a lot of low energy un occupied orbitals.
For this part of the project the MO's and there energies shall be investigated. The difference in energies between certian MO's will hence tell us the energy difference between the valence and conduction bands of the molecule. Through investigating MO's electronic transitions should be predictable, and hence this will provided some predicted energies for the electronic transitions which will hopefully be observed in the UV vis.
As this is a large planar aromatic polymer it is expected that the MO's are large and difuse and spread over many atomic centres. It is also expected that they will exhibit alot of pi bonding properties.
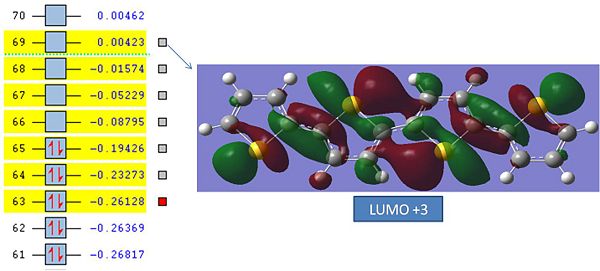


MO Energies and Energy Differences:
MO Energies:
| MO | Energy/a.u. | Energy/J | Electron Volts/Ev |
|---|---|---|---|
| LUMO+3 | 0.00423 | 1.84*10^-20 | 0.12 |
| LUMO+2 | -0.01574 | -6.86*10^-20 | -0.43 |
| LUMO+1 | -0.05229 | -2.28*10^-19 | -1.43 |
| LUMO | -0.08795 | -3.8*10^-19 | -2.38 |
| HOMO | -0.19426 | -8.47*10^-19 | -5.3 |
| HOMO-1 | -0.23273 | -1.01*10^-18 | -6.3 |
| HOMO-2 | -0.26128 | -1.14*10^-18 | -7.13 |
Energy Differences:
| MO's | Energy differnce/J | Energy difference/Ev |
|---|---|---|
| HOMO LUMO | 4.672*10^-19 | 2.92 |
| HOMO LUMO+1 | 6.192*10^-19 | 3.87 |
| HOMO LUMO+2 | 7.792*10^-19 | 4.87 |
| HOMO LUMO+3 | 8.672*10^-19 | 5.42 |
Analysis of MO's:
It can instantly be seen that the MO's are lrge and very diffuse covering many atomic centres. The MO's also exhibit large amounts of Pi bonding characteristic which is expected from a large aromatic compound. The Visulised MO's also show that the electron density is found predominantly along bonds rather than being diffuse and across the aromatic ring.
The most interesting Thing about the MO's is that the LUMO, LUMO+1 and, LUMO+2 all have negative energies! This means that when electron density is placed into these orbitals it actually stabalises the molecule. This explains why the molecule is an electrical conductor. This is very interesting as most LUMO's have a destabalising effect on molecules.
The HOMO LUMO gap is also very small. This is shown above in the Energies and the Energy diferences between the MO's.
The fact that the molecule has 3 MO's with a negative energy implies it will be a fairly good electrical conductor, however it is always good to compare the results to another conducting polymer. Mr Joe Rumor has carried out a similar investigation into a different thiophene polymer. His polymer reveals 4 LUMO's with a negative energy. This means that his polymer will be a better conductor than this one. This nicely demonstrates the power of computational chemistry in such a field as new semi conducting polymer design, as it shows how by modelling the molecules before synthesising them we could predict which one will be a better conductor. From these two projects it can be concluded that Mr Rumors molecule would be a better molecule to synthesis if we were trying to maximise electrical conductivity.
Please see this link: http://www.ch.ic.ac.uk/wiki/index.php/Namespace:jr4072PROJECT
UV Vis and TDDFT:
With the MO's modelled a TDDFT will be applied to the optimised molecular structure 1. This should generate a Predicted UV Vis spectrum. The UV Vis spectrum should show the electronic transitions in the molecule. These are the promotions of one electron from the HOMO to one of the LUMO's depending on the HOMO LUMO+n (n=0,1,2....) energy gap.
Some of these energy gaps have been calculated from the MO analysis. Using E=HF and V=F*wavelength, some predicted maximum wavelengths at which these electronic transitions are observed at can be predicted. Note: the transitions in the UV could occur at higher energies due to other factors such as stokes shift and spin forbidden transitions)
Predicted Peaks From MO Analysis:
| MO's | Energy differnce/J | Frequency of Light Absorbed/Hz | Wavelength of light Asorbed/nm | Comment |
|---|---|---|---|---|
| HOMO LUMO | 4.672*10^-19 | 7.05*10^14 | 425.5 | Absorbs Violet/may be visible, might be red in colour |
| HOMO LUMO+1 | 6.192*10^-19 | 9.35*10^14 | 320.8 | Absorbs UV |
| HOMO LUMO+2 | 7.792*10^-19 | 1.17*10^15 | 256.4 | Absorbs UV |
| HOMO LUMO+3 | 8.672*10^-19 | 1.31*10^15 | 229 | Absorbs UV |
From these calculations it can be seen that most of the peaks will be in the ultra violet region of the electromagnetic spectrum. if the HOMO LUMO gap were decreased this could lead to the light absorbing light in the visible region. This may be achievable by extending the length of the polymer and creating even more diffuse molecular orbitals.
The TDDFT was submitted to the SCAN computer on monday the 7th of december at midday. As of yet the calculation has not been completed. If it is completed in the next few days it will be emailed to the marker of this project.
Conclusion:
In conclusion to the project, the optimum geometry for the 4T thiophene ring was successfully determined. The optimisation process revealed some interesting trends which were analysed and discussed. With the optimum geometry determined the the MO's were succesfully modelled. This graphically represented the MO's in a way that nicely demonstrated the properties we would expect from an organic semi conductor. The MO's showed the disperse delocalised pi based bonding commonly found in an aromatic compound and the very low energy LUMO's that, infact would stabalise the molecule if electron density were placed in them. This nicely demonstrated why this molecule would conduct electricity. This was compared to another organic semi conductor and this demonstrated how computational techniques could be used to predict the best conducting materials.
Finaaly the UV data was predicted from the HOMO LUMO gaps. Unfortunatly the TDDFT was not completed in time however it would be interesting to see if the predicted UV data would be comparable to the TDDFT. This requires further investigation.

