
Rep:Mod:MALIX9093MINIPROJECT
Abstract
Aromaticity is a 'fundamental chemical concept' which is 'associated with cyclic arrays of mobile electrons with favorable symmetries'[1]. This project involves looking at the relationship between the MO picture of molecular bonding of a molecule and its aromaticity, using GaussView 5.0, answering the following question: do these MOs relate to our common conception of aromaticity? The relative shapes and energies of the MOs of benzene and some of its isoelectronic analogues, i.e. boratabenzene, pyridinium and borazine, will be analysed and compared to understand how reducing the symmetry of a molecule might affect its reactivity.
Benzene
Optimisation
Breaking symmetry
Benzene was first optimised using a RB3LYP method and a 6-31G(d,p) basis set. The calculation were first carried out using the additional keyword "nosymm", which destroys the of the molecule, and hence allows us to find the lowest energy structure (which is particularly useful if the point group of the molecule is unknown).
| Molecule as shown by GaussView | 
|
| File Type | .log |
| Calculation Type | FOPT |
| Calculation Method | RB3LYP |
| Basis set | 6-31G(d,p) |
| Final Energy (a.u.) | -232.25820551 |
| Gradient (a.u.) | 0.00009550 |
| Dipole Moment (Debye) | 0.00 |
| Point Group | C1 |
| Time of calculation | 1 min 13.7s |
The RMS gradient is close to zero (in fact less than 0.001): 0.00009550 a.u., which means that the molecule was successfully optimised. This was further confirmed by looking at the convergence of the forces and displacements in the output files.
        Item               Value     Threshold  Converged?
Maximum Force            0.000212     0.000450     YES
RMS     Force            0.000085     0.000300     YES
Maximum Displacement     0.000991     0.001800     YES
RMS     Displacement     0.000315     0.001200     YES
Predicted change in Energy=-5.157444D-07
Optimization completed.
   -- Stationary point found.
N.B: The link to the log file can be found in any summary table under the heading "File Type"
Constraining symmetry to the D6H point group
Calculations were then performed constraining the symmetry to the D6H point group. As shown in the table here below, breaking the symmetry and constraining it give similar energy values. Therefore, further calculations were performed constraining the symmetry.
| File Type | .log |
| Calculation Type | FOPT |
| Calculation Method | RB3LYP |
| Basis set | 6-31G(d,p) |
| Final Energy (a.u.) | -232.25821387 |
| Gradient (a.u.) | 0.00008450 |
| Dipole Moment (Debye) | 0.00 |
| Point Group | D6H |
| Time of calculation (s) | 35.6 |
As shown here below, forces and displacements have converged, meaning that the molecule was successfully optimised.
        Item               Value     Threshold  Converged?
Maximum Force            0.000199     0.000450     YES
RMS     Force            0.000081     0.000300     YES
Maximum Displacement     0.000847     0.001800     YES
RMS     Displacement     0.000299     0.001200     YES
Predicted change in Energy=-4.636845D-07
Optimization completed.
   -- Stationary point found.
Frequency analysis
A frequency analysis was then carried out on benzene, to confirm that we had a minima of benzene molecule.
| File Type | .log |
| Calculation Type | FREQ |
| Calculation Method | RB3LYP |
| Basis set | 6-31G(d,p) |
| Final Energy (a.u.) | -232.25821387 |
| Gradient (a.u.) | 0.00008452 |
| Dipole Moment (Debye) | 0.00 |
| Point Group | D6H |
| Time of calculation | 1 min 6.2s |
As shown here below, forces and displacements have converged, meaning that the molecule was successfully optimised.
        Item               Value     Threshold  Converged?
Maximum Force            0.000199     0.000450     YES
RMS     Force            0.000085     0.000300     YES
Maximum Displacement     0.000806     0.001800     YES
RMS     Displacement     0.000346     0.001200     YES
Predicted change in Energy=-4.349367D-07
Optimization completed.
   -- Stationary point found.
Low frequencies ---   -4.6046   -4.6046   -0.0088   -0.0042   -0.0041    9.6590
Low frequencies ---  413.9386  413.9386  621.1428
Low frequencies are all very close to zero and within a range of +/- 15cm-1.
| No. | Form of the vibration | Frequency | Intensity | Symmetry (D3H point group) |
| 1 | 414 | 0 | E2u | |
| 2 | 414 | 0 | E2u | |
| 3 | 621 | 0 | E2g | |
| 4 | 621 | 0 | E2g | |
| 5 | _alix.gif) |
692 | 74 | A2u |
| 6 | 718 | 0 | B2g | |
| 7 | 864 | 0 | E1g | |
| 8 | 864 | 0 | E1g | |
| 9 | 973 | 0 | E2u | |
| 10 | 973 | 0 | E2u | |
| 11 | 1012 | 0 | B2g | |
| 12 | 1018 | 0 | B1u | |
| 13 | 1020 | 0 | A1g | |
| 14 | _alix.gif) |
1067 | 3 | E1u |
| 15 | _alix.gif) |
1067 | 3 | E1u |
| 16 | 1179 | 0 | B2u | |
| 17 | 1202 | 0 | E1g | |
| 18 | 1202 | 0 | E1g | |
| 19 | 1356 | 0 | B2u | |
| 20 | 1381 | 0 | A2g | |
| 21 | _alix.gif) |
1525 | 7 | E1u |
| 22 | _alix.gif) |
1525 | 7 | E1u |
| 23 | 1653 | 0 | E2g | |
| 24 | 1653 | 0 | E2g | |
| 25 | 3175 | 0 | B1u | |
| 26 | 3185 | 0 | E2g | |
| 27 | 3185 | 0 | E2g | |
| 28 | _alix.gif) |
3201 | 47 | E1u |
| 29 | _alix.gif) |
3201 | 47 | E1u |
| 30 | 3211 | 0 | A1g |
None of the vibrations are a negative number which means that molecule was fully optimised. There are 7 vibrational modes which have significant intensities: one which corresponds to the A2u mode and 6 which correspond to degenerate E1u vibrations, leading to four peaks on the IR spectrum, shown here below.

MOs analysis
A population analysis was carried out by include in the "additional keywords" section "pop=full".
| File Type | .log |
| Calculation Type | SP |
| Calculation Method | RB3LYP |
| Basis set | 6-31G(d,p) |
| Final Energy (a.u.) | -232.25821387 |
| Gradient (a.u.) | - |
| Dipole Moment (Debye) | 0.00 |
| Point Group | D6H |
| Time of calculation (s) | 24.4 |
Using the previous MO calculation, the calculated MOs were 'deconstructed' into LCAOs, and the 'center' part of the MO diagram of benzene, including both sigma and pi orbitals, was drawn, as shown here below.

Examining the MO diagram of benzene and more specifically the MOs allows us to the verify our common conception of aromaticity. Aromatic systems have been defined by Hückel as 'exceptionally stable'[2], 'planar, fully conjugated, monocyclic systems with (4n+2) π electrons [with] a closed shell of electrons all in bonding orbitals'[2]. MO 17,20 and 21 of respective symmetry a2u and e1g, are the only bonding MOs of benzene which possess delocalised π electron density. Each orbital holds two electrons, for a total of 6 π-electrons, which fulfills the 4n+2 rule, and allows us to draw a Musulin-Frost diagram, as shown here below [3]. Also, the planarity of benzene, 'allowing delocalisation [of the electron density] over all the ring'[2], is clearly depicted by the real MOs.

showing the π molecular orbitals involved in the aromaticity
NBOs analysis
A NBO analysis was carried out on benzene, to obtain a NBO charge distribution, shown here below.

As shown on the picture, hydrogens all appear as bright green, meaning that they are all in one environment, while carbons all appear as bright red, meaning that they all in another environment. This illustrates the fact that benzene has no dipole moment [4] and belongs to D6H point group and hence is completely symmetric. The specific NBO charges for the all the carbons and all the hydrogens are -0.239 and +0.239 respectively, which illustrates the relative electronegativities of both sets of atoms[5]: because carbon is more electronegative than hydrogen, the electron density will be more concentrated on the carbon framework than on the hydrogens, which is why it appears as bright red.
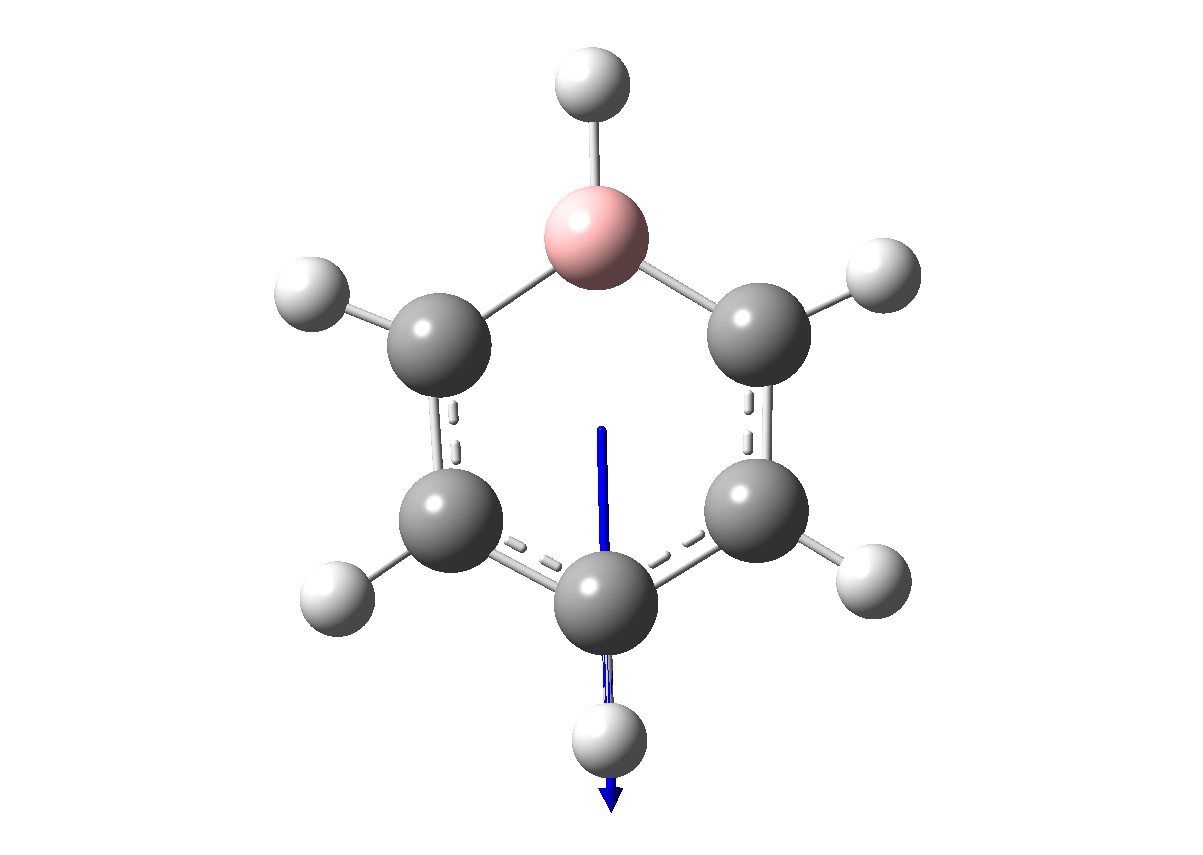
Boratabenzene
Optimisation
Boratabenzene was first optimised using a RB3LYP method and a 6-31G(d,p) basis set. Calculations were first carried out breaking the symmetry and then constraining symmetry to the C2v point group.
Breaking symmetry
| Molecule as shown by GaussView | 
|
| File Type | .log |
| Calculation Type | FOPT |
| Calculation Method | RB3LYP |
| Basis set | 6-31G(d,p) |
| Charge | -1 |
| Final Energy (a.u.) | -219.02052984 |
| Gradient (a.u.) | 0.00015882 |
| Dipole Moment (Debye) | 2.85 |
| Point Group | C1 |
| Time of calculation (s) | 43.0 |
Forces and displacements have converged, as shown here below.
        Item               Value     Threshold  Converged?
Maximum Force            0.000159     0.000450     YES
RMS     Force            0.000069     0.000300     YES
Maximum Displacement     0.000919     0.001800     YES
RMS     Displacement     0.000327     0.001200     YES
Predicted change in Energy=-6.623286D-07
Optimization completed.
   -- Stationary point found.
Constraining symmetry to the C2v point group
| File Type | .log |
| Calculation Type | FOPT |
| Calculation Method | RB3LYP |
| Basis set | 6-31G(d,p) |
| Charge | -1 |
| Final Energy (a.u.) | -219.02052981 |
| Gradient (a.u.) | 0.00016352 |
| Dipole Moment (Debye) | 2.85 |
| Point Group | C2v |
| Time of calculation (s) | 24.0 |
Forces and displacements have converged, as shown here below.
        Item               Value     Threshold  Converged?
Maximum Force            0.000158     0.000450     YES
RMS     Force            0.000071     0.000300     YES
Maximum Displacement     0.000900     0.001800     YES
RMS     Displacement     0.000327     0.001200     YES
Predicted change in Energy=-6.854764D-07
Optimization completed.
   -- Stationary point found.
Frequency analysis
A frequency analysis was then carried out on boratabenzene, to confirm that we had a minima of the molecule.
| File Type | .log |
| Calculation Type | FREQ |
| Calculation Method | RB3LYP |
| Basis set | 6-31G(d,p) |
| Charge | -1 |
| Final Energy (a.u.) | -219.02052981 |
| Gradient (a.u.) | 0.00016332 |
| Dipole Moment (Debye) | 2.85 |
| Point Group | C2v |
| Time of calculation (s) | 39.0 |
Forces and displacements have converged as shown here below.
        Item               Value     Threshold  Converged?
Maximum Force            0.000428     0.000450     YES
RMS     Force            0.000163     0.000300     YES
Maximum Displacement     0.000874     0.001800     YES
RMS     Displacement     0.000395     0.001200     YES
Predicted change in Energy=-7.515862D-07
Optimization completed.
   -- Stationary point found.
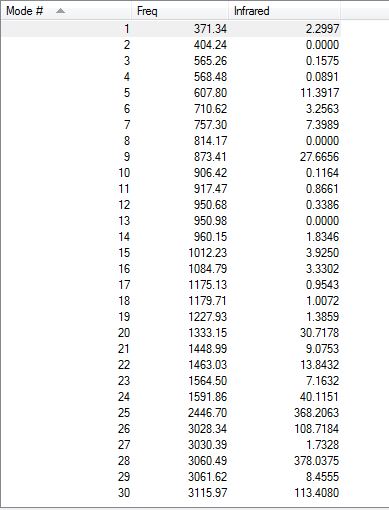
Low frequencies ---  -13.0215   -0.0004    0.0005    0.0007   14.9001   18.1396
Low frequencies ---  371.3424  404.2362  565.2634
Low frequencies are all very close to zero and slightly over the optimum range of +/- 15cm-1. Also, all frequencies are positive, which means that the molecule has reached a minimum. The obtained IR spectrum is shown here below.

NBOs analysis
| File Type | .log |
| Calculation Type | SP |
| Calculation Method | RB3LYP |
| Basis set | 6-31G(d,p) |
| Final Energy (a.u.) | -219.02052981 |
| Gradient (a.u.) | - |
| Dipole Moment (Debye) | 2.85 |
| Point Group | C2v |
| Time of calculation (s) | 5.0 |
A population analysis was carried out on boratabenzene, followed by a NBO analysis in order to obtain the NBO charge distribution.
| Molecule | Charge Distribution charge limits : -0.588 (bright red) to +0.588 (bright green) |
No. | Charge | Discussion (Comparison to Benzene) |
|---|---|---|---|---|
 |
 |
1 | -0.588 | Substituting a carbon for a boron atom results in a loss of symmetry and hence the point group of the molecule goes from D6H to C2v. As a result, contrarily to benzene, the charge is not uniformally distributed over the entire molecule (for example hydrogens are not all in the same environment) but is still symmetrically distributed with respect to the plane going from boron to H4. Also, boratabenzene possesses a dipole moment of 2.85 Debye, pointing away from the boron atom. Because boron is more electropositive than hydrogen, H7 which is directly bonded to boron, appears as more negative and hence posseses the most negative value of charge among all hydrogens:-0.095. The charge densities of the different carbons can be rationalised by the different resonance forms of boratabezene, shown here below, which involve the delocolisation of boron's negative charge accross the ring. As a result, carbons that are ortho and para to boron, i.e. C1, 2 and 4, have higher electron densities and hence possess the most negative values of charge (-0.588 for C1 and C2 and -0.340 for C4) while C3 and C5 possess the least negative values of charge (-0.250). This also explains why hydrogens attached to C1, 2 and 4, i.e. H6, 8 and 10, have more positive charge values (+0.184 for H6 and 8 and +0.186 for H10) than hydrogens attached C3 and 5, i.e. H9 and 11 (+0.179).
 |
| 2 | -0.588 | |||
| 3 | -0.250 | |||
| 4 | -0.340 | |||
| 5 | -0.250 | |||
| 6 | 0.184 | |||
| 7 | -0.095 | |||
| 8 | 0.184 | |||
| 9 | 0.179 | |||
| 10 | 0.186 | |||
| 11 | 0.179 | |||
| 12 | 0.202 |
Pyridinium
Optimisation
Pyridinium was first optimised using a RB3LYP method and a 6-31G(d,p) basis set. Calculations were first carried out breaking the symmetry and then constraining symmetry to the C2v point group.
Breaking symmetry
| Molecule as shown by GaussView | 
|
| File Type | .log |
| Calculation Type | FOPT |
| Calculation Method | RB3LYP |
| Basis set | 6-31G(d,p) |
| Charge | 1 |
| Final Energy (a.u.) | -248.66807396 |
| Gradient (a.u.) | 0.00003910 |
| Dipole Moment (Debye) | 1.87 |
| Point Group | C1 |
| Time of calculation (s) | 44.0 |
Forces and displacements have converged, as shown here below.
        Item               Value     Threshold  Converged?
Maximum Force            0.000064     0.000450     YES
RMS     Force            0.000023     0.000300     YES
Maximum Displacement     0.000822     0.001800     YES
RMS     Displacement     0.000175     0.001200     YES
Predicted change in Energy=-6.915358D-08
Optimization completed.
   -- Stationary point found.
Constraining symmetry to the C2v point group
| File Type | .log |
| Calculation Type | FOPT |
| Calculation Method | RB3LYP |
| Basis set | 6-31G(d,p) |
| Charge | 1 |
| Final Energy (a.u.) | -248.66807396 |
| Gradient (a.u.) | 0.00003869 |
| Dipole Moment (Debye) | 1.87 |
| Point Group | C2v |
| Time of calculation (s) | 21.0 |
Forces and displacements have converged, as shown here below.
        Item               Value     Threshold  Converged?
Maximum Force            0.000061     0.000450     YES
RMS     Force            0.000023     0.000300     YES
Maximum Displacement     0.000678     0.001800     YES
RMS     Displacement     0.000173     0.001200     YES
Predicted change in Energy=-6.751843D-08
Optimization completed.
   -- Stationary point found.
Frequency analysis
A frequency analysis was then carried out on pyridinium, to confirm that we had a minima of the molecule.
| File Type | .log |
| Calculation Type | FREQ |
| Calculation Method | RB3LYP |
| Basis set | 6-31G(d,p) |
| Charge | 1 |
| Final Energy (a.u.) | -248.66807396 |
| Gradient (a.u.) | 0.00003874 |
| Dipole Moment (Debye) | 1.87 |
| Point Group | C2v |
| Time of calculation (s) | 35.0 |
Forces and displacements have converged, as shown here below.
        Item               Value     Threshold  Converged?
Maximum Force            0.000155     0.000450     YES
RMS     Force            0.000039     0.000300     YES
Maximum Displacement     0.000741     0.001800     YES
RMS     Displacement     0.000226     0.001200     YES
Predicted change in Energy=-7.287676D-08
Optimization completed.
   -- Stationary point found.
Low frequencies ---   -7.1925    0.0003    0.0006    0.0006   17.3301   18.5152
Low frequencies ---  392.4542  404.0615  620.4714
Low frequencies are all very close to zero and slightly over the optimum range of +/- 15cm-1. Also, all frequencies are positive, which means that the molecule has reached a minimum. The obtained IR spectrum is shown here below.

NBOs analysis
| File Type | .log |
| Calculation Type | SP |
| Calculation Method | RB3LYP |
| Basis set | 6-31G(d,p) |
| Charge | 1 |
| Final Energy (a.u.) | -248.66807396 |
| Gradient (a.u.) | - |
| Dipole Moment (Debye) | 1.87 |
| Point Group | C2v |
| Time of calculation (s) | 5.0 |
A population analysis was carried out on pyridinium, followed by a NBO analysis in order to obtain the NBO charge distribution.
| Molecule | Charge distribution charge limits: -0.483 (bright red) to +0.483 (bright green) |
No. | Charge | Discussion (Comparison to Benzene) |
|---|---|---|---|---|
 |
 |
1 | -0.122 | Similarly to boratabenzene, the symmetry of pyridinium has been reduced to C2v, by substituting one of the carbons for a nitrogen. Likewise, the charge is no longer uniformally distributed over the entire molecule but is still symmetrically distributed with respect to the plane going from nitrogen atom to H1. Like boratabenzene and contrarily to benzene, pyridinium possesses a dipole moment of 1.87 Debye, going from nitrogen to H9 as shown here below. Because nitrogen is more electronegative than both hydrogen and carbon[5], it possesses the most negative value of charge of all atoms(-0.475). The charge densities of the different carbons can be rationalised by the different resonance forms of pyridinium, which involve the delocolisation of nitrogen's positive charge accross the ring, shown here below. As result, carbons that are ortho and para to nitrogen, i.e. C3, 4, and 1, possess the most positive /least negative values of charge (+0.071 for C3 and C4 and -0.122 for C1) while C2 and 5 possess the most negative values of charge (-0.241). This also explains why hydrogens attached to C3, 4, and 1, i.e. H8, 10 and 6, have less positive charge values (+0.285 for H8 and 10 and +0.292 for H6) than hydrogens attached C2 and 5, i.e. H7 and 11 (+0.297).
 |
| 2 | -0.241 | |||
| 3 | 0.071 | |||
| 4 | 0.071 | |||
| 5 | -0.241 | |||
| 6 | 0.292 | |||
| 7 | 0.297 | |||
| 8 | 0.285 | |||
| 9 | 0.483 | |||
| 10 | 0.285 | |||
| 11 | 0.297 | |||
| 12 | -0.475 |
Borazine
Optimisation
Borazine was first optimised using a RB3LYP method and a 6-31G(d,p) basis set. The calculation were first carried out destroying the symmetry of the molecule and then constraining it to the D3H point group.
Breaking symmetry
| Molecule as shown by GaussView | 
|
| File Type | .log |
| Calculation Type | FOPT |
| Calculation Method | RB3LYP |
| Basis set | 6-31G(d,p) |
| Final Energy (a.u.) | -242.68459788 |
| Gradient (a.u.) | 0.00007126 |
| Dipole Moment (Debye) | 0.00 |
| Point Group | C1 |
| Time of calculation (s) | 49.0 |
Forces and displacements have converged, as shown here below.
        Item               Value     Threshold  Converged?
Maximum Force            0.000117     0.000450     YES
RMS     Force            0.000036     0.000300     YES
Maximum Displacement     0.000327     0.001800     YES
RMS     Displacement     0.000104     0.001200     YES
Predicted change in Energy=-1.205460D-07
Optimization completed.
   -- Stationary point found.
Constraining symmetry to the D3H point group
| File Type | .log |
| Calculation Type | FOPT |
| Calculation Method | RB3LYP |
| Basis set | 6-31G(d,p) |
| Final Energy (a.u.) | -242.68458184 |
| Gradient (a.u.) | 0.00006419 |
| Dipole Moment (Debye) | 0.00 |
| Point Group | D3H |
| Time of calculation (s) | 19 |
Forces and displacements have converged, as shown here below.
        Item               Value     Threshold  Converged?
Maximum Force            0.000085     0.000450     YES
RMS     Force            0.000033     0.000300     YES
Maximum Displacement     0.000251     0.001800     YES
RMS     Displacement     0.000075     0.001200     YES
Predicted change in Energy=-9.320702D-08
Optimization completed.
   -- Stationary point found.
Frequency analysis
A frequency analysis was then carried out on borazine, to confirm that we had a minima of the molecule.
| File Type | .log |
| Calculation Type | FOPT |
| Calculation Method | RB3LYP |
| Basis set | 6-31G(d,p) |
| Final Energy (a.u.) | -242.68458184 |
| Gradient (a.u.) | 0.00006436 |
| Dipole Moment (Debye) | 0.00 |
| Point Group | D3H |
| Time of calculation (s) | 22.0 |
Forces and displacements have converged, as shown here below.
        Item               Value     Threshold  Converged?
Maximum Force            0.000203     0.000450     YES
RMS     Force            0.000064     0.000300     YES
Maximum Displacement     0.000311     0.001800     YES
RMS     Displacement     0.000098     0.001200     YES
Predicted change in Energy=-1.075851D-07
Optimization completed.
   -- Stationary point found.
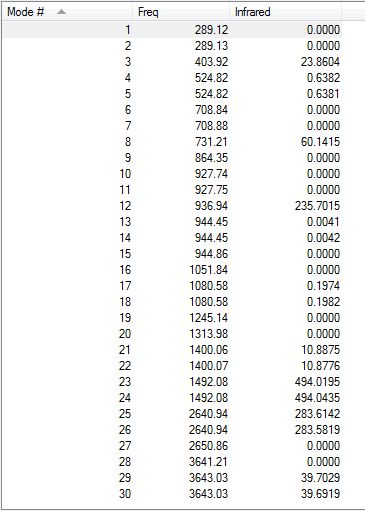
Low frequencies ---  -12.7010  -12.4894   -9.0645   -0.0099    0.0374    0.0776
Low frequencies ---  289.1171  289.1263  403.9186
Low frequencies are all very close to zero and slightly over the optimum range of +/- 15cm-1. Also, all frequencies are positive, which means that the molecule has reached a minimum. The obtained IR spectrum is shown here below.

NBOs analysis
| File Type | .log |
| Calculation Type | SP |
| Calculation Method | RB3LYP |
| Basis set | 6-31G(d,p) |
| Charge | 1 |
| Final Energy (a.u.) | -242.68458184 |
| Gradient (a.u.) | - |
| Dipole Moment (Debye) | 0.00 |
| Point Group | D3H |
| Time of calculation (s) | 4.0 |
A population analysis was carried out on borazine, followed by a NBO analysis in order to obtain the NBO charge distribution.
| Molecule | Charge Distribution charge limits: -1.102(bright red) to +1.102(bright green) |
No. | Charge | Discussion (Comparison with Benzene) |
|---|---|---|---|---|
 |
 |
1 | 0.432 | The symmetry of borazine is reduced compared to benzene: its point group changes from D6H to D3H[6]. However, borazine retains a higher degree of symmetry than boratabenzene and pyridinium, which explains why it does not possess any dipole moment, as benzene. All the boron atoms are in the same environments and they represent low electron density sites; in fact, they have the most positive charge value (+0.742), as the most are electropositive elements. All the nitrogen atoms are also in the same environment, they represent high electron density sites; they have the most negative charge value (-1.102), as they are the most electronegative elements. There are two different sets of hydrogens: the ones that are attached to the borons (H2, 4, 6) possess a slight negative charge value (-0.077), as boron is more electropositive than hydrogen, while the ones that are attached to nitrogens (H1, 3, 5) possess a high positive charge value (+0.432) due to the strong electronegativity difference between hydrogen and nitrogen. |
| 2 | -0.077 | |||
| 3 | 0.432 | |||
| 4 | -0.077 | |||
| 5 | 0.432 | |||
| 6 | -0.077 | |||
| 7 | -1.102 | |||
| 8 | -1.102 | |||
| 9 | -1.102 | |||
| 10 | 0.747 | |||
| 11 | 0.747 | |||
| 12 | 0.747 |
MO Analysis
Comparison of three different valence occupied MOs
| No. | Benzene | Boratabenzene | Pyridinium | Borazine | |
|---|---|---|---|---|---|
| 1 |  E= -0.35999 |
 |
 E= -0.13208 |
 E= -0.64064 |
 E= -0.36130 |
 The molecular orbitals shown above represent the π totally bonding interaction. The bonding interactions are seperated by a nodal plane, located in the plane of the molecule. In the case of benzene, the electron density is uniformally delocolised accross the entire π-conjugated system, as shown here below. However, this is not the case for the three other molecules: boratabenzene's MO shows less electron density around the boron atom (which is illustrated by the smaller width of the MO towards the boron atom), while pyridinium's MO shows more electron density around the nitrogen atom, as depicted here below. Finally, borazine's MO shows alternating areas of lower and higher electron density, corresponding to borons and nitrogens respectively. This reflects the relative charge distributions previously analysed. In fact, it can be rationalised by the following statement : 'more electronegative elements, contribute more to the bonding MO'[6]. As a result, when drawing boratabenzene, pyridinium and borazine LCAOs, boron p orbitals should appear smaller than carbon p orbitals (as they will contribute less to the bonding MO), while nitrogen p orbitals should appear larger than carbon p orbitals.  Moreover, substituting one carbon for a boron (to obtain boratabenzene) raises the energy of the MO, while substituting one carbon for a nitrogen (to obtain pyridinuim) lowers its energy. As the electronegativity of the substituent is increased, the extent of delocalisation is reduced and the MO becomes increasingly stabilised. In borazine, substituting 3 carbons for nitrogens lowers the energy of the MO, while substituting 3 carbons for borons raises its energy. As result, both effects cancel out and the energy of borazine and benzene's MOs are found to be similar. | |||||
| 2 |  E= -0.24691 |
 |
 E= -0.03493125px |
 E= -0.47885 |
 E=-0.27590 |
 Similarly to MO 1, the electron density is uniformly spread out over the 4 carbon atoms in the case of benzene, but not in the case of boratabenzene nor pyridinium: there is an increased amount of electron density onto the carbons ortho to the boron atom in the case of bortabenzene, while there is increased amount of electron density onto the carbons meta to the nitrogen atom, in the case of pyridinium. This can be rationalised by the respective charge distributions previously described. When drawing LCAOs, p orbitals of carbons that are ortho to the heteroatom should appear larger in the case boratabenzene (as they contribute more to bonding) but smaller in the case of pyridinium. Borazine and benzene MOs look relatively similar; however, in the case of borazine, the electron density is not evenly distributed: in fact, most of the density lies on the nitrogen atoms. Therefore, when drawing the corresponding LCAO, nitrogen p orbitals should appear much larger than boron ones. Again the energy of the MO is raised for boratabenzene and lowered for pyridinium compared to that of benzene's or borazine's. This can be explained using a similar argument than the one previously stated. However, it should be noted that, this time, the heteratoms are not directly involved in the MO, as they belong to the nodal plane. The electronegative nitrogen is electron withdrawing, and hence pulls away electron density from the neighbouring carbon atoms. This reduces the amount of delocalisation and thus stabilises the MO. The reverse process occurs when substituting a carbon for a boron atom. Also, for both benzene and borazine, MO 2 and 3 are degenerate, which is not the case for boratabenzene nor pyridinium. This is because of the higher degree of symmetry of both benzene (D6H) and borazine (D3H)compared to boratabenzene and pyridinium (C2v). | |||||
| 3 |  E= -0.24691 |
 |
 E= 0.01093 |
 E= -0.50847 |
 E= -0.27590 |
 Similarly to MO 1 and 2, the electron density is uniformly spread out over the 6 carbon atoms in the case of benzene. However, in the case of boratabenzene and pyridium both lobes are uneven. In the case of boratabenzene, the lobe which involves the boron atom is much larger than the other one: because boron is more electropositive than the adjacent carbons, p orbitals become more diffuse and delocalised. On the contrary, in the case of pyridinium, the lobe which involves the nitrogen atom is much smaller than the other one. The 'shrinking' of this lobe highlights the electronegativity of nitrogen: nitrogen pulls electron density towards itself, which results in a strongly localised bond. This could also be rationalised by the following statement : 'less electronegative elements, contribute more the antibonding MO'[6]. As a result, when drawing the LCAOs, the set of the 3 p orbitals containing the heteroatom should appear larger than the set of the 3 carbon p orbitals, in the case of boratabenzene, but smaller in the case of pyridinium. The differences in the relative energies of the MO (lower energy of boratabenzene's MO and higher energy of pyridinuim's compared to benzene's or borazine's)can be explained using the same reasoning than for MO 1. The degeneracy of MOs 2 and 3 for benzene and borazine was previously explained. Finally, it is worth noting that, in the case of pyridinum, MO 3 is more stable than MO 2, implying that there has been a reordering of the relative energies of the MOs. This is because in MO 3, the heteroatom is directly involved in bonding, while in MO 2 it belongs to the nodal plane; therefore, the extent by which the MO is stabilised due to the electronegativity of nitrogen is greater in MO 3 than in MO 2. | |||||
Comparison of the full MO diagrams
Substituting a carbon for a boron, to obtain boratabenzene, will increase the energy of the MOs (as explained earlier), and hence shift the entire MO diagram to higher energies, suggesting that the molecule will be more reactive than benzene. On the contrary, substituting a carbon for a nitrogen, to obtain pyridinium, will lower the energies of the MOs and hence shift the entire MO diagram to lower energies, suggesting that the molecule will be less reactive and hence more stable than benzene. Substitution will also lead to the reordering of certain energy levels, as well as the loss of their degeneracy, due to the reduction of symmetry: going from a D6H point group to C2V point group. Borazine's MO diagram will be relatively similar to that of benzene's, suggesting that both molecules will show similar reactivity and stability: MOs will have similar energies and their will degeneracy remain, however, like for boratabenzene and pyridium, symmetry labels associated to the energy levels will change as symmetry has been reduced: going from a D6H point group to a D3H point group.
Conclusion
This project looked at the relationship between the MO picture of molecular bonding of molecules and their aromaticity, with a focus on benzene and some its isoelectronic analogues, i.e. boratabenzene, pyridinium and borazine. Each molecule was fully optimised, constraining its symmetry, thanks to GaussView 5.0, using a RB3LYP method and a 6-31G (d,p) basis set. A frequency analysis was then run to check whether the molecule had reached a minimum, before carrying out a Natural Bonding Orbital analysis. That way, charge distributions of the relative analogues were analysed and compared to that of benzene's. Unlike benzene or borazine, calculations showed that boratabenzene and pyridinium possessed dipole moments, which were rationalised by their asymmetric distributions of charge. Boratabenzene and pyridinium showed 'opposite' distributions of charge due to the difference in electronegativies between both heteroatoms (for example: in the case of boratabenzene, carbons that were ortho to the heteroatom were the ones holding the most electron density, while in the case of pyridinuim, those were the ones holding the least electron density). The MOs of benzene and of its three analogues were also calculated from the population analysis. The "center" part of the MO diagram of benzene, including both σ and π orbitals, was drawn and inspected in order to relate benzene's structure to the common conception of aromaticity. Three of benzene’s valence occupied MOs (number 17, 20 and 21) were inspected and compared to the corresponding MOs of its analogues. Results showed that substituting a carbon for a boron atom resulted in a destabilisation of the MO and hence in an increase of its energy. This was rationalised by the electropositivity of boron, leading to extensive delocalisation of the electron density and hence higher diffusivity of the MO. The reverse trend was observed for pyridinium, which showed lower energy and hence more stable MOs; this was therefore rationalised by the electronegativity of nitrogen. Borazine possesses an equal number of nitrogens and borons; as a result, borazine and benzene's MOs had very similar energies. The relative energies of the MOs could interpreted in terms of reactivity. Indeed, pyridinuim is likely to be the most stable and hence the least reactive, followed by benzene and borazine, which should show similar reactivities, while boratobenzene is likely to be the least stable and hence the most reactive. Finally, loss of degeneracy of certain energy levels was observed for boratabenzene and pyridinium; this was rationalised by their lower degree of symmetry compared to benzene and borazine.
Further scope
Extra calculations could be run to explore further in this domain of research, by looking at:
- other benzene analogues by substituting carbons by other heteroatoms (for example, by looking at heavier group 15 analogues of nitrogen heterocycles, such as phosphinie or bismine) or by substituting hydrogens by other atoms and comparing their relative reactivities
- smaller rings such as pyrrole and pyrrole's analogues (phosphole and bismole) or larger rings
- anti-aromatic systems and comparing the shapes and relative energies of the MOs to aromatic systems (for example by taking out two electrons from benzene and seeing how it might affect its stability)
References
<references>
- ↑ 1.0 1.1 P. Schleyer & H. Jiao, Pure & Appl. Chem., 1996, 68, 209-218
- ↑ 2.0 2.1 2.2 2.3 J. Clayden, N. Greeves, S. Warren, P. Wothers, Organic Chemistry, Oxford University Press, Oxford 8th edn., 2009
- ↑ 3.0 3.1 A. Frost & B. Musulin, J. Chem. Phys., 1953, 21, 572
- ↑ 4.0 4.1 D. Craig, Heteroaromatic Chemistry, 2nd Year Organic Chemistry, Imperial College, 2013
- ↑ 5.0 5.1 5.2 P. Atkins, T. Overton, J. Rourke, M. Weller, F. Amstrong, Inorganic Chemistry, Oxford University Press, Oxford, 5th edn., 2010
- ↑ 6.0 6.1 6.2 6.3 6.4 P. Hunt, Molecular Orbitals in Inorganic Chemistry, 2nd Year Inorganic Chemistry, Imperial College, 2012