
Rep:Mod:MALIX9093
INORGANIC MODULE
Bonding and molecular orbitals in main group compounds
OPTIMISATION
BH3, GaBr3 and BBr3 molecules were first optimised using Gaussian 09, and there optimised geometries were observed using GuassView 5.0.9.
BH3 molecule
| 1st Optimisation | 2nd Optimisation | |
|---|---|---|
| File Type | .log | .log |
| Calculation Type | FOPT | FOPT |
| Calculation Method | RB3LYP | RB3LYP |
| Basis set | 3-21G | 6-31G(d,p) |
| Final Energy (a.u.) | -26.46226338 | -26.61532363 |
| Gradient (a.u.) | 0.00020672 | 0.00000235 |
| Dipole Moment(Debye) | 0.00 | 0.00 |
| Point Group | D3H | D3H |
| Time of calculation (s) | 38.0 | 17.0 |
The BH3 molecule was first created. All three B-H bonds were fixed to 1.5 Å. It was then optimised using a B3LYP method and a 3-21G basis set. A higher level basis set, 6-31G(d,p), was then used to re-optimise the molecule as the 3-21G basis set leads to fast calculation times but also very low accuracy.
For both calculations, the RMS gradient was found to be close to zero (in fact less than 0.001): 0.00020672 and 0.00000235 a.u. for the first and second optimisations respectively, which means that the molecules were successfully optimised. This was further confirmed by looking at the convergence of the forces and displacements in the output files.
N.B: The link to the log file can be found in any summary table under the heading "File Type"
For the first optimisation
Item               Value     Threshold  Converged?
Maximum Force            0.000413     0.000450     YES
RMS     Force            0.000271     0.000300     YES
Maximum Displacement     0.001610     0.001800     YES
RMS     Displacement     0.001054     0.001200     YES
Predicted change in Energy=-1.071764D-06
Optimization completed.
   -- Stationary point found.
For the second optimisation
Item               Value     Threshold  Converged?
Maximum Force            0.000005     0.000450     YES
RMS     Force            0.000003     0.000300     YES
Maximum Displacement     0.000019     0.001800     YES
RMS     Displacement     0.000012     0.001200     YES
Predicted change in Energy=-1.305135D-10
Optimization completed.
   -- Stationary point found.
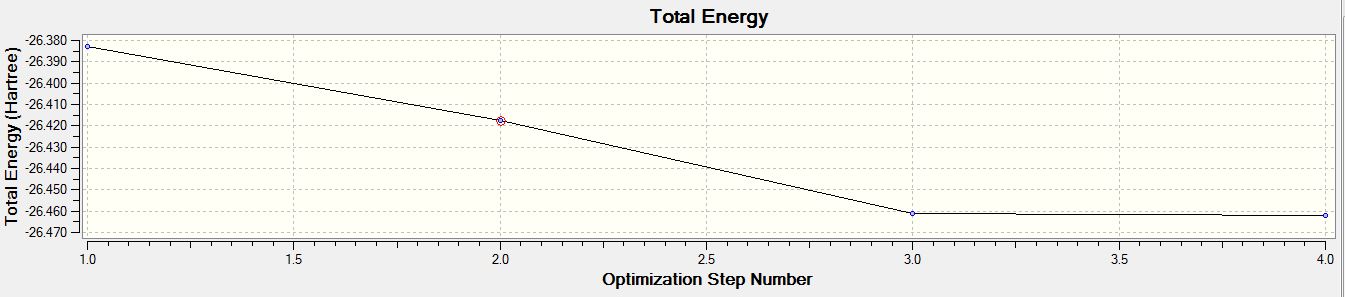
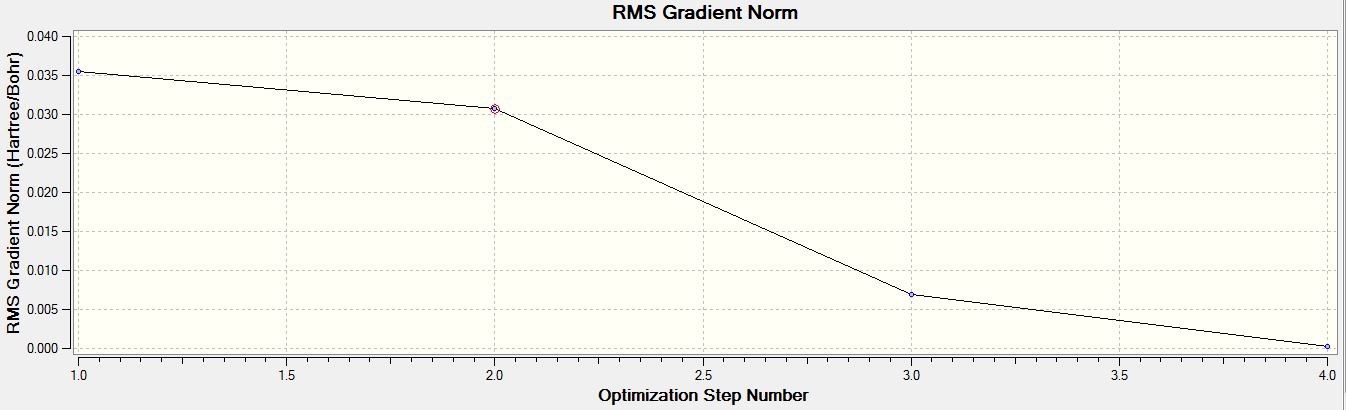
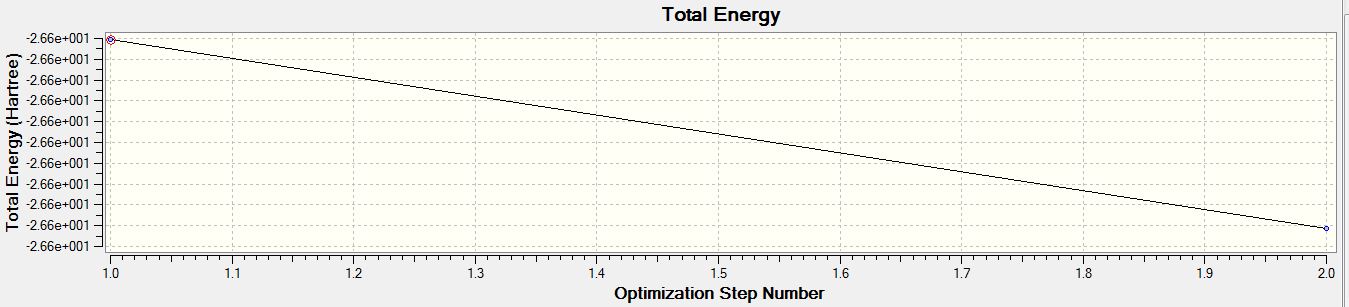
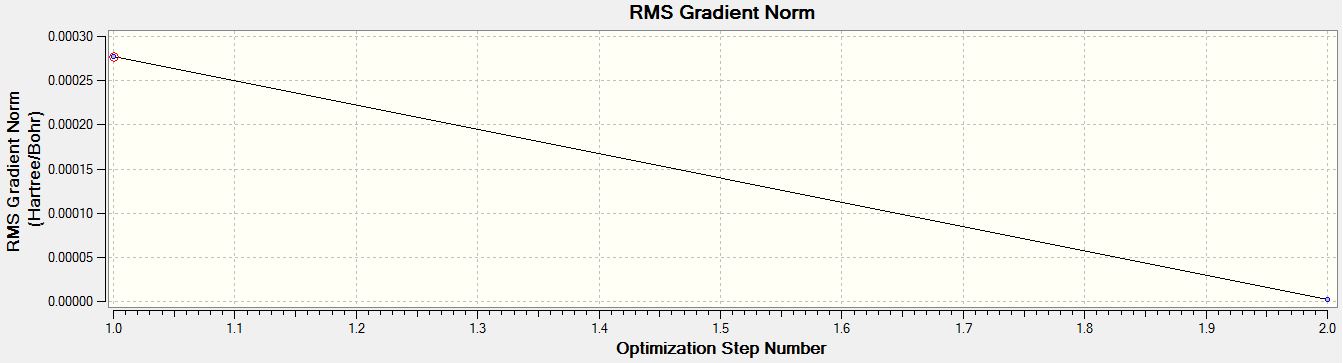
The Total Energy curves and RMS Gradient Norm graphs were obtained for both optimisation:
- Total Energy Curve of BH3 for the 3-21G basis set
- RMS Gradient Norm Graph of BH3 for the 3-21G basis set
- Total Energy Curve of BH3 for the 6-31G(d,p) basis set
- RMS Gradient Norm Graph of BH3 for the 6-31G(d,p) basis set
The B-H bond distance and the H-B-H bond angle were found after both optimisations, and are shown in the table here below. The bond distance is relatively close to the literature value, 1.188 Å [1] , as they can both be rounded up to 1.19 Å. As excepted for a trigonal planar molecule, the bond angle is of 120◦.
| 1st Optimisation | 2nd Optimisation | |
|---|---|---|
| B-H Bond Distance(Å) | 1.19349 | 1.19232 |
| B-H Bond Distance (Å), taking into account the accuracy | 1.19 | 1.19 |
| H-B-H Bond Angle (◦) | 120.0 | 120.0 |
GaBr3 molecule
| File Type | .log |
| Calculation Type | FOPT |
| Calculation Method | RB3LYP |
| Basis set | LANL2DZ |
| Final Energy (a.u.) | -41.70082783 |
| Gradient (a.u.) | 0.00000016 |
| Dipole Moment (Debye) | 0.00 |
| Point Group | D3H |
| Time of calculation (s) | 27.6 |
The GaBr3 molecule was created by restricting the symmetry to the D3H point group and its geometry was optimised using the B3LYP method and associated to a medium level basis set used for heavier elements : LanL2DZ basis set. To do so, the job was submitted to the scan HPC service and the completed GaBr3 optimisation was then deposited in the chemical database D-space (DOI:10042/25188 ).
The RMS gradient was found to be close to zero, 0.00402846 a.u., meaning that the molecule was successfully optimised. As before, this was further confirmed by looking at the convergence of the forces and displacements in the output files.
Item               Value     Threshold  Converged?
Maximum Force            0.000000     0.000450     YES
 RMS     Force            0.000000     0.000300     YES
 Maximum Displacement     0.000003     0.001800     YES
 RMS     Displacement     0.000002     0.001200     YES
 Predicted change in Energy=-1.282684D-12
 Optimization completed.
    -- Stationary point found.
The Ga-Br bond distance and the Br-Ga-Br bond angle are shown in the table here below. It is worth noting that the value found for the bond distance is very close to the one reported by the CRC Handbook, of 2.3525 Å [2], (+/-0.04 Å) and that the bond angle is of 120◦, which is what it is expected for a trigonal planar molecule.
| Ga-Br Bond Distance (Å) | 2.39 |
| Br-Ga-Br Bond Angle (◦) | 120.0 |
BBr3 molecule
The BBr3 molecule was created using the log file of the previously optimised BH3 molecule and replacing each of the hydrogen atoms by a bromine atom. The molecule was then optimised using the RB3LYP method and the Gen basis set. While the basis sets were specified for all atoms, the pseudo-potential was specified for the Br atoms as they are heavier atoms than B atoms: a 6 -31G(d,p) basis set was used for the B atom while a LanL2DZ basis set was used for all the Br atoms. While the pseudo-potential for the Br atoms. The job was submitted to the scan HPC service and the completed BBr3 optimisation was then deposited in the chemical database D-space(DOI:10042/25197 ).
| File Type | .log |
| Calculation Type | FOPT |
| Calculation Method | RB3LYP |
| Basis set | GEN |
| Final Energy (a.u.) | -64.43645296 |
| Gradient (a.u.) | 0.00000382 |
| Dipole Moment(Debye) | 0.00 |
| Point Group | D3H |
| Time of calculation (s) | 37.0 |
The RMS gradient is close to zero, 0.00000382 a.u., meaning that the molecule was successfully optimised. This was further confirmed by examining the convergence of the forces and displacements.
Item               Value     Threshold  Converged?
 Maximum Force            0.000008     0.000450     YES
 RMS     Force            0.000005     0.000300     YES
 Maximum Displacement     0.000036     0.001800     YES
 RMS     Displacement     0.000023     0.001200     YES
 Predicted change in Energy=-4.026916D-10
 Optimization completed.
    -- Stationary point found.
The B-Br bond distance and the Br-B-Br bond angle are shown in the table here below. It is worth noting that the value found for the bond distance is close to the one reported by the literature [3], 1.87 Å (+/-0.1 Å), and that the bond angle is of 120◦, which is what it is expected for a trigonal planar molecule.
| B-Br Bond Distance (Å) | 1.93396 |
| B-Br Bond Distance (Å), taking into account accuracy | 1.93 |
| B-Br-B Bond Angle (◦) | 120.0 |
Comparison of Bond distances
| Molecule | B-H (BH3) | B-Br (BBr3) | Ga-Br (GaBr3) |
|---|---|---|---|
| Bond Distances (Å) | 1.19 | 1.93 | 2.39 |
The equilibrium bond length in a molecule is the separation of the centres of the two bonded atoms; and the contribution of the atoms to a covalent bond, known as the covalent radii varies through the periodic table in much the same way as metallic and ionic radii. [4]
The bond length is directly related to its strength - the stronger the bond, the shorter it will and, vice versa, the weaker the bond, the longer it will be - which is affected by the atoms themselves, and more specifically their size and electronegativity.
- Small central elements and ligands will lead to efficient orbital overlap and hence strong and short bonds, which is the case for the BH3 molecule.
- Substituting the hydrogen atoms for larger bromine atoms, results in poorer orbital overlap and hence weaker and longer bonds (1.93396 Å for B-Br versus 1.19232 Å for B-H).
- Substituting the boron atom for a larger gallium atom also results in a lengthening of the bond: 2.39000 Å for Ga-Br versus 1.93396 Å for B-Br. While B and Ga are both in Group 13, B belongs to the 2nd period of the periodic table and Ga belongs to the 4th one. We could be expect Ga and B to show better orbital overlap, as they are of similar sizes compared to B and Br; however, due their larger size, their orbitals are more diffuse, which leads to weaker and hence longer bonds.
- The bond length will also be affected by the polarity of the bond. Indeed, increasing electronegativity difference between the central element and the ligands will lead to a strengthening and hence a shortening of the bond. As a result, B-Br and Ga-Br bonds for which the electronegativity differences of the atoms are 0.8 and 1.2 respectively show shorter bonds distances from the ones predicted by considering the covalent interactions only(i.e. taking the sum of the covalent radii): 1.93 versus 2.04 Å [4] and 2.39 versus 2.42 Å[4] for B-Br and Ga-Br bonds respectively.
What is a bond?
A bond forms when the electrons accumulate in regions where atomic orbitals overlap and interfere constructively. In fact, this process becomes favourable in the internuclear region; therefore, a chemical bond is often described as the accumulation of electron density in the internuclear region. Indeed, as the electron moves towards the internuclear region, the potential energy increases, but, the atomic orbitals shrink, which increases the electron-nuclear attraction and hence leads to a net lowering of the potential energy.[5]
It is worth noting that in some structures, Gaussview does not draw in the bonds where they are expected. This is because GaussView determines where bonds should be using a distance criteria: a bond will not show up if it is larger than the value originally expected by GaussView.
FREQUENCY ANALYSIS
A frequency was then carried out on both BH3 and GaBr3 molecules. Carrying a frequency analysis is essential for two reasons. First, it ensures us that the optimised geometry is in its most stable ground state. After the frequencies were calculated from the second derivative of the potential energy surface with respect to distance, a critical point can easily be identified: if the frequencies are all positive, an energy minimum has been found - this corresponds to the ground state- however, if the frequency is negative, a maximum as been found - this correponds to a transition state -. It is worth noting that if more than one frequency is negative, finding a critical point was unsuccessful, meaning that optimisation has failed. Carrying a frequency analysis also provides the IR and Raman modes which can then be compared with the ones found experimentally.
The optimisation of the geometry corresponds to the the first step for any quantum chemical calculation as we are determining the optimium position of the nuclei for a given electronic configuration. The method used determines the type of approximations that are made in solving the Schrodinger equation, while the the basis set determines the accuracy. Because the frequency analyses involves calculating the second derivative of the potential energy surface, it is essential to use the same method and basis set for both the optimisation and the frequency analysis calculations otherwise some discrepancies in the energy values may arise.
Non-linear molecules possess 3N-6 vibrational frequencies. The 'low frequencies' represent the "-6" of the equation and represent the motions of the center of mass of the molecule. These should small - in fact, the closer they are to zero, the better the optimisation - and within a range of +/- 15cm-1.
BH3 molecule
A frequency analysis was first carried out on BH3.
| File Type | .log |
| Calculation Type | FREQ |
| Calculation Method | RB3LYP |
| Basis set | 6-31G(d,p) |
| Final Energy (a.u.) | -26.61532363 |
| Gradient (a.u.) | 0.00000237 |
| Dipole Moment (Debye) | 0.0000 |
| Point Group | D3H |
| Time of calculation (s) | 12.0 |
N.B.: The summary energy is the same than for the optimised BH3: -26.61532363 a.u.
As shown here below, forces and displacements have converged, meaning that the molecule was successfully optimised.
         Item               Value     Threshold  Converged?
 Maximum Force            0.000005     0.000450     YES
 RMS     Force            0.000002     0.000300     YES
 Maximum Displacement     0.000019     0.001800     YES
 RMS     Displacement     0.000009     0.001200     YES
 Predicted change in Energy=-1.323376D-10
 Optimization completed.
    -- Stationary point found.
 Low frequencies ---   -0.9033   -0.7343   -0.0055    6.7375   12.2491   12.2824
 Low frequencies --- 1163.0003 1213.1853 1213.1880
Low frequencies are all very close to zero and within a range of +/- 15cm-1.
| No. | Form of the vibration | Frequency | Intensity | Symmetry (D3Hpoint group) |
| 1 |  Wagging All H atoms oscillate out of the plane of the molecule in a concerted motion. The B atom also shows oscillations, but, to a lower extent and in opposite direction. |
1163 | 93 | A2" |
| 2 |  Scissoring The two bottom H move towards each other and then away from each other, in the plane of the molecule. The third H and the B atom are thus forced to move in opposite direction. |
1213 | 14 | E' |
| 3 |  Rocking All three H are moving in the plane of the molecule, in different directions. The B atom is also moving in the plane of the molecule but to a much lower extent. |
1213 | 14 | E' |
| 4 |  Symmetrical Stretching All H atoms move in and out together, in a concerted motion, while B remains stationary. |
2582 | 0 | A1' |
| 5 |  Asymmetrical Stretching The bottom H are strectching asymmetrically, while the top H remains stationary. The B is forced to oscillate in the plane of the molecule. |
2715 | 126 | E' |
| 6 |  Asymmetrical Stretching The bottom H are stretching symmetrically, moving inwards and then outwards, while the top H moves in opposite direction: outwards and then inwards. The B atom is forced to oscillate out of the plane. |
2715 | 126 | E' |
N.B.: None of the vibrations are negative which means that molecule was fully optimised. Also, frequencies and intensities were not reported with any significant figures as it is usually the case.
The IR spectrum was obtained, as shown here below.

Comparison with GaBr3 molecule
A frequency analysis was then carried out on GaBr3. To do so, the job was submitted to the scan HPC service and the completed BBr3 optimisation was then deposited in the chemical database D-space (DOI:10042/25223 ).
| File Type | .log |
| Calculation Type | FREQ |
| Calculation Method | RB3LYP |
| Basis set | LANDL2DZ |
| Final Energy (a.u.) | -41.70082783 |
| Gradient (a.u.) | 0.00000011 |
| Dipole Moment (Debye) | 0.0000 |
| Point Group | D3H |
| Time of calculation (s) | 16.5 |
As shown here below, forces and displacements have converged, meaning that the molecule was successfully optimised.
        Item               Value     Threshold  Converged?
Maximum Force            0.000000     0.000450     YES
RMS     Force            0.000000     0.000300     YES
Maximum Displacement     0.000002     0.001800     YES
RMS     Displacement     0.000001     0.001200     YES
Predicted change in Energy=-6.142863D-13
Optimization completed.
   -- Stationary point found.
Low frequencies --- -0.5252 -0.5247 -0.0024 -0.0010 0.0235 1.2010
Low frequencies --- 76.3744 76.3753 99.6982
Low frequencies are all very close to zero and within a range of +/- 15cm-1.
| No. | Form of the vibration | Frequency | Intensity | Symmetry (D3Hpoint group) | BH3 Corresponding Frequency |
| 1 |  |
76 | 3 | E' | 1213 |
| 2 |  |
76 | 3 | E' | 1213 |
| 3 |  |
100 | 9 | A2" | 1163 |
| 4 |  |
197 | 0 | A1' | 2582 |
| 5 |  |
316 | 57 | E' | 2715 |
| 6 |  |
316 | 57 | E' | 2715 |
N.B.: Similarly to BH3, none of GaBr3 vibrations are a negative number, meaning that molecule was fully optimised.
The lowest real normal mode is found at 76 cm-1.
- The IR spectra look similar for both molecules. As shown here below, like for BH3, GaBr3 IR spectrum possesses 3 main peaks, even though there are six vibrational modes. This is because there are two sets of degenerate E' vibrations (1213 and 2715 for BH3 and 76 and 316 for GaBr3)which possess the same intensity and hence overlap on the spectrum, as well as a totally symmetric A1' mode (2582 for BH3 and 197 for GaBr3) which cannot be observed on the spectrum as it does not involve a change in dipole moment.

- For both spectra, the A2" and E' modes lie fairly closely together, while the A1' and E' modes also lie close together but higher in energy. This is because the A2" and E' modes correspond bending modes while the A1' and E' to stretching modes, and, stretching modes require more energy than bending modes (wagging, scissoring and rocking)as the former affect the bond itself while the later only affect the bond angle. And in fact, the energy corresponding to that stretching mode is directly proportional to the bond dissociation energy.
- The main difference lies in the frequencies: as shown in the table, GaBr3 frequencies are much lower than BH3 ones. For a simple harmonic oscillator, the frequency v is directly proportional to the spring constant k and inversely proportional to the reduced mass µ: . This means that for a fixed spring constant, a larger reduced mass will lead to lower frequencies. Ga and Br are both heavier atoms than B and H atoms, therefore, GaBr3 possesses a much larger reduced mass than BH3 and hence lower vibrational modes.
- A reordering of the modes is also observed(for example: A2" corresponds to mode number 1 for BH3 while it corresponds to number 4 for GaBr3).
MOLECULAR ORBITALS OF BH3
This section illustrates the importance of carrying out such calculations. Indeed, solving the electronic structure enables us to obtain quantitative or approximate MOs, which can then be compared to the qualitative or approximate MOs produced via MO diagrams.
A population analysis was carried out by including in the "additional keywords" section "pop=full". The job was submitted to the scan HPC service and then deposited then deposited in the chemical database D-space (DOI:10042/25256 ).
| File Type | .log |
| Calculation Type | SP |
| Calculation Method | RB3LYP |
| Basis set | 6-31G(d,p) |
| Final Energy (a.u.) | -26.61532363 |
| Gradient (a.u.) | 0.00000235 |
| Dipole Moment (Debye) | 0.00 |
| Point Group | D3H |
| Time of calculation (s) | 6.4 |
The "real" MOs where then compared to the LCAOs MOs by producing a MO diagram as shown here.

The real and the LCAO MOs look alike, especially the bonding MOs as well as the LUMO; in fact, differences become siginficant for the anti-bonding MOs. The main difference between the "real" and the LCAO MOs is that the "real" MOs do not show electron density at specific atoms, but rather diffused accross the entire molecule. As a result, it does not show the relative contribution of each atom. This is clearly illustrated by the second bonding MO. Also, LCAO MOs clearly illustrate the presence of nodes as well as their location, which is not the case of the "real" MOs (this is especially true for the antibonding MOs which are even more diffuse than the bonding MOs).
This illustrates the accuracy and usefulness of the qualitative MO theory, compared to computational chemistry, which does not appear as valuable in providing a simple model of bonding in molecules.
NATURAL BOND ANALYSIS OF NH3
A natural bond analysis was carried out on NH3.
Optimisation
| Breaking the symmetry | Constraining the symmetry | |
|---|---|---|
| File Type | .log | .log |
| Calculation Type | FOPT | FOPT |
| Calculation Method | RB3LYP | RB3LYP |
| Basis set | 6-31G(d,p) | 6-31G(d,p) |
| Final Energy (a.u.) | -56.55776856 | -56.55776863 |
| Gradient (a.u.) | 0.00000885 | 0.00000289 |
| Dipole Moment (Debye) | 1.85 | 1.85 |
| Point Group | C1 | C3V |
| Time of calculation (s) | 27.0 | 34.0 |
The molecule was first optimised using a RB3LYP method and a 6-31G(d,p)basis set. The calculation were first carried out using the additional keyword "nosymm", which destroys the of the molecule, and hence allows us to find the lowest energy structure. This is particularly useful if the point group of the molecule is unknown. Calculation were then performed constraining the symmetry to the C3V point group. As shown in the table on the left, breaking the symmetry and constraining it give similar energy values (to two decimal places). Hence future calculations were made constraining symmetry.
As shown here below, forces and displacements have converged for both calculations, meaning that the molecule was successfully optimised.
Breaking the symmetry
        Item               Value     Threshold  Converged?
Maximum Force            0.000024     0.000450     YES
RMS     Force            0.000012     0.000300     YES
Maximum Displacement     0.000079     0.001800     YES
RMS     Displacement     0.000053     0.001200     YES
Predicted change in Energy=-1.629715D-09
Optimization completed.
   -- Stationary point found.
Constraining the symmetry
        Item               Value     Threshold  Converged?
Maximum Force            0.000005     0.000450     YES
RMS     Force            0.000003     0.000300     YES
Maximum Displacement     0.000010     0.001800     YES
RMS     Displacement     0.000007     0.001200     YES
Predicted change in Energy=-7.830248D-11
Optimization completed.
   -- Stationary point found.
Frequency analysis
A frequency analysis was carried out on NH3.
| File Type | .log |
| Calculation Type | FREQ |
| Calculation Method | RB3LYP |
| Basis set | 6-31G(d,p) |
| Final Energy (a.u.) | -56.55776863 |
| Gradient (a.u.) | 0.00000281 |
| Dipole Moment (Debye) | 1.85 |
| Point Group | C3V |
| Time of calculation (s) | 14.0 |
As shown here below, forces and displacements have converged, meaning that the molecule was fully optimised.
        Item               Value     Threshold  Converged?
Maximum Force            0.000005     0.000450     YES
RMS     Force            0.000003     0.000300     YES
Maximum Displacement     0.000011     0.001800     YES
RMS     Displacement     0.000006     0.001200     YES
Predicted change in Energy=-8.407566D-11
Optimization completed.
   -- Stationary point found.
Low frequencies ---  -11.6223  -11.5869   -0.0037    0.0243    0.1403   25.5604
Low frequencies --- 1089.6629 1694.1734 1694.1737
Low frequencies are all very close to zero and within a range of +/- 15cm-1.
| No. | Form of the vibration | Frequency | Intensity (taking into account the accuracy) | Symmetry (C3Vpoint group) |
| 1 |  |
1090 | 145 | A1 |
| 2 |  |
1694 | 14 | E |
| 3 |  |
1694 | 14 | E |
| 4 |  |
3461 | 14 | A1 |
| 5 |  |
3590 | 0 | E |
| 6 |  |
3590 | 0 | E |
The IR spectrum was also obtained, as shown here below:

MO analysis
A population analysis was carried out on NH3. The job was submitted to the scan HPC service and then deposited then deposited in the chemical database D-space (DOI:10042/25317 ).
| File Type | .log |
| Calculation Type | SP |
| Calculation Method | RB3LYP |
| Basis set | 6-31G(d,p) |
| Final Energy (a.u.) | -56.55776863 |
| Gradient (a.u.) | - |
| Dipole Moment (Debye) | 1.85 |
| Point Group | C3V |
| Time of calculation (s) | 16.3 |
NBO analysis

A NBO analysis was carried out on NH3, to obtain a NBO charge distribution, shown here below. The specific NBO charges for the nitrogen and hydrogen atoms are -1.125 and +0.375 respectively.
ASSOCIATION ENERGIES: Ammonia-Borane
To compute the association energy of ammonia borane (the reaction energy), we first need the energy of the reactants and products are required., and BH3 and NH3 energies were already calculated.
Optimisation of NH3BH3
| File Type | .log |
| Calculation Type | FOPT |
| Calculation Method | RB3LYP |
| Basis set | 6-31G(d,p) |
| Final Energy (a.u.) | -83.22469007 |
| Gradient (a.u.) | 0.00006839 |
| Dipole Moment (Debye) | 5.57 |
| Point Group | C1 |
| Time of calculation | 1 min 1 s |
As shown here below, forces and displacements have converged, meaning that the molecule was fully optimised.
        Item               Value     Threshold  Converged?
Maximum Force            0.000139     0.000450     YES
RMS     Force            0.000063     0.000300     YES
Maximum Displacement     0.000771     0.001800     YES
RMS     Displacement     0.000338     0.001200     YES
Predicted change in Energy=-2.028054D-07
Optimization completed.
   -- Stationary point found.
Frequency analysis of NH3BH3
A frequency analysis was carried out on NH3BH3. The job was submitted to the scan HPC service and then deposited then deposited in the chemical database D-space (DOI:10042/25296 ).
| File Type | .log |
| Calculation Type | FOPT |
| Calculation Method | RB3LYP |
| Basis set | 6-31G(d,p) |
| Final Energy (a.u.) | -83.22469000 |
| Gradient (a.u.) | 0.00006830 |
| Dipole Moment (Debye) | 5.57 |
| Point Group | C1 |
| Time of calculation | 1 min 5.1 s |
As shown here below, forces and displacements have converged, meaning that the molecule was fully optimised.
        Item               Value     Threshold  Converged?
Maximum Force            0.000127     0.000450     YES
RMS     Force            0.000068     0.000300     YES
Maximum Displacement     0.000837     0.001800     YES
RMS     Displacement     0.000548     0.001200     YES
Predicted change in Energy=-2.131402D-07
Optimization completed.
   -- Stationary point found.
Low frequencies ---   -0.0007   -0.0006    0.0005   18.9885   23.6408   42.9617
Low frequencies ---  266.5827  632.3776  639.4313
Low frequencies are all very close to zero and within a range of +/- 15cm-1.

Also, all 18 vibrational modes have positive frequencies, as shown in the table.
Calculation of the association energy of NH3BH3
The energies of the optimised NH3, BH3 and NH3BH3 molecules were tabulated, as showed here below.
| E(BH3) | -26.61532363 |
| E(NH3) | -56.55776856 |
| E(NH3BH3) | -83.22469007 |
| ΔE=E(NH3BH3)-[E(NH3)+ E(BH3)] | -0.05159788 |
The energy difference can then be converted in kj.mol-1, as follows: ΔE= -0.05159788 x 2625.50 = -135.475 kj.mol-1 (taking into account the accuracy), which is of the same order of magnitude as bond energies. Therefore, this result is reasonable.
REFERENCES
<references> [1] [2] [3] [4] [5]
- ↑ 1.0 1.1 B. Ruscic, C. A. Mayhew, and J. BerkowitzJ. Chem. Phys., 1988, 88
- ↑ 2.0 2.1 CRC Handbook of Chemistry and Physics, 2010
- ↑ 3.0 3.1 Shackelford, James F. et al, Materials Science and Engineering Handbook, Structure of Materials, CRC Press LLC,James F. Shackelford & W. Alexander edn., 2001
- ↑ 4.0 4.1 4.2 4.3 P. Atkins, T. Overton, J. Rourke, M. Weller, F. Amstrong, Inorganic Chemistry, Oxford University Press, 5th edn., 2010
- ↑ 5.0 5.1 P. Atkins, J. de Paula, Atkin's Physical Chemistry, Oxford University Press, 9th edn., 2010