Rep:Mod:M4nUtd
Study of Tri-coordinate Group 13 Compounds
Borane
Optimisation Using a 3-21G Basis Set
Borane was optimised using a 3-21G basis set (input file), the results of which are summarized in the table below (log file):
| File Type | .log |
| Calculation Type | FOPT |
| Calculation Method | RB3LYP |
| Basis Set | 3-21G |
| E(RB3LYP)/a.u. | -26.46 |
| RMS Gradient Norm/a.u. | 0.00008851 |
| Dipole Moment/D | 0.00 |
| Point Group | CS |
| Job cpu Time/s | 158 |
The optimisation is shown to converge by the minimal force and distance displacement, indicating an energy minimum for the molecule has been calculated:
         Item               Value     Threshold  Converged?
 Maximum Force            0.000220     0.000450     YES
 RMS     Force            0.000106     0.000300     YES
 Maximum Displacement     0.000709     0.001800     YES
 RMS     Displacement     0.000447     0.001200     YES
 Predicted change in Energy=-1.672478D-07
 Optimization completed.
    -- Stationary point found.
                           ----------------------------
                           !   Optimized Parameters   !
                           ! (Angstroms and Degrees)  !
 --------------------------                            --------------------------
 ! Name  Definition              Value          Derivative Info.                !
 --------------------------------------------------------------------------------
 ! R1    R(1,2)                  1.1947         -DE/DX =   -0.0002              !
 ! R2    R(1,3)                  1.1948         -DE/DX =   -0.0002              !
 ! R3    R(1,4)                  1.1944         -DE/DX =   -0.0001              !
 ! A1    A(2,1,3)              120.0157         -DE/DX =    0.0                 !
 ! A2    A(2,1,4)              119.9983         -DE/DX =    0.0                 !
 ! A3    A(3,1,4)              119.986          -DE/DX =    0.0                 !
 ! D1    D(2,1,4,3)            180.0            -DE/DX =    0.0                 !
 --------------------------------------------------------------------------------

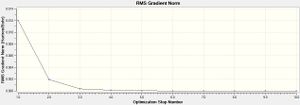
An energy minimum is also shown to be reached by the figures to the right and below. As the optimisation is carried out, the total energy of the molecule decreases with each structure generated as indicated by the figure on the right, whilst the figure below highlights that the optimisation continues until the gradient with respect to the change in position of the atoms in a molecule of borane is zero (the optimum structure of borane has been determined, acquiring optimised bond lengths).

Optimisation Using a 6-31G(d,p) Basis Set
Borane was optimised using a 6-31G(d,p) basis set (input file), the results of which are summarized in the table below (log file):
| File Type | .log |
| Calculation Type | FOPT |
| Calculation Method | RB3LYP |
| Basis Set | 6-31G(d,p) |
| E(RB3LYP)/a.u. | -26.62 |
| RMS Gradient Norm/a.u. | 0.00000707 |
| Dipole Moment/D | 0.00 |
| Point Group | CS |
| Job cpu Time/s | 48 |
As can be seen from the table below, the optimisation has converged to a minimum in the energy of the molecule:
         Item               Value     Threshold  Converged?
 Maximum Force            0.000012     0.000450     YES
 RMS     Force            0.000008     0.000300     YES
 Maximum Displacement     0.000061     0.001800     YES
 RMS     Displacement     0.000038     0.001200     YES
 Predicted change in Energy=-1.069855D-09
 Optimization completed.
    -- Stationary point found.
                           ----------------------------
                           !   Optimized Parameters   !
                           ! (Angstroms and Degrees)  !
 --------------------------                            --------------------------
 ! Name  Definition              Value          Derivative Info.                !
 --------------------------------------------------------------------------------
 ! R1    R(1,2)                  1.1923         -DE/DX =    0.0                 !
 ! R2    R(1,3)                  1.1923         -DE/DX =    0.0                 !
 ! R3    R(1,4)                  1.1923         -DE/DX =    0.0                 !
 ! A1    A(2,1,3)              120.0055         -DE/DX =    0.0                 !
 ! A2    A(2,1,4)              120.0007         -DE/DX =    0.0                 !
 ! A3    A(3,1,4)              119.9939         -DE/DX =    0.0                 !
 ! D1    D(2,1,4,3)            180.0            -DE/DX =    0.0                 !
 --------------------------------------------------------------------------------
The optimised B-H bond length was 1.19 Å. The optimised H-B-H bond angle was also calculated, at 120.0°.
Frequency Analysis
A frequency calculation was carried out on the borane optimised using a 6-21G(d,p) basis set (input file). The low frequencies are displayed below (log file):
Low frequencies ---  -24.8863  -13.2443   -0.0003    0.0001    0.0007   15.2167
Low frequencies --- 1162.9980 1213.0191 1213.1455
As can be seen above, the zero frequencies are smaller than the vibrational frequencies. However, the frequencies aren't within the range of -15 to 15 cm-1. Although the molecule has been optimised using a 6-31G(d,p) basis set, the symmetry of the molecule has not been constrained.
Therefore, the optimisation of borane using a 6-31G(d,p) basis set and with the symmetry constrained to D3h was carried out (input file). The results of the optimisation are summarized below (log file):
| File Type | .log |
| Calculation Type | FOPT |
| Calculation Method | RB3LYP |
| Basis Set | 6-31G(d,p) |
| E(RB3LYP)/a.u. | -26.62 |
| RMS Gradient Norm/a.u. | 0.00000296 |
| Dipole Moment/D | 0.00 |
| Point Group | D3H |
| Job cpu Time/s | 229 |
The molecule has been optimised, confirmed by the lack of force displacements as shown below:
         Item               Value     Threshold  Converged?
 Maximum Force            0.000006     0.000450     YES
 RMS     Force            0.000004     0.000300     YES
 Maximum Displacement     0.000023     0.001800     YES
 RMS     Displacement     0.000015     0.001200     YES
 Predicted change in Energy=-2.008834D-10
 Optimization completed.
    -- Stationary point found.
                           ----------------------------
                           !   Optimized Parameters   !
                           ! (Angstroms and Degrees)  !
 --------------------------                            --------------------------
 ! Name  Definition              Value          Derivative Info.                !
 --------------------------------------------------------------------------------
 ! R1    R(1,2)                  1.1923         -DE/DX =    0.0                 !
 ! R2    R(1,3)                  1.1923         -DE/DX =    0.0                 !
 ! R3    R(1,4)                  1.1923         -DE/DX =    0.0                 !
 ! A1    A(2,1,3)              120.0            -DE/DX =    0.0                 !
 ! A2    A(2,1,4)              120.0            -DE/DX =    0.0                 !
 ! A3    A(3,1,4)              120.0            -DE/DX =    0.0                 !
 ! D1    D(2,1,4,3)            180.0            -DE/DX =    0.0                 !
 --------------------------------------------------------------------------------
A frequency analysis was subsequently carried out (input file). The low frequencies are displayed below (log file):
Low frequencies ---   -0.9431   -0.8608   -0.0055    5.7478   11.7258   11.7637
Low frequencies --- 1162.9963 1213.1826 1213.1853
As can be seen above, the zero frequencies are smaller than the vibration frequencies. In addition, the zero frequencies are within the range of -15 to 15 cm-1, indicating the optimisation using a 6-31G(d,p) basis set and constraint of the molecule to D3h symmetry is a sufficient method.
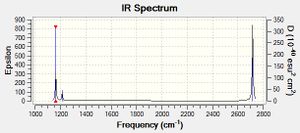
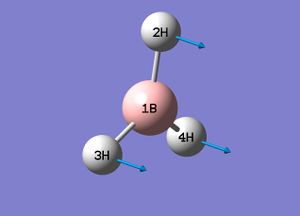
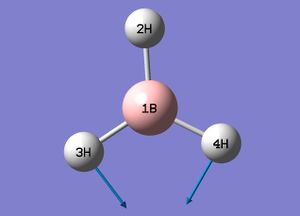
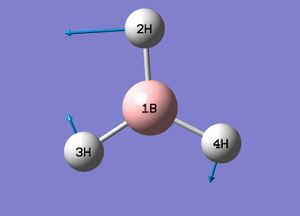
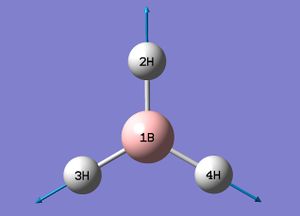
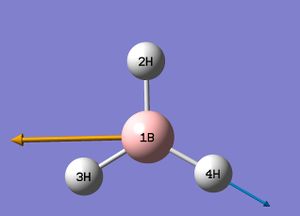
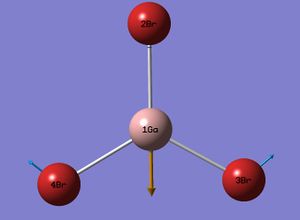
The vibrations of the optimised borane molecule display an intensity in the computed IR spectrum if the vibration results in a change in the overall dipole moment of the molecule. Therefore, the A1' symmetry vibration displays no intensity (and therefore does not result in a peak in the IR spectrum) as the vibration involves a symmetric stretch of all the hydrogen atoms within the molecule of borane, and so the overall dipole moment of the molecule remains unchanged. In addition, there are two pairs of vibrations which are very similar in frequency (i.e. vibration number 2 is very close in frequency to vibration number 3, and vibration numbers 5 and 6 are also very similar). Therefore, each pair of vibrations will appear as a single peak in the IR spectrum. The final peak in the IR spectrum is attributed to vibration number 1, and overall, despite six vibrations in a optimised molecule of borane constrained in symmetry calculated, only three peaks are seen in the computed IR spectrum, as shown to the right.
Optimised Borane Molecular Orbitals
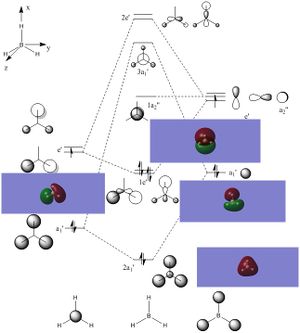
Using the optimised borane with a 6-31G(d,p) basis set and with constrained symmetry, the MOs of borane were calculated (input file, DOI:10042/26939 ). The occupied and LUMO MOs obtained (checkpoint file) were compared to those obtained via a linear combination of atomic orbitals approach from a molecular orbital diagram, as shown in the figure below. As can be seen from the diagram, the MOs that were calculated are very similar to the MOs obtained using an LCAO approach. There are minor differences, such as the contribution of individual atoms to the MO or the extent of delocalisation of the MO throughout the molecule and between atoms. However, these minor differences are the result of accurate optimisations, which cannot be sufficiently included in an qualitative LCAO approach. Therefore, overall, the qualitative LCAO approach to MO determination is a reliable approximation.
Gallium Tribromide
Optimisation Using a LanL2DZ Basis Set
Gallium tribromide was optimized using a LanL2DZ basis set (input file, DOI:10042/26893 ), the results of which are summarized below (log file):
| File Type | .log |
| Calculation Type | FOPT |
| Calculation Method | RB3LYP |
| Basis Set | LanL2DZ |
| E(RB3LYP)/a.u. | -41.70 |
| RMS Gradient Norm/a.u. | 0.00000016 |
| Dipole Moment/D | 0.00 |
| Point Group | D3H |
| Job cpu Time/s | 16 |
The optimisation converged to a minimum energy of the molecule, as shown below:
         Item               Value     Threshold  Converged?
 Maximum Force            0.000000     0.000450     YES
 RMS     Force            0.000000     0.000300     YES
 Maximum Displacement     0.000003     0.001800     YES
 RMS     Displacement     0.000002     0.001200     YES
 Predicted change in Energy=-1.282681D-12
 Optimization completed.
    -- Stationary point found.
                           ----------------------------
                           !   Optimized Parameters   !
                           ! (Angstroms and Degrees)  !
 --------------------------                            --------------------------
 ! Name  Definition              Value          Derivative Info.                !
 --------------------------------------------------------------------------------
 ! R1    R(1,2)                  2.3502         -DE/DX =    0.0                 !
 ! R2    R(1,3)                  2.3502         -DE/DX =    0.0                 !
 ! R3    R(1,4)                  2.3502         -DE/DX =    0.0                 !
 ! A1    A(2,1,3)              120.0            -DE/DX =    0.0                 !
 ! A2    A(2,1,4)              120.0            -DE/DX =    0.0                 !
 ! A3    A(3,1,4)              120.0            -DE/DX =    0.0                 !
 ! D1    D(2,1,4,3)            180.0            -DE/DX =    0.0                 !
 --------------------------------------------------------------------------------
The optimised Br-Ga-Br bond angle was found to be 120.0°, whilst the optimised Ga-Br bond length was calculated at 2.35 Å. This is a significant deviation from the literature reported Ga-Br bond length of 2.24 Å,[1] determined via electron diffraction of vapourized gallium tribromide (to ensure only monomeric gallium tribromide species were present, not dimeric). The decreased experimental bond length can be attributed to the electron deficient gallium centre in the monomeric structure, resulting in the donation of bromine lone pairs into the sp2 hybridised gallium vacant orthogonal p-orbital. The presence of a π interaction between bromine and gallium shortens the Ga-Br bond, which is not taken into account in the optimisation of the molecule.
Frequency Analysis
The vibrational frequencies of the optimised gallium tribromide molecule were computed (input file, DOI:10042/26936 ). The low frequencies are shown below (log file):
Low frequencies ---   -0.5252   -0.5247   -0.0024   -0.0010    0.0235    1.2011
Low frequencies ---   76.3744   76.3753   99.6982
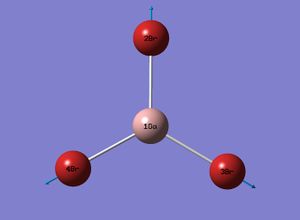
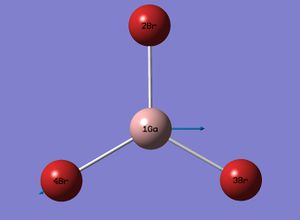
As indicated above, all zero frequencies are below the first vibration frequency (i.e. approximately 80 cm-1), and are also all very close to zero (an accurate LanL2DZ basis set has been employed). In addition, none of the vibration frequencies are below zero, indicating a global energy minimum has been achieved during the optimisation. All vibrational frequencies for the gallium tribromide molecule are summarized below:
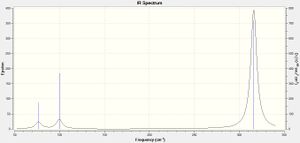
The IR spectrum of the optimised gallium tribromide is shown below.
Boron Tribromide
Boron tribromide was optimised using a 6-21G(d,p) basis set on the boron atom only, and LanL2DZ basis sets on all the bromine atoms (input file, DOI:10042/26896 ). The results are summarized below (log file):
| File Type | .log |
| Calculation Type | FOPT |
| Calculation Method | RB3LYP |
| Basis Set | Gen |
| E(RB3LYP)/a.u. | -64.44 |
| RMS Gradient Norm/a.u. | 0.00000974 |
| Dipole Moment/D | 0.00 |
| Point Group | CS |
| Job cpu Time/s | 21 |
The optimisation converged to a minimum energy, indicated by the lack of any force displacements below:
         Item               Value     Threshold  Converged?
 Maximum Force            0.000018     0.000450     YES
 RMS     Force            0.000010     0.000300     YES
 Maximum Displacement     0.000106     0.001800     YES
 RMS     Displacement     0.000061     0.001200     YES
 Predicted change in Energy=-2.171373D-09
 Optimization completed.
    -- Stationary point found.
                           ----------------------------
                           !   Optimized Parameters   !
                           ! (Angstroms and Degrees)  !
 --------------------------                            --------------------------
 ! Name  Definition              Value          Derivative Info.                !
 --------------------------------------------------------------------------------
 ! R1    R(1,2)                  1.9339         -DE/DX =    0.0                 !
 ! R2    R(1,3)                  1.934          -DE/DX =    0.0                 !
 ! R3    R(1,4)                  1.934          -DE/DX =    0.0                 !
 ! A1    A(2,1,3)              119.9974         -DE/DX =    0.0                 !
 ! A2    A(2,1,4)              120.0006         -DE/DX =    0.0                 !
 ! A3    A(3,1,4)              120.002          -DE/DX =    0.0                 !
 ! D1    D(2,1,4,3)            180.0            -DE/DX =    0.0                 !
 --------------------------------------------------------------------------------
The optimised bond lengths for boron tribromide is 1.93 Å. The optimised bond angle was calculated at 120.0°.
Comparison Between the Tri-coordinate Group 13 Compounds
Optimised Tri-Coordinate Group 13 Compounds
The optimised bond lengths for borane, boron tribromide and gallium tribromide are compared in the table below:
| Compound | Bond Length/Å |
|---|---|
| BH3 | 1.19 |
| BBr3 | 1.93 |
| GaBr3 | 2.35 |
As can be seen between borane and boron tribromide, increasing the size of the ligand (from hydrogen to bromine) increases the bond length, despite the higher electronegativity of bromine compared to hydrogen. In addition, the bromine sp3 orbital required to form a B-Br bond is larger and more diffuse than the hydrogen s orbital, and therefore the overlap with the boron sp2 hybridised orbital is weaker.
In addition, increasing the size of the central element (from boron to gallium) also increases the bond length. This is due to the lower electronegativity of gallium in comparison to boron (generally, the larger the element, the lower the electronegativity), and therefore, the gallium sp2 hybridised orbitals are larger and more diffuse compared to boron. Overall, the overlap with the bromine sp3 orbitals of gallium is weaker. Despite the increase in bond length between boron tribromide and gallium tribromide, both compounds contain a bond angle of 120.0°, and both central elements are sp2 hybridised with a vacant orthogonal p-orbital (i.e. both compounds contain an electron deficient central element). However, due to the higher electronegativity of boron compared to gallium, a bromine lone pair would experience better overlap with a boron vacant p-orbital rather than the gallium due to its large, diffuse orthogonal p-orbital. Therefore, a monomeric structure is adopted by the boron tribromide, rather than a dimeric structure (as adopted by the gallium tribromide).
Similarly, both boron tribromide and borane contain sp2 hybridised boron centres, with bond angles of 120.0°. However, borane is most stable as a dimer containing three-centre, two-electron bonds between the two boron centres and a central hydrogen atom, rather than as a monomer. This can be attributed to the lack of electron density and lone pairs by hydrogen compared to bromine, resulting in the inability to fill the vacant orthogonal boron p-orbital. The electron deficiency of the central boron is alleviated by dimerisation, but not via conventional two-centre, two-electron bonds. Therefore, diborane (and subsequently borane) exhibit a greater Lewis acidic character compared to boron tribromide.
Frequency Analysis of Tri-Coordinate Group 13 Compounds
The vibrational frequencies of borane and gallium tribromide are compared in the table below:
| Vibration Number | Borane Vibrational Frequencies/cm-1 | Gallium Tribromide Vibrational Frequencies/cm-1 |
|---|---|---|
| 1 | 1160 | 80 |
| 2 | 1210 | 80 |
| 3 | 1210 | 100 |
| 4 | 2580 | 200 |
| 5 | 2720 | 320 |
| 6 | 2720 | 320 |
The vibrational frequency is proportional to the force constant of a bond, which is a measure of the strength of the bond: the higher the vibrational frequency, the greater the force constant of the bond, and so the stronger the bond. As can be seen from the table above, borane displays significantly higher vibrational frequencies in comparison to gallium tribromide, and so the B-H bond in borane is stronger than the Ga-Br bond in gallium tribromide. This can be explained by the stronger overlap between the boron sp2 hybrid orbital and the hydrogen s orbital, compared to the weak overlap between the gallium sp2 hybrid orbital and the bromine sp3 orbital as they are larger and more diffuse.
In addition, the A2” symmetry vibration in borane is the lowest vibrational frequency for the molecule. On the other hand, the E' symmetry vibration is the lowest vibrational frequency for the optimised gallium tribromide. Vibrational frequency is proportional to energy as the higher the vibrational frequency, the stronger the bond and so the greater the energy. Therefore, the A2” symmetry vibration is the lowest energy vibration in borane, but not for gallium tribromide.
The IR spectra of both borane and gallium tribromide both contain three peaks each, with the most intense peak in both spectra the E' symmetry vibration with the highest vibrational frequency (and so energy). The other two peaks in both spectra are both considerably lower in intensity and vibrational frequency in comparison to the most intense one, yet both very similar in vibrational frequency to one another, with the A2” symmetry vibration for both compounds the next most intense (as it results in a lower change in the dipole moment of the molecule). Therefore, the E' symmetry vibrations with low vibrational frequencies in both compounds are the lowest intensity peaks in both IR spectra.
For both borane and gallium tribromide, the A2” symmetry vibration has a similar vibrational frequency to the two low vibrational frequency E' symmetry vibrations, and have a much lower vibrational frequency in comparison to the A1' symmetry vibration, possessing a similar vibrational frequency to the E' symmetry vibrations with high energy. This is because the A2” symmetry vibration and the low energy E' symmetry vibrations involve bending, scissoring and rocking of the molecule, with minimal change in the bond lengths; whereas the A1' symmetry vibration and the high vibrational frequency E' symmetry vibrations involve symmetric and asymmetric stretching of the bonds (elongation and compression), and are therefore much higher in energy as the atoms experience a higher amount of repulsion between one another.
Ammonia
Optimisation Using a 6-31G(d,p) Basis Set
Ammonia was optimised using a 6-21G(d,p) basis set (input file). The results are shown below (log file):
| File Type | .log |
| Calculation Type | FOPT |
| Calculation Method | RB3LYP |
| Basis Set | 6-31G(d,p) |
| E(RB3LYP)/a.u. | -56.56 |
| RMS Gradient Norm/a.u. | 0.00000289 |
| Dipole Moment/D | 1.85 |
| Point Group | C3V |
| Job cpu Time/s | 14 |
The optimisation had reached an energy minimum, as exemplified below:
         Item               Value     Threshold  Converged?
 Maximum Force            0.000005     0.000450     YES
 RMS     Force            0.000003     0.000300     YES
 Maximum Displacement     0.000010     0.001800     YES
 RMS     Displacement     0.000007     0.001200     YES
 Predicted change in Energy=-7.830781D-11
 Optimization completed.
    -- Stationary point found.
                           ----------------------------
                           !   Optimized Parameters   !
                           ! (Angstroms and Degrees)  !
 --------------------------                            --------------------------
 ! Name  Definition              Value          Derivative Info.                !
 --------------------------------------------------------------------------------
 ! R1    R(1,2)                  1.018          -DE/DX =    0.0                 !
 ! R2    R(1,3)                  1.018          -DE/DX =    0.0                 !
 ! R3    R(1,4)                  1.018          -DE/DX =    0.0                 !
 ! A1    A(2,1,3)              105.7463         -DE/DX =    0.0                 !
 ! A2    A(2,1,4)              105.7463         -DE/DX =    0.0                 !
 ! A3    A(3,1,4)              105.7463         -DE/DX =    0.0                 !
 ! D1    D(2,1,4,3)           -111.867          -DE/DX =    0.0                 !
 --------------------------------------------------------------------------------
Frequency Analysis of Ammonia
Using the optimised ammonia, a frequency analysis of ammonia (input file) was carried out (log file). The low frequencies are shown below:
Low frequencies ---  -11.6527  -11.6490   -0.0042    0.0333    0.1312   25.5724
Low frequencies --- 1089.6616 1694.1736 1694.1736
As can be seen from the low frequencies above, they are outside of the range of -15 to 15 cm-1. Therefore, the optimisation method and basis set employed are inaccurate due to the lack of constraint of the molecule to its C3v point group. The optimisation of ammonia using a 6-31G(d,p) basis set was recalculated, yet with constraint of symmetry (input file). The results of the optimisation are summarized below (log file):
| File Type | .log |
| Calculation Type | FOPT |
| Calculation Method | RB3LYP |
| Basis Set | 6-31G(d,p) |
| E(RB3LYP)/a.u. | -56.56 |
| RMS Gradient Norm/a.u. | 0.00000045 |
| Dipole Moment/D | 1.85 |
| Point Group | C3V |
| Job cpu Time/s | 19 |
As shown below, the optimisation of ammonia with constraint of symmetry converged to a energy minimum:
         Item               Value     Threshold  Converged?
 Maximum Force            0.000001     0.000002     YES
 RMS     Force            0.000001     0.000001     YES
 Maximum Displacement     0.000002     0.000006     YES
 RMS     Displacement     0.000001     0.000004     YES
 Predicted change in Energy=-2.358803D-12
 Optimization completed.
    -- Stationary point found.
                           ----------------------------
                           !   Optimized Parameters   !
                           ! (Angstroms and Degrees)  !
 --------------------------                            --------------------------
 ! Name  Definition              Value          Derivative Info.                !
 --------------------------------------------------------------------------------
 ! R1    R(1,2)                  1.018          -DE/DX =    0.0                 !
 ! R2    R(1,3)                  1.018          -DE/DX =    0.0                 !
 ! R3    R(1,4)                  1.018          -DE/DX =    0.0                 !
 ! A1    A(2,1,3)              105.7445         -DE/DX =    0.0                 !
 ! A2    A(2,1,4)              105.7445         -DE/DX =    0.0                 !
 ! A3    A(3,1,4)              105.7445         -DE/DX =    0.0                 !
 ! D1    D(2,1,4,3)           -111.8635         -DE/DX =    0.0                 !
 --------------------------------------------------------------------------------
Subsequently, a frequency analysis of ammonia was carried out (input file). The low frequencies are shown below (log file):
Low frequencies ---   -4.3274   -0.8327   -0.8296   -0.0013    0.0197    0.0249
Low frequencies --- 1089.3663 1693.9295 1693.9296
As can be seen above, the zero frequencies are lower than the vibrational frequencies, indicating the calculation predominantly focused on the N-H bond vibrations, with small movements in the centre of mass of the molecule (which are not required). The low frequencies are also within the range of -15 to 15 cm-1, confirming that the optimisation of ammonia using a 6-31G(d,p) basis set with constraint of symmetry is an accurate method. Finally, the lack of any vibrational frequencies below zero indicates that the optimisation converged to a global energy minimum, not a local energy minimum.
Optimised Ammonia MO Analysis
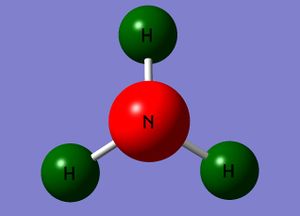
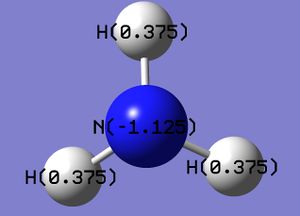
An MO analysis of ammonia was carried out using the optimised ammonia (input file, DOI:10042/26981 ). The charge distribution for ammonia is shown on the right (checkpoint file), with a charge range of -1.125 to 1.125. As expected, the central nitrogen atom has a high charge density, whereas all the hydrogen atoms exhibit a low charge density. The specific charges in ammonia associated with all the atoms in the molecule is also shown below.
Ammonia-Borane
Optimisation
Ammonia-borane was optimised using a 6-31G(d,p) basis set and constrained in symmetry (input file). A summary of the results obtained from the optimisation is shown below (log file):
| File Type | .log |
| Calculation Type | FOPT |
| Calculation Method | RB3LYP |
| Basis Set | 6-31G(d,p) |
| E(RB3LYP)/a.u. | -83.22 |
| RMS Gradient Norm/a.u. | 0.00000028 |
| Dipole Moment/D | 5.56 |
| Point Group | C1 |
| Job cpu Time/s | 103 |
The lack of distance displacements, as shown below, indicates the optimisation converged to an energy minimum:
         Item               Value     Threshold  Converged?
 Maximum Force            0.000001     0.000002     YES
 RMS     Force            0.000000     0.000001     YES
 Maximum Displacement     0.000004     0.000006     YES
 RMS     Displacement     0.000002     0.000004     YES
 Predicted change in Energy=-3.538280D-12
 Optimization completed.
    -- Stationary point found.
                           ----------------------------
                           !   Optimized Parameters   !
                           ! (Angstroms and Degrees)  !
 --------------------------                            --------------------------
 ! Name  Definition              Value          Derivative Info.                !
 --------------------------------------------------------------------------------
 ! R1    R(1,7)                  1.0185         -DE/DX =    0.0                 !
 ! R2    R(2,7)                  1.0185         -DE/DX =    0.0                 !
 ! R3    R(3,7)                  1.0185         -DE/DX =    0.0                 !
 ! R4    R(4,8)                  1.2098         -DE/DX =    0.0                 !
 ! R5    R(5,8)                  1.2098         -DE/DX =    0.0                 !
 ! R6    R(6,8)                  1.2098         -DE/DX =    0.0                 !
 ! R7    R(7,8)                  1.6677         -DE/DX =    0.0                 !
 ! A1    A(1,7,2)              107.8759         -DE/DX =    0.0                 !
 ! A2    A(1,7,3)              107.8759         -DE/DX =    0.0                 !
 ! A3    A(1,7,8)              111.023          -DE/DX =    0.0                 !
 ! A4    A(2,7,3)              107.8759         -DE/DX =    0.0                 !
 ! A5    A(2,7,8)              111.023          -DE/DX =    0.0                 !
 ! A6    A(3,7,8)              111.0229         -DE/DX =    0.0                 !
 ! A7    A(4,8,5)              113.8738         -DE/DX =    0.0                 !
 ! A8    A(4,8,6)              113.8737         -DE/DX =    0.0                 !
 ! A9    A(4,8,7)              104.5974         -DE/DX =    0.0                 !
 ! A10   A(5,8,6)              113.8739         -DE/DX =    0.0                 !
 ! A11   A(5,8,7)              104.5975         -DE/DX =    0.0                 !
 ! A12   A(6,8,7)              104.5976         -DE/DX =    0.0                 !
 ! D1    D(1,7,8,4)            179.9998         -DE/DX =    0.0                 !
 ! D2    D(1,7,8,5)            -60.0002         -DE/DX =    0.0                 !
 ! D3    D(1,7,8,6)             59.9998         -DE/DX =    0.0                 !
 ! D4    D(2,7,8,4)            -60.0002         -DE/DX =    0.0                 !
 ! D5    D(2,7,8,5)             59.9998         -DE/DX =    0.0                 !
 ! D6    D(2,7,8,6)            179.9999         -DE/DX =    0.0                 !
 ! D7    D(3,7,8,4)             59.9998         -DE/DX =    0.0                 !
 ! D8    D(3,7,8,5)            179.9998         -DE/DX =    0.0                 !
 ! D9    D(3,7,8,6)            -60.0002         -DE/DX =    0.0                 !
 --------------------------------------------------------------------------------
Frequency Analysis of Ammonia-Borane
A frequency analysis of ammonia-borane was carried out(input file). The low frequencies are shown below (log file):
Low frequencies ---   -3.2878   -0.0004    0.0009    0.0010    2.6428    4.8530
Low frequencies ---  263.4457  632.9789  638.4396
As can be seen from the low frequencies above, the zero frequencies are lower than the vibrational frequencies, indicating the calculation focused on the motion of the bonds between atoms predominantly. In addition, the low frequencies are within the range of -15 to 15 cm-1, indicating the optimisation of ammonia-borane using a 6-31G(d,p) basis set and with constraint of symmetry is accurate. Finally, the vibrational frequencies are not below zero, confirming the optimisation achieved a global energy minimum of the molecule, not a local energy minimum.
Thermodynamics of Ammonia-Borane in Comparison to Ammonia and Borane
Ammonia-borane is the combination of a molecule of ammonia with a molecule of borane. Therefore, the energy of interaction between ammonia and borane in ammonia-borane is equivalent to the energy difference between a molecule of ammonia-borane and the sum of the energies of a molecule of ammonia and a molecule of borane, where both molecules have been optimised using a 6-31G(d,p) basis set with constraints of symmetry to ensure the optimised global energy minima of all molecules are comparable. The energy difference between a molecule of ammonia-borane and the combined energies of a molecule each of ammonia and borane is -0.05 a.u., which is equivalent to -135.47 kJmol-1. The interaction energy between a molecule of ammonia and a molecule of borane to form a molecule of ammonia-borane is favourable. Therefore, the energy of dissociation of ammonia-borane into individual molecules of ammonia and borane is 135.47 kJmol-1.
A Note About GaussView
A bond is an attraction between electrons and the nuclei of two or more atoms. Occasionally, in optimisation intermediate structures of molecules, bonds are omitted between atoms, which may be construed as a lack of interaction between the atoms and the electrons supposedly involved.
However, this is not true, as Gaussian adopts the Schrödinger equation in order to find the optimum distance between atoms involving an attraction between the nuclei and the electrons, and defines that as a bond. What is not taken into account is that the attraction between atoms is distant dependent, i.e. r-6, where r is the distance between atoms. This term is taken from the Lennard-Jones potential, indicating that an attraction between electrons and nuclei of atoms (i.e. a bond) occurs at a larger distance than the optimum. Therefore, a bond is formed between atoms before Gaussian calculates an effective overlap between the wavefunctions involved, resulting in the lack of a bond shown between the atoms in GaussView.
The optimisation obtains an energy minimum for the molecule via bond distance displacements, whereas the vibrational analysis calculates the vibrational frequencies of the molecule at a certain energy and containing specific bond lengths (therefore allowing the determination of the relative strength of the bonds via force constants, as well as determining whether a local or global energy minimum has been obtained). If a different method and basis set is applied to the vibrational analysis in comparison to the optimisation, the vibrational frequencies obtained would not apply to the same energy minimum and bond distances for the molecule as the optimisation calculated. In addition, the accuracy between the optimisation and the vibrational analysis would be different, and therefore not applicable to each other.
A frequency analysis determines whether a global energy minimum or local energy minimum for the molecule has been obtained from the optimisation (as well as obtaining the IR vibrational frequencies and intensities of the molecule, which can provide a relative indicator of bond strength, and indicating the vibrations in the molecule associated with each vibrational frequency calculated and the vibrational symmeteries).
The low frequencies indicate the vibrational frequency of the centre of mass of the molecule in comparison to the vibrational frequencies of the bonds in the molecule (which can be measured experimentally by IR spectroscopy, and compared to computational calculations obtained). In addition, the low frequencies indicate the accuracy of the applied method and basis set.
Ionic Liquids: Designer Solvents
Introduction
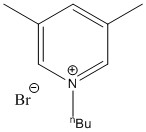
Ionic liquids are liquids composed solely of ions. Considering the expected high melting point of ionic compounds (such as metal salts) due to the strong, favourable interaction between oppositely-charged ions held in a lattice structure, forming ionic liquids at room temperature (for practical use such as solvents or reagents themselves) appears as if unusual, impractical conditions would be required (such as low pressures); however, some ionic compounds have been discovered to display unusually low melting points, even so far as some to be found as ionic liquids at room temperature! For example, the 1-butyl-3,5-dimethylpyridinium bromide compound,[2] shown on the right, was discovered in 2005 and possesses a melting point of -24°C.
Currently, ionic liquid research is focused on the various potential combinations between large, delocalised cations and anions to form ionic liquids, and their possible uses both inside and out of the laboratory. However, it is impossible (and expensive) to synthesize and investigate the properties of all combinations, and hence computational methods are employed to ascertain which combinations of cations and anions are suitable for use as ionic liquids and their potential applications. Here, some cations are investigated for their potential use in ionic liquids.
Onium Cations
Optimisation of Onium Cations
Optimisation of all three onium cations was carried out using a 6-31G(d,p) basis set and with constraint of symmetry to obtain accurate optimised structures and energy minima. The results for all three onium cations are summarized in the table below:
| Cation | [NMe4]+ | [PMe4]+ | [SMe3]+ |
|---|---|---|---|
| Input file | [NMe4]+ input | [PMe4]+ input | [SMe3]+ input |
| Log file | [NMe4]+ log | [PMe4]+ log | [SMe3]+ log |
| Optimisation Link | DOI:10042/27062 | DOI:10042/27063 | DOI:10042/27060 |
| File Type | .log | .log | .log |
| Calculation Type | FOPT | FOPT | FOPT |
| Calculation Method | - | - | - |
| Basis Set | - | - | - |
| Energy/a.u. | -214.18 | -500.83 | -517.68 |
| RMS Gradient/a.u. | 0.00000314 | 0.00000917 | 0.00000545 |
| Dipole Moment/D | 0.00 | 0.00 | 0.97 |
| Point Group | C1 | C1 | C1 |
| Job CPU Time/hrs:mins:s | 02:12:21 | 02:16:48 | 00:47:57 |
Irregularities in the results obtained from the optimistions are further confirmed by the lack of convergence in the bond distance displacements, as indicated below for [NMe4]+, but equally similar for the other onium cations optimised:
         Item               Value     Threshold  Converged?
 Maximum Force            0.000007     0.000002     NO
 RMS     Force            0.000002     0.000001     NO
 Maximum Displacement     0.001188     0.000006     NO
 RMS     Displacement     0.000451     0.000004     NO
 Predicted change in Energy=-7.368688D-09
 Optimization stopped.
    -- Number of steps exceeded,  NStep=  92
    -- Flag reset to prevent archiving.
                           ----------------------------
                           ! Non-Optimized Parameters !
                           ! (Angstroms and Degrees)  !
 --------------------------                            --------------------------
 ! Name  Definition              Value          Derivative Info.                !
 --------------------------------------------------------------------------------
 ! R1    R(1,2)                  1.5095         -DE/DX =    0.0                 !
 ! R2    R(1,6)                  1.5092         -DE/DX =    0.0                 !
 ! R3    R(1,10)                 1.5092         -DE/DX =    0.0                 !
 ! R4    R(1,14)                 1.5095         -DE/DX =    0.0                 !
 ! R5    R(2,3)                  1.0903         -DE/DX =    0.0                 !
 ! R6    R(2,4)                  1.0902         -DE/DX =    0.0                 !
 ! R7    R(2,5)                  1.0902         -DE/DX =    0.0                 !
 ! R8    R(6,7)                  1.0902         -DE/DX =    0.0                 !
 ! R9    R(6,8)                  1.0903         -DE/DX =    0.0                 !
 ! R10   R(6,9)                  1.0902         -DE/DX =    0.0                 !
 ! R11   R(10,11)                1.0902         -DE/DX =    0.0                 !
 ! R12   R(10,12)                1.0901         -DE/DX =    0.0                 !
 ! R13   R(10,13)                1.0901         -DE/DX =    0.0                 !
 ! R14   R(14,15)                1.0902         -DE/DX =    0.0                 !
 ! R15   R(14,16)                1.0901         -DE/DX =    0.0                 !
 ! R16   R(14,17)                1.0903         -DE/DX =    0.0                 !
 ! A1    A(2,1,6)              109.4694         -DE/DX =    0.0                 !
 ! A2    A(2,1,10)             109.4607         -DE/DX =    0.0                 !
 ! A3    A(2,1,14)             109.4891         -DE/DX =    0.0                 !
 ! A4    A(6,1,10)             109.4785         -DE/DX =    0.0                 !
 ! A5    A(6,1,14)             109.4701         -DE/DX =    0.0                 !
 ! A6    A(10,1,14)            109.4595         -DE/DX =    0.0                 !
 ! A7    A(1,2,3)              108.8731         -DE/DX =    0.0                 !
 ! A8    A(1,2,4)              108.8901         -DE/DX =    0.0                 !
 ! A9    A(1,2,5)              108.8904         -DE/DX =    0.0                 !
 ! A10   A(3,2,4)              110.0541         -DE/DX =    0.0                 !
 ! A11   A(3,2,5)              110.0357         -DE/DX =    0.0                 !
 ! A12   A(4,2,5)              110.0647         -DE/DX =    0.0                 !
 ! A13   A(1,6,7)              108.8883         -DE/DX =    0.0                 !
 ! A14   A(1,6,8)              108.8747         -DE/DX =    0.0                 !
 ! A15   A(1,6,9)              108.8716         -DE/DX =    0.0                 !
 ! A16   A(7,6,8)              110.0749         -DE/DX =    0.0                 !
 ! A17   A(7,6,9)              110.0658         -DE/DX =    0.0                 !
 ! A18   A(8,6,9)              110.0324         -DE/DX =    0.0                 !
 ! A19   A(1,10,11)            108.8982         -DE/DX =    0.0                 !
 ! A20   A(1,10,12)            108.9068         -DE/DX =    0.0                 !
 ! A21   A(1,10,13)            108.8796         -DE/DX =    0.0                 !
 ! A22   A(11,10,12)           110.0353         -DE/DX =    0.0                 !
 ! A23   A(11,10,13)           110.0412         -DE/DX =    0.0                 !
 ! A24   A(12,10,13)           110.0476         -DE/DX =    0.0                 !
 ! A25   A(1,14,15)            108.8954         -DE/DX =    0.0                 !
 ! A26   A(1,14,16)            108.8794         -DE/DX =    0.0                 !
 ! A27   A(1,14,17)            108.8834         -DE/DX =    0.0                 !
 ! A28   A(15,14,16)           110.0468         -DE/DX =    0.0                 !
 ! A29   A(15,14,17)           110.0523         -DE/DX =    0.0                 !
 ! A30   A(16,14,17)           110.0509         -DE/DX =    0.0                 !
 ! D1    D(6,1,2,3)            -60.0071         -DE/DX =    0.0                 !
 ! D2    D(6,1,2,4)             59.9926         -DE/DX =    0.0                 !
 ! D3    D(6,1,2,5)           -179.9846         -DE/DX =    0.0                 !
 ! D4    D(10,1,2,3)            59.9943         -DE/DX =    0.0                 !
 ! D5    D(10,1,2,4)           179.994          -DE/DX =    0.0                 !
 ! D6    D(10,1,2,5)           -59.9833         -DE/DX =    0.0                 !
 ! D7    D(14,1,2,3)           179.9844         -DE/DX =    0.0                 !
 ! D8    D(14,1,2,4)           -60.0159         -DE/DX =    0.0                 !
 ! D9    D(14,1,2,5)            60.0069         -DE/DX =    0.0                 !
 ! D10   D(2,1,6,7)             60.0107         -DE/DX =    0.0                 !
 ! D11   D(2,1,6,8)           -179.9646         -DE/DX =    0.0                 !
 ! D12   D(2,1,6,9)            -60.0012         -DE/DX =    0.0                 !
 ! D13   D(10,1,6,7)           -59.9798         -DE/DX =    0.0                 !
 ! D14   D(10,1,6,8)            60.0449         -DE/DX =    0.0                 !
 ! D15   D(10,1,6,9)          -179.9917         -DE/DX =    0.0                 !
 ! D16   D(14,1,6,7)          -179.9692         -DE/DX =    0.0                 !
 ! D17   D(14,1,6,8)           -59.9445         -DE/DX =    0.0                 !
 ! D18   D(14,1,6,9)            60.0189         -DE/DX =    0.0                 !
 ! D19   D(2,1,10,11)           59.9684         -DE/DX =    0.0                 !
 ! D20   D(2,1,10,12)          179.9701         -DE/DX =    0.0                 !
 ! D21   D(2,1,10,13)          -60.0243         -DE/DX =    0.0                 !
 ! D22   D(6,1,10,11)          179.9642         -DE/DX =    0.0                 !
 ! D23   D(6,1,10,12)          -60.0341         -DE/DX =    0.0                 !
 ! D24   D(6,1,10,13)           59.9715         -DE/DX =    0.0                 !
 ! D25   D(14,1,10,11)         -60.0399         -DE/DX =    0.0                 !
 ! D26   D(14,1,10,12)          59.9618         -DE/DX =    0.0                 !
 ! D27   D(14,1,10,13)         179.9674         -DE/DX =    0.0                 !
 ! D28   D(2,1,14,15)           60.0031         -DE/DX =    0.0                 !
 ! D29   D(2,1,14,16)         -179.9991         -DE/DX =    0.0                 !
 ! D30   D(2,1,14,17)          -60.0036         -DE/DX =    0.0                 !
 ! D31   D(6,1,14,15)          -60.0049         -DE/DX =    0.0                 !
 ! D32   D(6,1,14,16)           59.9928         -DE/DX =    0.0                 !
 ! D33   D(6,1,14,17)          179.9883         -DE/DX =    0.0                 !
 ! D34   D(10,1,14,15)         179.994          -DE/DX =    0.0                 !
 ! D35   D(10,1,14,16)         -60.0082         -DE/DX =    0.0                 !
 ! D36   D(10,1,14,17)          59.9873         -DE/DX =    0.0                 !
 --------------------------------------------------------------------------------
The most irregular characteristic optimised is the symmetry: the symmetrical tetrahedral Td point group is expected for the onium cations [NMe4]+ and [PMe4]+, whereas [SMe3]+ cation is expected to belong to the C3v point group. Therefore, taking this irregularity into account in particular, the optimisations of all onium cations using a 6-31G(d,p) basis set were repeated, but without any constraints in symmetry. The results for the optimisations without constraints in symmetry are summarized in the table below:
| Cation | [NMe4]+ | [PMe4]+ | [SMe3]+ |
|---|---|---|---|
| Input file | [NMe4]+ input | [PMe4]+ input | [SMe3]+ input |
| Log file | [NMe4]+ log | [PMe4]+ log | [SMe3]+ log |
| Optimisation Link | DOI:10042/27066 | DOI:10042/27065 | DOI:10042/27064 |
| File Type | .log | .log | .log |
| Calculation Type | FOPT | FOPT | FOPT |
| Calculation Method | RB3LYP | RB3LYP | RB3LYP |
| Basis Set | 6-31G(d,p) | 6-31G(d,p) | 6-31G(d,p) |
| Energy/a.u. | -214.18 | -500.83 | -517.68 |
| RMS Gradient/a.u. | 0.00004184 | 0.00005797 | 0.00004684 |
| Dipole Moment/D | 0.00 | 0.00 | 0.97 |
| Point Group | C1 | C1 | C1 |
| Job CPU Time/s | 405 | 448 | 211 |
There has been a reduction in the number of irregularities during optimisation of the onium cations without constraint in symmetry, yet the symmetry of the cations still cannot converge to the expected point groups. However, the low distance displacements of the cations indicate a convergence to an energy minimum for all the onium cations, as exemplified by [SMe3]+ below:
         Item               Value     Threshold  Converged?
 Maximum Force            0.000128     0.000450     YES
 RMS     Force            0.000034     0.000300     YES
 Maximum Displacement     0.001321     0.001800     YES
 RMS     Displacement     0.000537     0.001200     YES
 Predicted change in Energy=-9.609874D-08
 Optimization completed.
    -- Stationary point found.
                           ----------------------------
                           !   Optimized Parameters   !
                           ! (Angstroms and Degrees)  !
 --------------------------                            --------------------------
 ! Name  Definition              Value          Derivative Info.                !
 --------------------------------------------------------------------------------
 ! R1    R(1,2)                  1.8231         -DE/DX =   -0.0001              !
 ! R2    R(1,6)                  1.8227         -DE/DX =   -0.0001              !
 ! R3    R(1,10)                 1.8226         -DE/DX =    0.0001              !
 ! R4    R(2,3)                  1.0916         -DE/DX =    0.0                 !
 ! R5    R(2,4)                  1.0916         -DE/DX =    0.0                 !
 ! R6    R(2,5)                  1.0915         -DE/DX =    0.0                 !
 ! R7    R(6,7)                  1.0916         -DE/DX =    0.0                 !
 ! R8    R(6,8)                  1.0916         -DE/DX =    0.0                 !
 ! R9    R(6,9)                  1.0914         -DE/DX =    0.0                 !
 ! R10   R(10,11)                1.0915         -DE/DX =    0.0                 !
 ! R11   R(10,12)                1.0916         -DE/DX =    0.0                 !
 ! R12   R(10,13)                1.0914         -DE/DX =   -0.0001              !
 ! A1    A(2,1,6)              102.7548         -DE/DX =    0.0                 !
 ! A2    A(2,1,10)             102.749          -DE/DX =    0.0                 !
 ! A3    A(6,1,10)             102.7959         -DE/DX =    0.0                 !
 ! A4    A(1,2,3)              107.2551         -DE/DX =    0.0                 !
 ! A5    A(1,2,4)              107.244          -DE/DX =    0.0                 !
 ! A6    A(1,2,5)              110.5863         -DE/DX =    0.0                 !
 ! A7    A(3,2,4)              109.4436         -DE/DX =    0.0                 !
 ! A8    A(3,2,5)              111.0881         -DE/DX =    0.0                 !
 ! A9    A(4,2,5)              111.0747         -DE/DX =    0.0                 !
 ! A10   A(1,6,7)              107.2719         -DE/DX =   -0.0001              !
 ! A11   A(1,6,8)              107.228          -DE/DX =    0.0                 !
 ! A12   A(1,6,9)              110.5678         -DE/DX =    0.0                 !
 ! A13   A(7,6,8)              109.4508         -DE/DX =    0.0                 !
 ! A14   A(7,6,9)              111.0936         -DE/DX =    0.0                 !
 ! A15   A(8,6,9)              111.0795         -DE/DX =    0.0                 !
 ! A16   A(1,10,11)            107.24           -DE/DX =    0.0                 !
 ! A17   A(1,10,12)            107.246          -DE/DX =    0.0                 !
 ! A18   A(1,10,13)            110.5434         -DE/DX =    0.0001              !
 ! A19   A(11,10,12)           109.4517         -DE/DX =    0.0                 !
 ! A20   A(11,10,13)           111.1076         -DE/DX =    0.0                 !
 ! A21   A(12,10,13)           111.1013         -DE/DX =    0.0                 !
 ! D1    D(6,1,2,3)             68.104          -DE/DX =    0.0                 !
 ! D2    D(6,1,2,4)           -174.4197         -DE/DX =    0.0                 !
 ! D3    D(6,1,2,5)            -53.1695         -DE/DX =    0.0                 !
 ! D4    D(10,1,2,3)           174.6054         -DE/DX =    0.0                 !
 ! D5    D(10,1,2,4)           -67.9183         -DE/DX =    0.0                 !
 ! D6    D(10,1,2,5)            53.3319         -DE/DX =    0.0                 !
 ! D7    D(2,1,6,7)            174.5326         -DE/DX =    0.0                 !
 ! D8    D(2,1,6,8)            -67.9822         -DE/DX =    0.0                 !
 ! D9    D(2,1,6,9)             53.2528         -DE/DX =    0.0                 !
 ! D10   D(10,1,6,7)            68.0671         -DE/DX =    0.0                 !
 ! D11   D(10,1,6,8)          -174.4477         -DE/DX =    0.0                 !
 ! D12   D(10,1,6,9)           -53.2127         -DE/DX =    0.0                 !
 ! D13   D(2,1,10,11)           68.0699         -DE/DX =    0.0                 !
 ! D14   D(2,1,10,12)         -174.451          -DE/DX =    0.0                 !
 ! D15   D(2,1,10,13)          -53.1925         -DE/DX =    0.0                 !
 ! D16   D(6,1,10,11)          174.5398         -DE/DX =    0.0                 !
 ! D17   D(6,1,10,12)          -67.9811         -DE/DX =    0.0                 !
 ! D18   D(6,1,10,13)           53.2774         -DE/DX =    0.0                 !
 --------------------------------------------------------------------------------

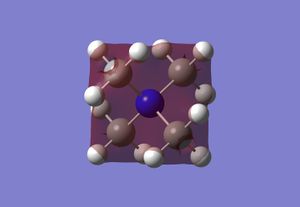
Similar distance displacements for the [NMe4]+ and [PMe4]+ cations also show a convergence to an energy minimum, indicating an optimised structure for all the oniumm cations has been calculated (despite the unusual symmetry point groups assigned for each cation). In addition, all the optimisations of all the onium cations converged within eight steps, as indicated by the figure to the right and below showing the convergence of energy for [PMe4]+ after eight steps and the lack of an effect on the total energy of the structure with a change in the bond distances (i.e. minimisation in energy) respectively.

Frequency Analysis of the Onium Cations
A frequency analysis was calculated for all the onium cations, indicating a reliable basis set has been employed for all the onium cations as all the zero frequencies are below the bond vibrational frequencies. An example of the similar low frequencies obtained for all three onium cations is shown below for [PMe4]+ in particular:
Low frequencies ---  -26.4609   -0.0044   -0.0039   -0.0024    3.2558    5.7791
Low frequencies ---  150.8138  185.4229  189.3062
However, the accuracy of the basis set employed for the optimisation of the onium cations is lower than idealized, as none of the zero frequencies are within the range of -15 to 15 cm-1, exemplified above for [PMe4]+. This may be due to the cationic charge not fully taken into account of by the diffuse basis set, which requires a smaller, polarized basis set instead, especially with the inclusion of electronegative atoms. However, the basis set utilized is sufficiently accurate for the analysis of the optimisation of the onium cations. The IR spectra for all three onium cations is shown below:
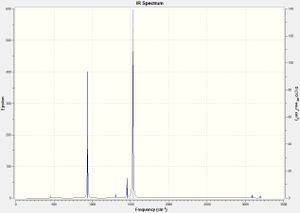
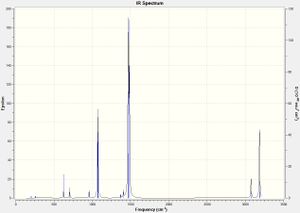

As can be seen from the IR spectra above, no vibrational frequencies are below zero, indicating that all three onium cations optimised to global minima.
| Cation | [NMe4]+ | [PMe4]+ | [SMe3]+ |
|---|---|---|---|
| Input File | [NMe4]+ input file | [PMe4]+ input file | [SMe3]+ input file |
| Log File | [NMe4]+ log | [PMe4]+ log | [SMe3]+ log |
| Link | DOI:10042/27093 | DOI:10042/27094 | DOI:10042/27095 |
Analysis of the Optimised Structures for the Onium Cations
The optimum structures for the onium cations is summarized in the table below:
| Cation | [NMe4]+ | [PMe4]+ | [SMe3]+ |
|---|---|---|---|
| Carbon-Central Atom Bond Length (lit.)/Å | 1.51 (1.51)[3] | 1.82 (1.84)[4] | 1.82 (1.80)[5] |
| Central Atom Bond Angle/° | 109.5 | 109.5 | 102.7 |
As can be seen in the table above, the [NMe4]+ C-N bond length is significantly shorter than the C-P bond length in [PMe4]+ and the C-S bond length in [SMe3]+, as nitrogen is a significantly smaller element than either phosphorous and sulfur, and more electronegative (as generally, the smaller the element, the more electronegative) and so forms stronger interactions with carbon due to greater overlap of valence orbitals. Phosphorous and sulfur are similar in size, forming very similar bond lengths to carbon.
Both [NMe4]+ and [PMe4]+ possess bond angles around the central atom of 109.5°, which is identical to the internal angle of a tetrahedron. This confirms that these two onium cations are tetrahedral in geometry around the central atom, which is sp3 hybridised with no lone pairs (all four sp3 orbitals shares a pair of electrons with a methyl substituent). On the other hand, the central bond angle in [SMe3]+ is an unusual 102.7°, which is near to the bond angle of 109.5° found in tetrahedral structures. Therefore, the central sulfur atom can be viewed as sp3 hybridised and tetrahedral, yet with a lone pair occupying one valence sp3 hybrid orbital. The lone pair is more repulsive than a normal bonded pair of electrons, reducing the bond angle around the central sulfur atoms.
As indicated by the table above, the optimised bond lengths for all the onium cations is in good agreement with literature bond lengths. It should be noted here, however, that the literature reported bond lengths for [PMe4]+ and [SMe3]+ are for the neutrally-charged, methyl-substituted equivalent compounds instead (i.e. trimethlphosphine and dimethylsulfide respectively). These compounds, however, display similar geometrical structures to their onium cation counterpart, and are therefore comparable.
MO Analysis of [NMe4]+
MO analysis was carried out for all three onium cations:
| Cation | [NMe4]+ | [PMe4]+ | [SMe3]+ |
|---|---|---|---|
| Input File | MO input file | MO input file | MO input file |
| Checkpoint File | MO checkpoint file | MO checkpoint file | MO checkpoint file |
| Link | DOI:10042/27155 | DOI:10042/27156 | DOI:10042/27157 |
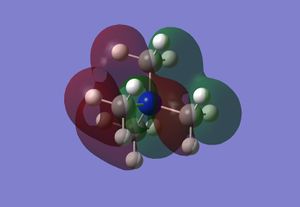
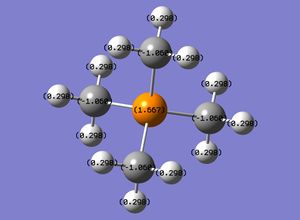
In particular, five valence occupied MOs for [NMe4]+ are shown below, which are similar to the MOs for both [PMe4]+ and [SMe3]+. However, there are some differences in the non-core MOs between the three cations, such as the number of non-core MOs calculated for [SMe3]+ is lower than that for [NMe3]+ and [PMe3]+, as an sp3 hybrid orbital is occupied by a lone pair rather than forming a methyl C-S bond; this lone pair is low in energy as a result of the cationic charge. Another difference is the relative energies of similar non-core MOs, which varies in no order across all three onium cations predominantly due to the differences in the atoms involved in the MO and so the extent of delocalisation.
NBO Analysis of the Onium Cations
The charge distribution across all three onium cations is summarized in the table below:

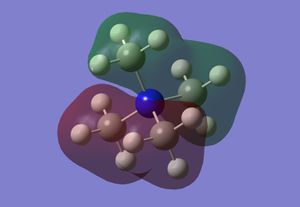
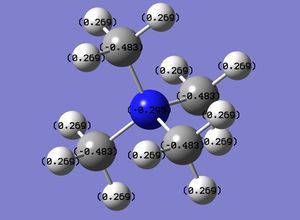
Between all three onium cations, only [NMe4]+ contains a negatively-charged central atom. This is due to the smaller size of nitrogen in comparison to phosphorous and sulfur, and therefore its higher electronegativity. Overall, the cationic charge is spread evenly throughout twelve hydrogen atoms in [NMe3]+, and therefore is spread evenly throughout the molecule providing a low positive charge density at any hydrogen atom in particular. The interaction with an anion is therefore weak and so the melting point of an ionic compound containing an [NMe4]+ is lower than the usual melting point for an ionic compound. For example, the melting point of tetramethylammonium chloride is 420°C,[6] which is significantly lower than for potassium chloride (776°C)[7]. Hence, [NMe4]+ can be utilized as a cation in ionic liquids due to its high spread of cationic charge and therefore its weak interaction with anions. However, [NMe4]+ is usually displayed as the figure on the right, employing the cationic charge on the nitrogen atom rather than picturing the charge spread evenly throughout all the hydrogen atoms. Neutral compounds containing a central nitrogen atom are usually tri-coordinate, with the nitrogen atom sp3 hybridised possessing a valence lone pair of electrons occupying a sp3 hybrid orbital so it's valence shell is saturated with the maximum eight electrons. However, a tetra-coordinate nitrogen remains sp3 hybridised but lacks valence lone pairs, and hence displays a cationic charge despite retaining a saturated valence shell as it has lost its lone pair.
On the other hand, both [PMe4]+ and [SMe3]+ contain central atoms with high positive charge. This indicates the cationic charge for these two cations is localised in the centre of the molecule, which could form strong attractions with the counter anions. However, the presence of the methyl groups in [PMe4]+ could provide some stearic hinderance, preventing the anion from forming a strong interaction with the central, posiively-charged atom. The melting point of ionic compounds containing the [PMe4]+ cation, therefore, would be lower than normal for ionic compounds, such as tetramethylphosphonium chloride, which melts at 396°C;[8] in conclusion, the [PMe4]+ cation could be utilized in ionic liquids.
The phosphorous in the [PMe4]+ cation contains a lower charge density than the sulfur in [SMe3]+ cation, due to the higher electronegativity of sulfur than phosphorous. The result of this is that sulfur forms a weaker interaction with anions than the phosphorous in [PMe4]+. In addition, [SMe3]+ contains a valence lone pair of electrons which can provide electrostatic repulsion with the anion, preventing it from forming a strong, favourable interaction with the positively-charged sulfur atom. Therefore, a weak interaction between an anion and the [SMe3]+ cation would be formed, providing a ionic compound with a low melting point, such as trimethylsulfonium chloride which melts at 192°C.[9] Therefore, the [SMe3]+ cation possesses potential to be utilized in ionic liquids.
The table below summarizes the relative contribution of the central atom to the bonds:
| Cation | [NMe4]+ | [PMe4]+ | [SMe3]+ |
|---|---|---|---|
| Contribution of Central Atom/% | 66.35 | 40.43 | 51.33 |
| Contribution of Carbon/% | 33.65 | 59.57 | 48.67 |
The table above only considers the bonding σ interaction of the central atom. Therefore, the greater the contribution of the atom, the higher the electronegativity of the atom. The result is that the greater the electronegativity of the central atom, the lower its charge (as expected), and so the greater the contribution of the central atom, the lower its charge
Influence of Functional Groups
Optimisation of Tetra-coordinate Nitrogen Cations
Both tetra-coordinate nitrogen cations were optimised using a 6-31G(d,p) basis set and with constraint of symmetry. The results from the optimisations are summarized in the table below:
| Cation | [NMe3CH2OH]+] | [NMe3CH2CN]+ |
|---|---|---|
| Input File | [NMe3CH2OH]+ | [NMe3CH2CN]+ |
| Log File | [NMe3CH2OH]+ | [NMe3CH2CN]+ |
| File Type | .log | .log |
| Calculation Type | FOPT | FOPT |
| Calculation Method | RB3LYP | RB3LYP |
| Basis Set | 6-31G(d,p) | 6-31G(d,p) |
| Energy/a.u. | -289.39 | -306.39 |
| RMS Gradient/a.u. | 0.00000010 | 0.00000034 |
| Dipole Moment | 1.58 | 5.76 |
| Point Group | C1 | C1 |
| Job CPU Time/mins:s | 19:03 | 22:51 |
| Link | DOI:10042/27225 | DOI:10042/27203 |
Confirmation of energy minimisation of both cations is exemplified by the lack of any effect on the total energy of the molecule with a bond distance displacement, as shown below for [NMe3CH2OH]+ (similar for [NMe3CH2CN]+):
         Item               Value     Threshold  Converged?
 Maximum Force            0.000000     0.000002     YES
 RMS     Force            0.000000     0.000001     YES
 Maximum Displacement     0.000003     0.000006     YES
 RMS     Displacement     0.000001     0.000004     YES
 Predicted change in Energy=-2.401020D-13
 Optimization completed.
    -- Stationary point found.
                           ----------------------------
                           !   Optimized Parameters   !
                           ! (Angstroms and Degrees)  !
 --------------------------                            --------------------------
 ! Name  Definition              Value          Derivative Info.                !
 --------------------------------------------------------------------------------
 ! R1    R(1,2)                  1.0898         -DE/DX =    0.0                 !
 ! R2    R(1,3)                  1.0877         -DE/DX =    0.0                 !
 ! R3    R(1,4)                  1.0905         -DE/DX =    0.0                 !
 ! R4    R(1,18)                 1.5123         -DE/DX =    0.0                 !
 ! R5    R(5,6)                  1.0905         -DE/DX =    0.0                 !
 ! R6    R(5,7)                  1.0905         -DE/DX =    0.0                 !
 ! R7    R(5,8)                  1.0898         -DE/DX =    0.0                 !
 ! R8    R(5,18)                 1.5062         -DE/DX =    0.0                 !
 ! R9    R(9,10)                 1.0905         -DE/DX =    0.0                 !
 ! R10   R(9,11)                 1.0877         -DE/DX =    0.0                 !
 ! R11   R(9,12)                 1.0898         -DE/DX =    0.0                 !
 ! R12   R(9,18)                 1.5123         -DE/DX =    0.0                 !
 ! R13   R(13,14)                1.0976         -DE/DX =    0.0                 !
 ! R14   R(13,15)                1.0976         -DE/DX =    0.0                 !
 ! R15   R(13,16)                1.3867         -DE/DX =    0.0                 !
 ! R16   R(13,18)                1.5209         -DE/DX =    0.0                 !
 ! R17   R(16,17)                0.9675         -DE/DX =    0.0                 !
 ! A1    A(2,1,3)              110.8616         -DE/DX =    0.0                 !
 ! A2    A(2,1,4)              110.0868         -DE/DX =    0.0                 !
 ! A3    A(2,1,18)             108.3675         -DE/DX =    0.0                 !
 ! A4    A(3,1,4)              110.2229         -DE/DX =    0.0                 !
 ! A5    A(3,1,18)             108.576          -DE/DX =    0.0                 !
 ! A6    A(4,1,18)             108.6631         -DE/DX =    0.0                 !
 ! A7    A(6,5,7)              110.2427         -DE/DX =    0.0                 !
 ! A8    A(6,5,8)              109.8181         -DE/DX =    0.0                 !
 ! A9    A(6,5,18)             109.1774         -DE/DX =    0.0                 !
 ! A10   A(7,5,8)              109.8181         -DE/DX =    0.0                 !
 ! A11   A(7,5,18)             109.1774         -DE/DX =    0.0                 !
 ! A12   A(8,5,18)             108.5768         -DE/DX =    0.0                 !
 ! A13   A(10,9,11)            110.2229         -DE/DX =    0.0                 !
 ! A14   A(10,9,12)            110.0868         -DE/DX =    0.0                 !
 ! A15   A(10,9,18)            108.6631         -DE/DX =    0.0                 !
 ! A16   A(11,9,12)            110.8616         -DE/DX =    0.0                 !
 ! A17   A(11,9,18)            108.576          -DE/DX =    0.0                 !
 ! A18   A(12,9,18)            108.3675         -DE/DX =    0.0                 !
 ! A19   A(14,13,15)           109.8271         -DE/DX =    0.0                 !
 ! A20   A(14,13,16)           113.7493         -DE/DX =    0.0                 !
 ! A21   A(14,13,18)           106.3962         -DE/DX =    0.0                 !
 ! A22   A(15,13,16)           113.7493         -DE/DX =    0.0                 !
 ! A23   A(15,13,18)           106.3962         -DE/DX =    0.0                 !
 ! A24   A(16,13,18)           106.1103         -DE/DX =    0.0                 !
 ! A25   A(13,16,17)           110.4818         -DE/DX =    0.0                 !
 ! A26   A(1,18,5)             109.7782         -DE/DX =    0.0                 !
 ! A27   A(1,18,9)             109.5606         -DE/DX =    0.0                 !
 ! A28   A(1,18,13)            109.6243         -DE/DX =    0.0                 !
 ! A29   A(5,18,9)             109.7782         -DE/DX =    0.0                 !
 ! A30   A(5,18,13)            108.4579         -DE/DX =    0.0                 !
 ! A31   A(9,18,13)            109.6242         -DE/DX =    0.0                 !
 ! D1    D(2,1,18,5)            61.7682         -DE/DX =    0.0                 !
 ! D2    D(2,1,18,9)           -58.8546         -DE/DX =    0.0                 !
 ! D3    D(2,1,18,13)         -179.1918         -DE/DX =    0.0                 !
 ! D4    D(3,1,18,5)          -177.7386         -DE/DX =    0.0                 !
 ! D5    D(3,1,18,9)            61.6386         -DE/DX =    0.0                 !
 ! D6    D(3,1,18,13)          -58.6986         -DE/DX =    0.0                 !
 ! D7    D(4,1,18,5)           -57.8428         -DE/DX =    0.0                 !
 ! D8    D(4,1,18,9)          -178.4656         -DE/DX =    0.0                 !
 ! D9    D(4,1,18,13)           61.1971         -DE/DX =    0.0                 !
 ! D10   D(6,5,18,1)            59.4622         -DE/DX =    0.0                 !
 ! D11   D(6,5,18,9)           179.9532         -DE/DX =    0.0                 !
 ! D12   D(6,5,18,13)          -60.2923         -DE/DX =    0.0                 !
 ! D13   D(7,5,18,1)          -179.9532         -DE/DX =    0.0                 !
 ! D14   D(7,5,18,9)           -59.4621         -DE/DX =    0.0                 !
 ! D15   D(7,5,18,13)           60.2924         -DE/DX =    0.0                 !
 ! D16   D(8,5,18,1)           -60.2455         -DE/DX =    0.0                 !
 ! D17   D(8,5,18,9)            60.2456         -DE/DX =    0.0                 !
 ! D18   D(8,5,18,13)          180.0            -DE/DX =    0.0                 !
 ! D19   D(10,9,18,1)          178.4656         -DE/DX =    0.0                 !
 ! D20   D(10,9,18,5)           57.8428         -DE/DX =    0.0                 !
 ! D21   D(10,9,18,13)         -61.1972         -DE/DX =    0.0                 !
 ! D22   D(11,9,18,1)          -61.6387         -DE/DX =    0.0                 !
 ! D23   D(11,9,18,5)          177.7385         -DE/DX =    0.0                 !
 ! D24   D(11,9,18,13)          58.6986         -DE/DX =    0.0                 !
 ! D25   D(12,9,18,1)           58.8545         -DE/DX =    0.0                 !
 ! D26   D(12,9,18,5)          -61.7683         -DE/DX =    0.0                 !
 ! D27   D(12,9,18,13)         179.1918         -DE/DX =    0.0                 !
 ! D28   D(14,13,16,17)        -63.3785         -DE/DX =    0.0                 !
 ! D29   D(15,13,16,17)         63.38           -DE/DX =    0.0                 !
 ! D30   D(18,13,16,17)       -179.9992         -DE/DX =    0.0                 !
 ! D31   D(14,13,18,1)         -61.3141         -DE/DX =    0.0                 !
 ! D32   D(14,13,18,5)          58.5366         -DE/DX =    0.0                 !
 ! D33   D(14,13,18,9)         178.3873         -DE/DX =    0.0                 !
 ! D34   D(15,13,18,1)        -178.3873         -DE/DX =    0.0                 !
 ! D35   D(15,13,18,5)         -58.5366         -DE/DX =    0.0                 !
 ! D36   D(15,13,18,9)          61.3142         -DE/DX =    0.0                 !
 ! D37   D(16,13,18,1)          60.1493         -DE/DX =    0.0                 !
 ! D38   D(16,13,18,5)        -180.0            -DE/DX =    0.0                 !
 ! D39   D(16,13,18,9)         -60.1492         -DE/DX =    0.0                 !
 --------------------------------------------------------------------------------
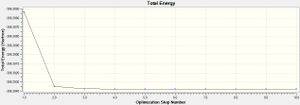
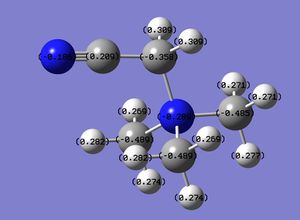
Energy minimisation for both cations can also be displayed by energy convergence graphs and the lack of a change in the energy of the molecule with a change in the bond length, as displayed for the [NMe3CH2CN]+ cation to the right. As indicated by the images, the convergence of [NMe3CH2CN]+ to an optimised energy and structure occurred after ten steps, whereas the optimisation of energy and structure for [NMe3CH2OH]+ converged within eleven steps. The [NMe3CH2OH]+ cation converged within a greater number of steps as the rotation around the C-O σ bond results in a number of conformations with respect to the O-H σ bond as the oxygen atom is sp3 hybridised, with each conformation varying in energy; the [NMe3CH2CN]+ cation, on the other hand, possesses fewer conformations as the carbon atom is sp hybridised in the cyano substituent and so can only adopt a linear conformation with respect to the C-C σ bond; therefore, it optimises in energy, and as a result structure, within a fewer number of stages.
Frequency Analysis of the Cations
A frequency analysis of both cations was carried out, with the files submitted in the table below:
| Cation | [NMe3CH2]+ | [NMe3CH2CN]+ |
|---|---|---|
| Input File | [NMe3CH2OH]+ input | [NMe3CH2CN]+ input |
| Log File | [NMe3CH2OH]+ log | [NMe3CH2CN]+ log |
| Files Link | DOI:10042/27240 | DOI:10042/27238 |
The low frequencies for [NMe3CH2CN]+ are displayed below, showing zero frequencies below the bond vibrational frequencies. This indicates that the basis set utilized for the optimisation, and the subsequent energy minimisation and molecular structure convergence, is accurate as the vibrations of the centre of the molecule are minimal in comparison to the bond vibrations:
Low frequencies ---   -2.6292   -0.0009   -0.0006   -0.0004    7.1476    9.6677
Low frequencies ---   91.7737  154.0282  210.9273
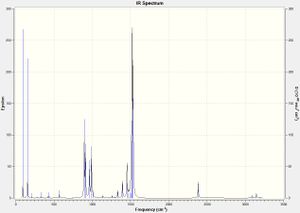
In addition, the zero frequencies are within the range of -15 to 15 cm-1, confirming the high reliability of the basis set employed during the optimisation. The lack of any vibrational frequencies below zero, as indicated by the IR spectrum of [NMe3CH2CN]+ shown below, show the optimisation of the molecule converged to a global energy minimum.
The [NMe3CH2OH]+ cation, on the other hand, optimised to a local energy minimum. The low frequencies for the cation are displayed below, indicating the high range of the zero frequencies outside of the range of -15 to 15 cm-1:
Low frequencies --- -121.5305   -3.2106   -0.0004    0.0006    0.0007    3.9505
Low frequencies ---    5.0518  129.6712  217.5195

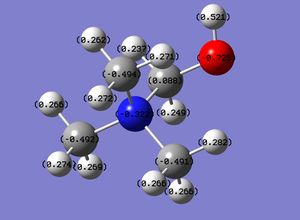
The conclusion that can be derived from this is that the basis set utilized to optimise this structure is inaccurate. However, upon inspection of the negative vibrational frequency at -122 cm-1, shown by the figure on the right, the local energy minimum obtained for this molecule is only destabilized with respect to the hydroxyl group hydrogen atom, resulting in a wagging. This conformation can be avoided by fixing the hydrogen atom to a specific structure of the molecule, and repeating the optimisation with a 6-31G(d,p) basis set and constraint of symmetry of the molecule. The results of the optimisation are summarized in the table below:
| Input File | Input |
| Output File | Output |
| File Type | .log |
| Calculation Type | FOPT |
| Calculation Method | RB3LYP |
| Basis Set | 6-31G(d,p) |
| Energy/a.u. | -289.39 |
| RMS Gradient/a.u. | 0.00000042 |
| Dipole Moment/D | 2.14 |
| Point Group | C1 |
| Job CPU Time/min:s | 52:40 |
| Folder Link | DOI:10042/27263 |
Confirmation the optimisation converged is shown below:
         Item               Value     Threshold  Converged?
 Maximum Force            0.000001     0.000002     YES
 RMS     Force            0.000000     0.000001     YES
 Maximum Displacement     0.000004     0.000006     YES
 RMS     Displacement     0.000001     0.000004     YES
 Predicted change in Energy=-2.560001D-12
 Optimization completed.
    -- Stationary point found.
                           ----------------------------
                           !   Optimized Parameters   !
                           ! (Angstroms and Degrees)  !
 --------------------------                            --------------------------
 ! Name  Definition              Value          Derivative Info.                !
 --------------------------------------------------------------------------------
 ! R1    R(1,2)                  1.0912         -DE/DX =    0.0                 !
 ! R2    R(1,3)                  1.09           -DE/DX =    0.0                 !
 ! R3    R(1,4)                  1.089          -DE/DX =    0.0                 !
 ! R4    R(1,18)                 1.5044         -DE/DX =    0.0                 !
 ! R5    R(5,6)                  1.0901         -DE/DX =    0.0                 !
 ! R6    R(5,7)                  1.0905         -DE/DX =    0.0                 !
 ! R7    R(5,8)                  1.0887         -DE/DX =    0.0                 !
 ! R8    R(5,18)                 1.5092         -DE/DX =    0.0                 !
 ! R9    R(9,10)                 1.0908         -DE/DX =    0.0                 !
 ! R10   R(9,11)                 1.0907         -DE/DX =    0.0                 !
 ! R11   R(9,12)                 1.0902         -DE/DX =    0.0                 !
 ! R12   R(9,18)                 1.5038         -DE/DX =    0.0                 !
 ! R13   R(13,14)                1.0929         -DE/DX =    0.0                 !
 ! R14   R(13,15)                1.0942         -DE/DX =    0.0                 !
 ! R15   R(13,16)                1.3736         -DE/DX =    0.0                 !
 ! R16   R(13,18)                1.5527         -DE/DX =    0.0                 !
 ! R17   R(16,17)                0.9668         -DE/DX =    0.0                 !
 ! A1    A(2,1,3)              109.71           -DE/DX =    0.0                 !
 ! A2    A(2,1,4)              110.5897         -DE/DX =    0.0                 !
 ! A3    A(2,1,18)             109.0657         -DE/DX =    0.0                 !
 ! A4    A(3,1,4)              109.8724         -DE/DX =    0.0                 !
 ! A5    A(3,1,18)             108.894          -DE/DX =    0.0                 !
 ! A6    A(4,1,18)             108.6749         -DE/DX =    0.0                 !
 ! A7    A(6,5,7)              110.0303         -DE/DX =    0.0                 !
 ! A8    A(6,5,8)              110.7403         -DE/DX =    0.0                 !
 ! A9    A(6,5,18)             108.7183         -DE/DX =    0.0                 !
 ! A10   A(7,5,8)              110.0445         -DE/DX =    0.0                 !
 ! A11   A(7,5,18)             108.7856         -DE/DX =    0.0                 !
 ! A12   A(8,5,18)             108.4713         -DE/DX =    0.0                 !
 ! A13   A(10,9,11)            110.0894         -DE/DX =    0.0                 !
 ! A14   A(10,9,12)            109.7651         -DE/DX =    0.0                 !
 ! A15   A(10,9,18)            109.2708         -DE/DX =    0.0                 !
 ! A16   A(11,9,12)            109.6954         -DE/DX =    0.0                 !
 ! A17   A(11,9,18)            109.1282         -DE/DX =    0.0                 !
 ! A18   A(12,9,18)            108.8688         -DE/DX =    0.0                 !
 ! A19   A(14,13,15)           110.3255         -DE/DX =    0.0                 !
 ! A20   A(14,13,16)           109.8577         -DE/DX =    0.0                 !
 ! A21   A(14,13,18)           104.9899         -DE/DX =    0.0                 !
 ! A22   A(15,13,16)           114.6591         -DE/DX =    0.0                 !
 ! A23   A(15,13,18)           105.9649         -DE/DX =    0.0                 !
 ! A24   A(16,13,18)           110.5486         -DE/DX =    0.0                 !
 ! A25   A(13,16,17)           111.4423         -DE/DX =    0.0                 !
 ! A26   A(1,18,5)             109.5995         -DE/DX =    0.0                 !
 ! A27   A(1,18,9)             110.1328         -DE/DX =    0.0                 !
 ! A28   A(1,18,13)            109.7867         -DE/DX =    0.0                 !
 ! A29   A(5,18,9)             110.1369         -DE/DX =    0.0                 !
 ! A30   A(5,18,13)            108.7427         -DE/DX =    0.0                 !
 ! A31   A(9,18,13)            108.4155         -DE/DX =    0.0                 !
 ! D1    D(2,1,18,5)           179.5137         -DE/DX =    0.0                 !
 ! D2    D(2,1,18,9)           -59.1705         -DE/DX =    0.0                 !
 ! D3    D(2,1,18,13)           60.1348         -DE/DX =    0.0                 !
 ! D4    D(3,1,18,5)           -60.7874         -DE/DX =    0.0                 !
 ! D5    D(3,1,18,9)            60.5285         -DE/DX =    0.0                 !
 ! D6    D(3,1,18,13)          179.8337         -DE/DX =    0.0                 !
 ! D7    D(4,1,18,5)            58.878          -DE/DX =    0.0                 !
 ! D8    D(4,1,18,9)          -179.8061         -DE/DX =    0.0                 !
 ! D9    D(4,1,18,13)          -60.5009         -DE/DX =    0.0                 !
 ! D10   D(6,5,18,1)            56.821          -DE/DX =    0.0                 !
 ! D11   D(6,5,18,9)           -64.4924         -DE/DX =    0.0                 !
 ! D12   D(6,5,18,13)          176.8396         -DE/DX =    0.0                 !
 ! D13   D(7,5,18,1)           176.6391         -DE/DX =    0.0                 !
 ! D14   D(7,5,18,9)            55.3257         -DE/DX =    0.0                 !
 ! D15   D(7,5,18,13)          -63.3423         -DE/DX =    0.0                 !
 ! D16   D(8,5,18,1)           -63.67           -DE/DX =    0.0                 !
 ! D17   D(8,5,18,9)           175.0166         -DE/DX =    0.0                 !
 ! D18   D(8,5,18,13)           56.3487         -DE/DX =    0.0                 !
 ! D19   D(10,9,18,1)           57.759          -DE/DX =    0.0                 !
 ! D20   D(10,9,18,5)          178.7536         -DE/DX =    0.0                 !
 ! D21   D(10,9,18,13)         -62.3781         -DE/DX =    0.0                 !
 ! D22   D(11,9,18,1)          178.1833         -DE/DX =    0.0                 !
 ! D23   D(11,9,18,5)          -60.8221         -DE/DX =    0.0                 !
 ! D24   D(11,9,18,13)          58.0462         -DE/DX =    0.0                 !
 ! D25   D(12,9,18,1)          -62.1135         -DE/DX =    0.0                 !
 ! D26   D(12,9,18,5)           58.8811         -DE/DX =    0.0                 !
 ! D27   D(12,9,18,13)         177.7494         -DE/DX =    0.0                 !
 ! D28   D(14,13,16,17)        140.6882         -DE/DX =    0.0                 !
 ! D29   D(15,13,16,17)         15.7863         -DE/DX =    0.0                 !
 ! D30   D(18,13,16,17)       -103.9033         -DE/DX =    0.0                 !
 ! D31   D(14,13,18,1)         179.4267         -DE/DX =    0.0                 !
 ! D32   D(14,13,18,5)          59.5243         -DE/DX =    0.0                 !
 ! D33   D(14,13,18,9)         -60.2207         -DE/DX =    0.0                 !
 ! D34   D(15,13,18,1)         -63.7901         -DE/DX =    0.0                 !
 ! D35   D(15,13,18,5)         176.3075         -DE/DX =    0.0                 !
 ! D36   D(15,13,18,9)          56.5626         -DE/DX =    0.0                 !
 ! D37   D(16,13,18,1)          61.0076         -DE/DX =    0.0                 !
 ! D38   D(16,13,18,5)         -58.8948         -DE/DX =    0.0                 !
 ! D39   D(16,13,18,9)        -178.6397         -DE/DX =    0.0                 !
 --------------------------------------------------------------------------------
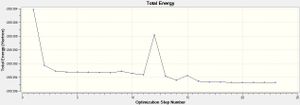

This shows that the total energy of the molecule does not change with a change in the bond distances, as confirmed by the diagram on the right and below showing the convergence of energy occurred after 23 steps, and there was a lack of a change in the energy with a change in the bond distance in the molecule after 23 steps, respectively. A frequency analysis was subsequently carried out, and the files are filed in the table below:
| Input File | [NMe3CH2OH]+ input file |
| Log File | [NMe3CH2OH]+ log file |
| Link | DOI:10042/27267 |
The low frequencies, displayed below, indicate the high accuracy and reliability of the basis set employed:
Low frequencies ---   -8.4396   -5.0322   -1.1285   -0.0006    0.0011    0.0012
Low frequencies ---  131.1059  213.4644  255.7141
In addition, the IR spectrum, shown below, indicates the optimisation has converged to a global energy minimum as no negative vibrational frequencies are present:
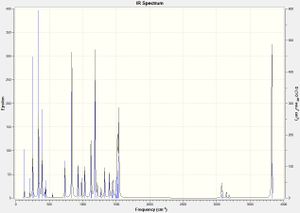
MO and NBO Analysis Between Onium Cations and Tetra-coordinate Nitrogen Cations
The charge distribution for [NMe3CH2OH]+ and [NMe3CH2CN]+ is summarized in the table below:

The difference between [NMe4]+ and [NMe3CH2OH]+ is the increased charge density of the central nitrogen atom, as the [NMe3CH2OH]+ cation can resonate to a protonated formaldehyde and a trimethylamine molecule (shown in the diagram on the right). This resonance would elongate the σ bond between the central nitrogen atom and the methylene carbon, confirmed by the optimised structure of the [NMe3CH2OH]+ cation: the C-N bond length between the central nitrogen atom and the carbon of the methyl substituent is 1.50 Å, whereas the bond length with the methylene carbon is 1.55 Å. This also results in a positive charge density for the methylene carbon, in comparison to the high negative charge density of the methyl carbon atoms, which have a greater charge density than the methyl carbon atoms in [NMe4]+ due to the resonance increasing the charge density on the trimethylamine molecule.
On the other hand, the central nitrogen atom in [NMe3CH2CN]+ possesses a lower charge density than the central nitrogen atom in [NMe4]+. The methylene carbon atom in [NMe3CH2CN]+ also has a decreased charge density in comparison to the methyl carbon atoms. This can be accounted for by the inductive electron-withdrawing effect of the cyano substituent containing an electronegative nitrogen atom with an sp hybridised lone pair that cannot be included in any resonance structures due to its linear conformation; therefore, the cyano carbon atom is electron deficient and carries a highly positive charge density, removing the charge density from the adjacent methylene carbon atom and also the central nitrogen atom, as well as from the hydrogen atoms in the molecule displaying a higher positive charge density in comparison to the equivalently charged protons in [NMe4]+ (inequivalent in this cation as a result of the unsymmetrical polarization of the molecule). The result, however, is that the cationic charge remains spread throughout the whole molecule, and so the interaction of the [NMe3CH2CN]+ cation with an anion is weak. So, the melting point for an ionic substance containing the cation would be low, such as methanaminimum chloride containing a melting point of 229-233°C.[10] Therefore, the [NMe3Ch2CN]+ cation can be utilized in the synthesis of ionic liquids.
The table below displays the HOMO and LUMO for [NMe4]+, [NMe3CH2OH]+ and [NMe3CH2CN]+:
| Cation | [NMe4]+ | [NMe3CH2OH]+ | [NMe3CH2CN]+ |
|---|---|---|---|
| HOMO | 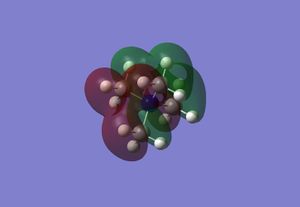 |
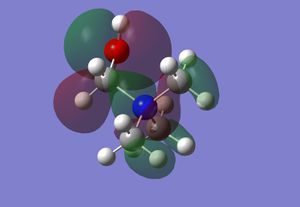 |
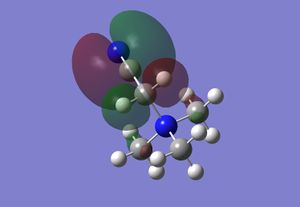 |
| Relative HOMO Energy/a.u. | -0.57933 | -0.48763 | -0.50048 |
| LUMO | 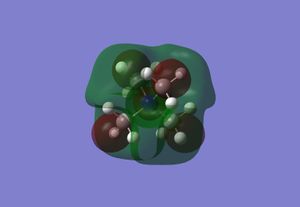 |
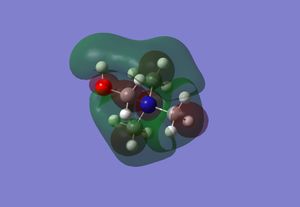 |
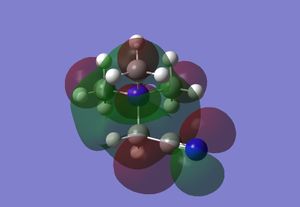 |
| Relative LUMO Energy/a.u. | -0.13300 | -0.12459 | -0.18183 |
From [NMe4]+, which contains antibonding interactions between the central nitrogen atom and all the methyl groups in the LUMO, to [NMe3CH2OH]+, a bonding interaction is formed between the central nitrogen atom and the methylene group and the oxygen atom, reducing the antibonding interactions with the central nitrogen atom.
Introducing either an electron-withdrawing group or an electron-donating group to the methyl substituent of [NMe4]+ results in a energy increase of the HOMO, as a result of the unsymmetrical polarization of the molecule when a substituent is added reducing the number of atoms involved in the MO (i.e. the MO delocalisation is reduced). In addition, the contribution of the atoms to the MO is reduced, inferring that the orbital interaction between atoms is weaker. As can be expected, the addition of an electron-withdrawing substituent to [NMe4]+ decreases the energy of the LUMO as there is a favourable overlap of phases between the cyano π* orbital and the methylene substituent whilst retaining the delocalisation of the MO throughout the molecule, and involving all atoms equivalently. The decrease in energy of the LUMO by addition of an electron-withdrawing substituent is especially utilized in synthetic chemistry, such as in the Diels-Alder reaction, where the alkene contains an electron-withdrawing substituent to decrease the energy of the LUMO for effective overlap with the diene π HOMO. The increase in energy of the HOMO by addition of an electron-donating substituent is also expected.
The addition of an electron-withdrawing substituent and an electron-donating substituent reduces the energy difference between the HOMO and LUMO. This is due to the increase in energy of the HOMO when an electron-donating substituent is included in the molecule, without any significant effects on the LUMO, as indicated in the table above (the energy of the [NMe3CH2OH]+ LUMO is similar to the [NMe4]+).
The lower difference between the HOMO and the LUMO results in facile excitation of [NMe3CH2OH]+ and [NMe3CH2CN]+ in comparison to [NMe4]+, which results in the formation of a higher reactivity excited state. Therefore, the [NMe3CH2OH]+ and [NMe3CH2CN]+ cations may not be stable as ionic liquid solvents during photochemical reactions, as they could react with the reactants in solution. In addition, a low energy LUMO such as in [NMe3CH2CN]+ is easily attacked by nucleophilic reactants, especially due to the attraction between nucleophiles and cationic species, resulting in degradation of the ionic liquid cation and an unwanted side-reaction of the desired reaction in the ionic liquid solvent.
| Cation | [NMe3CH2OH]+ | [NMe3CH2CN]+ |
|---|---|---|
| Input File | [NMe3CH2OH]+ input | [NMe3CH2CN]+ input |
| Checkpoint File | [NMe3CH2OH]+ checkpoint | [NMe3CH2CN]+ checkpoint |
| Folder Link | DOI:10042/27305 | DOI:10042/27225 |
Conclusion
Overall, the onium cations with a symmetrical polarization are suitable for the synthesis of ionic liquids. The [NMe3CH2OH]+ and [NMe3CH2CN]+ cations are suitable for the synthesis of ionic liquids; however, due to their unsymmetrical polarization and subsequent decrease in the HOMO-LUMO gap, their utilization as ionic liquids in either a solvent context or reactant context is specific, and must be applied accordingly.
References
- ↑ B. Réffy, M. Kolonitz and M. Hargittai, J. Mol. Struct., 1998, DOI:10.1016/S0022-2860(97)00420-1
- ↑ J. M. Crosthwaite, M. J. Muldoon, J. K. Dixon, J. L. Anderson and J. F. Brennecke, J. Chem. Thermodyn., 2005, DOI:10.1016/j.jct.2005.03.013
- ↑ V. Moliner and I. H. Williams, J. Am. Chem. Soc., 2000, DOI:10.1021/ja001170e
- ↑ L. I. Grekov, D. P. Kalinkin and A. O. Litinskii, Russ. J. Gen. Chem., 2011, DOI:10.1134/S1070363211060065
- ↑ N. W. Mitzel and U. Losehand, Z. Naturforsch., 2004, DOI:/ab/v59b/s59b0635
- ↑ J. O. Bockris and A. K. N. Reddy, Modern Electrochemistry 1: Ionics, Plenum Press, New York, 2nd edn., 1998, pp. 724
- ↑ Z. H. Fang, J. Appl. Phys., 2007, DOI:10.1063/1.2752143
- ↑ US Pat., US5188914A, 1993
- ↑ B. Byrne and L. H. L. Lawter, Tetrahedron Lett., 1986, DOI:10.1016/S0040-4039(00)84225-2
- ↑ A. A. Shamsuri and D. K. Abdullah, Int. J. Chem., 2011, DOI:7416/6854

