Rep:Mod:La409Mod2
Laurence Archer - Computational chemistry laboratory Module 2
Introduction
Computational chemistry has over the years evolved into an invaluable tool for chemists of all fields. The use of modelling molecules and determining its electronic behaviour at the quantum level can offer insight into the fine workings of the system, allowing deeper understanding and the potential for improvement of the system for its purpose in a way previously unachievable. An example of how computational calculations vastly improved design of a molecule was shown by Studt et al[1] whereby they used DFT (using DACAPO code for pseudopotentials and a plane wave basis set) to model transition metal catalysts on their selectivity in allowing ethene adsoption but not ethylene absorption.
In this investigation, the use of computational calculations will be used to understand and explain the physical origins and properties of some case studies in inorganic chemistry. This begins with an examination into the electronic form of borane, BH3. The structure is energetically optimised, confirming this conclusion by using frequency analysis, and then the vibrational modes, charge distribution, Natural Bonding Orbitals and Molecular Orbitals are visualised. The same basic investigation is then performed on thallium tribromide, TlBr3, however this time having to use pseudo-potentials due to the high electron count of the atoms in this case. The difference between cis and trans isomers in an octahedral molybdenum complex is then considered, using the previously used optimisation and frequency analysis techniques. The investigation then finishes off with a mini project, looking into...
Molecular modelling of BH3
Optimisation
The aim of this section is to determine the optimised structure of the molecule borane, BH3, by use of ab initio quantum mechanical calculations. This begins with a structural optimisation using Gaussian.
BH3 was modeled in Gaussview and the B-H bond lengths extended to 1.5 Å. A Gaussian input file was then built using the keywords:
# opt b3lyp/3-21g geom=connectivity
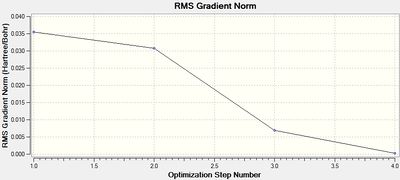
The resulting .log output file was viewed in Gaussview and Notepad, yielding the following key information.
The final RMS gradient obtained is very small, indicating a tight convergence. Convergence was further confirmed by viewing the convergence analysis in the output file in WordPad, where the value of the Maximum Force, RMS Force, Maximum Displacement and RMS Displacement are compared against a 'threshold', which indicates the point of convergence. All four parameters had passed below the threshold and hence convergence was labelled 'YES' for each. The convergence graphs above show the iterative optimisation of the molecule until the RMS gradient falls below 0.001. The calculation successfully converged to a structure with optimised B-H bond lengths of 1.19 Å. This is in good agreement with a previously calculated value: 1.1867 Å.[2]
Frequency/vibrational analysis
A Gaussian input file containing the optimised geometry was set-up for frequency analysis (and nbo analysis for later), using the parameters:
# freq b3lyp/3-21g geom=connectivity pop=(full,nbo)
A summary of the resulting Gaussian output is shown below (and available here)
|
| ||||||||||||||||||||||||||||||||||||||||||||||||||||||||||||||||||||||||
Charge distribution/NBO analysis
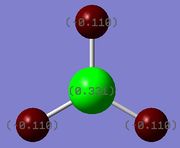
The .log output file of the population analysis was opened in Gaussview. The charge distribution of the molecule was then visualised, producing the diagrams on the right. The coloured visualisation is green in areas of high positive charge and red in areas of high negative charge, hence as expected: the boron atom is highly electron deficient (high positive charge). The numbered visualisation shows the NBO charges on each atom, giving the boron atom a positive charge of 0.331 and the hydrogens a charge of -0.110 each, where the magnitude of these charges have a ratio of 3:1, as expected from the valence electron counts of boron and hydrogen.
Opening of the .log output file in Wordpad yielded a more detailed analysis of the Natural Population Analysis.
Summary of Natural Population Analysis:

                                       Natural Population
                Natural  -----------------------------------------------
    Atom  No    Charge         Core      Valence    Rydberg      Total
 -----------------------------------------------------------------------
      B    1    0.33121      1.99904     2.66976    0.00000     4.66879
      H    2   -0.11040      0.00000     1.11008    0.00032     1.11040
      H    3   -0.11040      0.00000     1.11008    0.00032     1.11040
      H    4   -0.11040      0.00000     1.11008    0.00032     1.11040
 =======================================================================
   * Total *    0.00000      1.99904     6.00000    0.00097     8.00000
The column 'Natural Charge' shows what is plot on the atoms in the image in the previous section, giving a relative charge to each atom so that the sum of all charges equals zero (neutrality). The boron atom contains a 'core' of two electrons in the 1s orbital, which can be interpreted as remaining undisturbed due to the Natural Population being effectively equal to 2.0. However the valence electron, where there is know to be three for boron, have a natural population lower than predicted, indicating the boron is electron poor. The hydrogen atoms are known to have one electron each, however the Natural Population is given as higher than 1, indicating the attraction of charge onto the hydrogen atoms from boron. What this all shows is that the boron is electron poor and the hydrogens are electron rich, this can be explained by the fact that hydrogen atoms are slightly more electronegative than boron atoms.
Below shows the NBO analysis of the bonding orbitals. The first 4 entries are shown, where the later entries in the output file referred to unoccupied anti-bonding orbitals and Rydberg orbitals not of interest.
       (Occupancy)   Bond orbital/ Coefficients/ Hybrids
 ---------------------------------------------------------------------------------
     1. (1.99851) BD ( 1) B   1 - H   2
                ( 44.49%)   0.6670* B   1 s( 33.33%)p 2.00( 66.67%)
                                            0.0000  0.5774  0.0000  0.0000  0.0000
                                            0.8165  0.0000  0.0000  0.0000
                ( 55.51%)   0.7451* H   2 s(100.00%)
                                            1.0000  0.0000
     2. (1.99851) BD ( 1) B   1 - H   3
                ( 44.49%)   0.6670* B   1 s( 33.33%)p 2.00( 66.67%)
                                            0.0000  0.5774  0.0000  0.7071  0.0000
                                           -0.4082  0.0000  0.0000  0.0000
                ( 55.51%)   0.7451* H   3 s(100.00%)
                                            1.0000  0.0000
     3. (1.99851) BD ( 1) B   1 - H   4
                ( 44.49%)   0.6670* B   1 s( 33.33%)p 2.00( 66.67%)
                                            0.0000  0.5774  0.0000 -0.7071  0.0000
                                           -0.4082  0.0000  0.0000  0.0000
                ( 55.51%)   0.7451* H   4 s(100.00%)
                                            1.0000  0.0000
     4. (1.99904) CR ( 1) B   1           s(100.00%)
                                            1.0000  0.0000  0.0000  0.0000  0.0000
                                            0.0000  0.0000  0.0000  0.0000
Entries 1-3 refer to three identical bonds between boron and each of the three hydrogen atoms. The boron orbitals are shown to contribute 44.5% towards the overall bonding orbital, where the boron's orbital contribution is given to be composed of 33% s-orbital character and 66% p-orbital character (analogous to sp2). The hydrogen therefore contributes 55.5% with 100% of this hydrogen orbital having s-orbital character. The fourth NBO represents the core electrons on boron, being 100% s-orbital in character.
The table below effectively shows any significant orbital mixing.
 Second Order Perturbation Theory Analysis of Fock Matrix in NBO Basis

     Threshold for printing:   0.50 kcal/mol
                                                                              E(2)  E(j)-E(i) F(i,j)
         Donor NBO (i)                     Acceptor NBO (j)                 kcal/mol   a.u.    a.u.
 ===================================================================================================

 within unit  1
   4. CR (   1) B   1                / 10. RY*(   1) H   2                    1.51    7.55    0.095
   4. CR (   1) B   1                / 11. RY*(   1) H   3                    1.51    7.55    0.095
   4. CR (   1) B   1                / 12. RY*(   1) H   4                    1.51    7.55    0.095
It is generally considered that a value of E(2) greater than 20 kcal/mol indicates noteworthy mixing. However, the calculation sets a 'threshold for printing' of mixing (considered significant by Gaussian) at 0.50 kcal/mol, hence the mixing shown above can be considered negligible.
A summary of the NBOs is shown below.
 Natural Bond Orbitals (Summary):

                                                            Principal Delocalizations
           NBO                        Occupancy    Energy   (geminal,vicinal,remote)
 ====================================================================================
 Molecular unit  1  (H3B)
     1. BD (   1) B   1 - H   2          1.99851    -0.43694
     2. BD (   1) B   1 - H   3          1.99851    -0.43694
     3. BD (   1) B   1 - H   4          1.99851    -0.43694
     4. CR (   1) B   1                  1.99904    -6.64523  10(v),11(v),12(v)
This table summarises the occupied Natural Bond Orbitals. Each orbital between the boron and each hydrogen has an occupancy of 2; the relative energies of the orbitals is also shown. The 'principal delocalizations' column shows where significant mixing occurs between the respective orbital and the orbitals listed. In the case of the boron core electrons, these were shown in the Second-Order Pertubation Theory Analysis above to mix with vicinal Rydberg orbitals on the hydrogen atoms.
Overall, this NBO analysis provides important information on the general bonding picture of the molecule, showing the extent of bond polarities and Lewis acidity/basicity. Here it has shown that in this compound the sp2 boron has a Lewis basic nature.
Molecular Orbitals
The molecular orbitals were obtained by submitting the optimised geometry for the 'Energy' calculation job, using the keywords:
# b3lyp/6-31g pop=(nbo,full) geom=connectivity
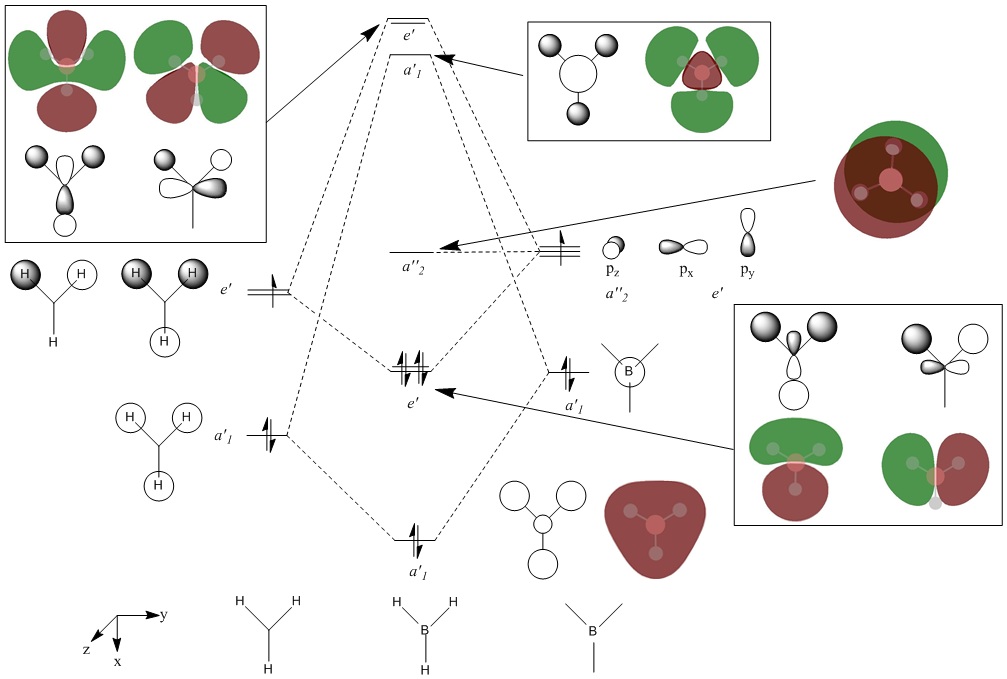
The formatted checkpoint file was viewed in Gaussview, which was able to generate 3D visual representations of the orbitals.
Energies of MOs
By using the Linear Combination of Atomic Orbitals method, the elementary MOs of BH3 were represented in a simple MO diagram, shown below. The orbitals of the H3 fragment are well known and hence determination of these are not detailed here.
Molecular modelling of TlBr3
Optimisation
Molecules which contain atoms from the third row of the Periodic Table or below contain a large amount of electrons and so ab initio calculations on these molecules would take a long time to compute. In this section a 'pseudo-potential' function will be used to model the core electrons of the atoms, rather than treat them individually, but valence electrons will be interpreted independently as usual.
TlBr3 was modelled in Gaussview. The point group of the molecule was restricted to D3H symmetry, with very tight tolerance. This is done because this molecule is at higher risk of breaking symmetry. The optimisation parameters were then set-up:
# opt b3lyp/lanl2dz geom=connectivity
The LAN12DZ basis set is used in this case so as to implement pseudo-potentials in heavier elements.
The resulting .log output file was viewed in Gaussview and Wordpad (post-frequency analysis available here), yielding the following information.
|
| ||||||||||||||||||||||||||||||||||||||||||||||||||
Convergence was confirmed by: the very small final RMS gradient obtained, presence of all 'YES' results in the convergence analysis in the output file and the absence of significant negative frequencies in the frequency analysis.
Frequency analysis enumerates the energies required to resonate the specific vibrational modes of the molecule. When the molecule is at its equilibrium structure, at the global minimum of the potential energy surface, these vibrations distort the molecule from equilibrium and hence require energy input. When the molecule is not at equilibrium at the minimum of the potential energy surface, vibrational distortions in the molecule can either: rise up the PES, going further from equilibrium, or move down the PES, moving closer to the real equilibrium structure. These distortions towards equilibrium are favourable and so the energies computed are negative. Therefore, frequency analysis can be used to indicate whether the molecule is truly at the global minimum equilibrium structure, indicating if optimisation has been successfully obtained.
The low frequencies are shown in the table above to range from -3.4 to 3.94, these are not 'real' vibrational frequencies; the lowest 'real' frequency is 46 cm-1, which is one order of magnitude higher than the highest 'imaginary' frequency.
The same basis set must be used for frequency analysis as what was used in optimisation so that the analysis refers specifically to our optimised structure. Were a different basis set to be used, one would likely obtain negative frequencies from the frequency analysis because the global minimum for one basis set may not be the same as for another, hence frequency analysis would result in incorrect results for what was intended.
All analysis indicates that the structure was fully optimised under the B3LYP/LANL2DZ method. The obtained structure had a Tl-Br bond distance of 2.65 Å and a Br-Tl-Br bond angle of 120°. The structure of TlBr3 was studied by X-ray diffraction by Glaser and Johansson[3] in aqueous solution, where it was found that the compound adopts a trigonal planar structure with bond lengths of 2.512 Å. This structure is consistent with the bond angles here of 120°. The Tl-Br bond length of 2.65 Å has an error of 5.2%, where 0.4% of this is contributed by uncertainties derived from the computational calculations[4]. The remainder of this error comes from the unrealistic approximation of the nature of the TlBr3 compound, whereby Gaussian regards this as an isolated gas phase molecule with neglected intermolecular interactions. The literature compared involved TlBr3 in aqueous solution, where it is mentioned that two molecules are probably bonded to form a trigonal bipyramidal structure. This would result in a higher electron density on the thallium d-orbitals, contraction of the orbitals, better overlap between the thallium and bromide orbitals (which already have poor overlap due to the large size difference) and hence a lower bond length.
Cis/trans isomerism in a Molybdenum complex
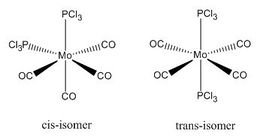
The complex Mo(PPh33)2(CO)4 can exist in two isomeric forms: cis and trans. These two isomers have different symmetries and hence there will be a difference between the Infrared Vibrational Spectra, notably the number of bands corresponding to the CO stretches.
Due to the computational strain of using phenyl groups in the phosphine ligands, these were replaced with chlorine groups, which have been shown[5] to have similar contributions towards the bonding of the overall phosphine group to the metal centre as phenyl does when triphenylphosphine is used. Each isomer was modeled in Gaussian and optimisation was performed three times using improving basis sets each time. Analysis of the vibrational frequencies was then performed to confirm optimisation and obtain IR spectroscopic details of the complexes.
Optimisation
Initial optimisation, Method 1, was performed using the LANL2MB low level basis set and psuedo-potential with loose convergence criteria.
# opt=loose b3lyp/lanl2mb geom=connectivity
In order to improve on this geometry, the chlorine atoms on the phosphine ligand were rotated around the P-Mo bond using predetermined optimum torsion angles. The basis set was also improved to LANL2DZ, which is a much better basis set and pseudo-potential. The convergence criteria was also tightened because of this improved basis set, using a more accurate numerical integral grid and setting the SCF convergence criteria to 10-9 a.u., which is about 7 orders of magnitude tighter[6] than the "opt=loose" criterion[7]. This new method, Method 2, used the following parameters:
# opt b3lyp/lanl2dz geom=connectivity int=ultrafine scf=conver=9
The output files of the previous optimisations however contain the following message: "Warning! P atom 10 may be hypervalent but has no d functions". To further improve on the accuracy of the calculation, d-orbital functions were included as an extra basis to the calculation. This final method, Method 3, used the following parameters:
# opt b3lyp/lanl2dz geom=connectivity int=ultrafine scf=conver=9 extrabasis

...

P 0
D  1  1.0
0.55  0.100D+01
****
A summary of the output from these three optimisations is shown in the table below.
| Method 1 | Method 2 | Method 3 | ||||
| Cis | Trans | Cis | Trans | Cis [8] | Trans[9] | |
| Output type | .log | .log | .log | |||
| Calc. type | FOPT | FOPT | FOPT | |||
| Calc. method | RB3LYP | RB3LYP | RB3LYP | |||
| Basis set | LANL2MB | LANL2DZ | Gen (LANL2DZ + P dAO) | |||
| Dipole moment | 8.49 | 0 | 1.31 | 0.31 | 0.07 | 0.23 |
| Point group | C1 | C1 | C1 | C1 | C1 | C1 |
| RMS gradient | 0.000286 | 0.0000621 | 0.0000153 | 0.0000370 | 0.0000528 | 0.0000012 |
| Energy / a.u. | -617.53 | -617.52 | -623.58 | -623.58 | -623.69 | -623.69 |
| CPU time | 0:10:19 | 0:07:25 | 0:57:06 | 0:46:57 | 0:32:28 | 1:07:46 |
| Mo-C length / Å | 2.06 (ax) 2.11 (eq) | 2.11 | 2.06 (ax) 2.01 (eq) | 2.06 | 2.06 (ax) 2.02 (eq) | 2.06 |
| Mo-P length / Å | 2.53† | 2.48† | 2.51† | 2.45 | 2.48 | 2.42 |
| Structure | ||||||
The bond lengths marked '†' show no 'visible' bond when viewed in Gaussivew. They do however form a bond, this is just a feature of Gaussview. A 'bond' can be considered the mutual sharing of electron density between two atoms. This interaction results in a lowering of energy of the molecular orbital that involves these atoms as the electrons become delocalised rather than localised around the nucleus.
Frequency analysis
|
| ||||||||||||||||||||||||||||||||||||||||||||||||||||||||||||||||||||
The cis isomer has four IR-active signals however with two being degenerate, hence three signals are seen. The trans isomer has one IR active stretch and so one signal is seen. This is consistent with the known experimental results for the IR spectra of complexes of this symmetry.
Mini project - Investigating the cage structure of S4N4
Introduction
 | ||
|
|
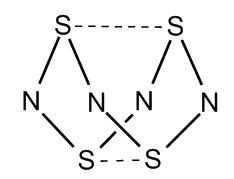
Tetrasulphur tetranitride is known to adopt a 'cage' like structure rather than the possible planar structure. Were the structure to be planar, the sp2 sulphur and nitrogen would each have a pz orbital orientated perpendicular to the ring, with the nitrogen pz orbital containing 1 electron and the sulphur pz orbital containing 2 electrons. This would result in a delocalised π-system containing 12 electrons. At first this may appear to be a stabilised structure (sterically and electronically), however MO calculations can prove the electronic preference of the cage structure.[12] This phenomenon will be proved by calculation of the molecular orbitals of both the planar and cage structure, while investigating the effect of different basis sets and variations in restrictions in the open-shell wavefunctions.
The two structures were created in Gaussview, being modified to their approximately correct geometry prior to optimisation. Simple Linear Combination of Atomic Orbitals of the pz orbitals and estimated effect of 'folding' into the cage structure yielded the conclusion that in the planar structure the HOMO is a set of doubly degenerate orbitals, hence exists in a triplet state. The cage structure will exist in the singlet state due to stabilisation of the planar LUMO during folding, thus becoming the HOMO of the cage structure. This assumption is made and tested herein. Due to there being the unpaired electrons the default wavefunction shell is 'unrestricted', resulting in the segregation of the paired electrons into alpha and beta states; 'restricted' shell wavefunctions cannot be used for triplet states as this requires pairing of all orbitals. This unrestricted wavefunction is more efficient but suffers from 'spin contamination' because the wavefunction is no longer an eigenfunction of the total spin <S2>[13]. A 'restricted open-shell' wavefunction erradicates the problem of spin contamination but has an extra cost of CPU time for calculation. Hence all calculations were done using a restricted open-shell wavefunction, however a comparison to using the unrestricted wavefunction is detailed below.
Optimisation
Initial tests on the effect of the basis set on the energies and bond lengths were performed by optimising by the B3LYP method, using the 6-31G and 6-311G basis sets.
| Planar | Cage | ||||||||
| Basis set | 6-31G(d) | 6-31+G(d) | 6-311G(d) | 6-311+G(d) | 6-31+G(d) | 6-31G(d) | 6-31+G(d) | 6-311G(d) | 6-311+G(d) |
| Calc. method | ROB3LYP | UB3LYP | RB3LYP | ||||||
| Spin | Triplet | Singlet | |||||||
| Energy / a.u. | -1811.54 | -1811.56 | -1811.70 | -1811.72 | -1811.56 | -1811.56 | -1811.57 | -1811.71 | -1811.73 |
| Point group | D4h | D4h | D4h | D4h | D4h | C1 | C1 | C1 | C1 |
| CPU time | 0:02:32 | 0:01:07 | 0:04:10 | 0:07:31 | 0:05:51 | 0:13:24 | 0:24:26 | 0:20:49 | 0:39:58 |
| S-N length / Å | 1.62 | 1.62 | 1.61 | 1.61 | 1.62 | 1.65 | 1.65 | 1.64 | 1.64 |
| S-S distance / Å | na | na | na | na | na | 2.87 | 2.87 | 2.87 | 2.87 |
As can be seen there is a very small change in properties of the structures when the basis set is varied. Changes in 'unrestricted' and 'restricted open shell' wavefunctions equally do not vary the 'macroscopic' properties of energy and bond lengths by a significant amount. However it was found that the energies of the Molecular Orbitals, calculated later on, varied noticeably with the method used.
The S-S bond distance formed as a result of the cage structure is in good agreement with other calculations[14] but in poor agreement with experimental X-ray crystallographic data[15].
Frequency analysis of the planar structure contained negative frequencies, which is expected due to the mentioned hypothesis of a stabilisation in folding from the planar structure to the cage structure. The planar structure is minimised to a valid minimum, but this is not the global minimum. Therefore these negative vibrations refer to favourable out-of-plane bends in the direction of cage-formation. Frequency analysis of the cage structure yielded all real frequencies, hence confirming successful structural optimisation.
Bonding picture
 |
 |
The bonding in S4N4 is of interest because the sulphur and nitrogen do not have a full octet. An analysis into the Natural Bond Orbitals of the structures was conducted as part of the 'Energy' job in Gaussian. The full job parameters were:
# rob3lyp/6-31+g(d) pop=(nbo,full) geom=connectivity
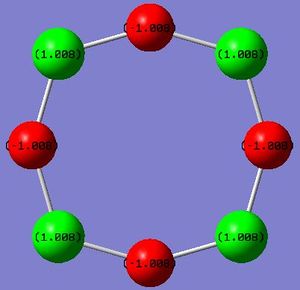
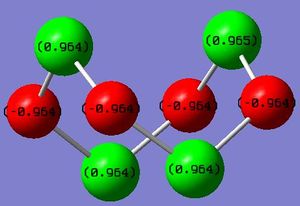
Observation of the calculated charges on the atoms is shown graphically on the right. As can be seen, the atoms alternate between strongly electron poor (sulphur) and eletron rich (nitrogen); they can be considered to alternate between formal +1 and -1 charges. By performing the natural population analysis on the planar structure, shown below, a deeper picture on how the 'octet' is satisfied is revealed. It can be seen that the nitrogen atoms, which in an isolated atomic state has 5 valence electrons, have a valence electron count of ~6. This increase in 1 electron is offset by the loss of one in sulphur. Elemental sulphur has the ground-state electron configuration: 1s22s22p63s23p4 and Nitrogen has 1s22s22p3; two extra electrons can be assumed to be part of the valence shell as part of the 2 valence bonds with sulphur, hence this additional increase in 1 electron in the valence shell population of nitrogen results in a full octet and so additional stabilisation. Nitrogen has preference in this case to fill its octet due to its higher electronegativity compared to sulphur.
Summary of Natural Population Analysis:

                                       Natural Population
                Natural  -----------------------------------------------
    Atom  No    Charge         Core      Valence    Rydberg      Total
 -----------------------------------------------------------------------
      S    1    1.00777      9.99888     4.89699    0.09636    14.99223
      S    2    1.00777      9.99888     4.89699    0.09636    14.99223
      S    3    1.00777      9.99888     4.89699    0.09636    14.99223
      S    4    1.00777      9.99888     4.89699    0.09636    14.99223
      N    5   -1.00777      1.99973     5.98928    0.01875     8.00777
      N    6   -1.00777      1.99973     5.98928    0.01875     8.00777
      N    7   -1.00777      1.99973     5.98928    0.01875     8.00777
      N    8   -1.00777      1.99973     5.98928    0.01875     8.00777
Information on the Natural Bond Orbitals is given in the output extract below. The hypothetical bonding picture involves a delocalised π-system and so S-N bonds of equal length. As can be seen below, the 3 bonds shown each have the same characteristics: 66% contribution from nitrogen and 34% from sulphur, each with consistent s/p character.
(Occupancy)   Bond orbital/ Coefficients/ Hybrids
 ---------------------------------------------------------------------------------
     1. (0.98995) BD ( 1) S   1 - N   6
                ( 34.30%)   0.5857* S   1 s( 15.45%)p 5.38( 83.08%)d 0.09(  1.47%)
                                            0.0000 -0.0003 -0.3850  0.0792  0.0048
                                           -0.0009  0.0001 -0.0745  0.0602 -0.0023
                                           -0.0001 -0.9025  0.0845  0.0020  0.0000
                                            0.0000  0.0000  0.0000 -0.0121  0.0000
                                            0.0000  0.1108  0.0472
                ( 65.70%)   0.8106* N   6 s( 31.86%)p 2.14( 68.03%)d 0.00(  0.11%)
                                            0.0000 -0.5644  0.0017  0.0034 -0.0005
                                            0.4254  0.0032 -0.0025  0.7063  0.0218
                                           -0.0044  0.0000  0.0000  0.0000 -0.0260
                                            0.0000  0.0000  0.0083  0.0198
     2. (0.98995) BD ( 1) S   1 - N   7
                ( 34.30%)   0.5857* S   1 s( 15.45%)p 5.38( 83.08%)d 0.09(  1.47%)
                                            0.0000  0.0003  0.3850 -0.0792 -0.0048
                                            0.0009 -0.0001 -0.9025  0.0845  0.0020
                                            0.0001 -0.0745  0.0602 -0.0023  0.0000
                                            0.0000  0.0000  0.0000  0.0121  0.0000
                                            0.0000  0.1108 -0.0472
                ( 65.70%)   0.8106* N   7 s( 31.86%)p 2.14( 68.03%)d 0.00(  0.11%)
                                            0.0000  0.5644 -0.0017 -0.0034  0.0005
                                            0.7063  0.0218 -0.0044  0.4254  0.0032
                                           -0.0025  0.0000  0.0000  0.0000  0.0260
                                            0.0000  0.0000  0.0083 -0.0198
     3. (0.98995) BD ( 1) S   2 - N   5
                ( 34.30%)   0.5857* S   2 s( 15.45%)p 5.38( 83.08%)d 0.09(  1.47%)
                                            0.0000 -0.0003 -0.3850  0.0792  0.0048
                                           -0.0009 -0.0001 -0.9025  0.0845  0.0020
                                            0.0001 -0.0745  0.0602 -0.0023  0.0000
                                            0.0000  0.0000  0.0000 -0.0121  0.0000
                                            0.0000 -0.1108  0.0472
                ( 65.70%)   0.8106* N   5 s( 31.86%)p 2.14( 68.03%)d 0.00(  0.11%)
                                            0.0000 -0.5644  0.0017  0.0034 -0.0005
                                            0.7063  0.0218 -0.0044  0.4254  0.0032
                                           -0.0025  0.0000  0.0000  0.0000 -0.0260
                                            0.0000  0.0000 -0.0083  0.0198
In the case of the cage structure the Natural Population Analysis yielded the following output.
Summary of Natural Population Analysis:

                                       Natural Population
                Natural  -----------------------------------------------
    Atom  No    Charge         Core      Valence    Rydberg      Total
 -----------------------------------------------------------------------
      S    1    0.96379      9.99902     4.94944    0.08775    15.03621
      S    2    0.96487      9.99902     4.94823    0.08788    15.03513
      S    3    0.96436      9.99902     4.94879    0.08783    15.03564
      S    4    0.96415      9.99902     4.94904    0.08778    15.03585
      N    5   -0.96440      1.99972     5.93380    0.03088     7.96440
      N    6   -0.96423      1.99972     5.93362    0.03088     7.96423
      N    7   -0.96416      1.99972     5.93356    0.03088     7.96416
      N    8   -0.96437      1.99972     5.93378    0.03087     7.96437
In this case, the 'movement of one electron' as observed for the planar structure occurs to a minutely smaller extent, as can be seen by the total electron count at being 7.96 for nitrogen. Details of the Bond Orbitals is shown below.
       (Occupancy)   Bond orbital/ Coefficients/ Hybrids
 ---------------------------------------------------------------------------------
     1. (1.56126) BD ( 1) S   1 - S   2
                ( 21.24%)   0.4609* S   1 s( 14.31%)p 3.90( 55.83%)d 2.09( 29.86%)
                                            0.0000  0.0006  0.1043  0.3577  0.0654
                                            0.0070  0.0002  0.4333 -0.0203 -0.0563
                                           -0.0002  0.5555  0.2176 -0.0190 -0.0003
                                            0.0870 -0.0065 -0.0550  0.3240 -0.0348
                                            0.2857 -0.2192  0.2504
                ( 78.76%)   0.8875* S   2 s(  0.76%)p99.99( 98.95%)d 0.38(  0.29%)
                                            0.0000  0.0004 -0.0110  0.0862  0.0027
                                            0.0015 -0.0001 -0.5956 -0.0323  0.0057
                                           -0.0001 -0.7027 -0.0380  0.0067 -0.0002
                                            0.3714 -0.0213 -0.0055  0.0514 -0.0042
                                           -0.0049 -0.0085 -0.0127
     2. (1.92583) BD ( 1) S   1 - N   6
                ( 35.50%)   0.5958* S   1 s( 15.50%)p 5.10( 79.05%)d 0.35(  5.46%)
                                            0.0000  0.0002  0.3527 -0.1724 -0.0283
                                           -0.0018  0.0001  0.7284 -0.0324  0.0157
                                            0.0000 -0.2356 -0.0047 -0.0005 -0.0001
                                           -0.4498  0.0083  0.0270 -0.1452 -0.0654
                                           -0.0724  0.1225 -0.0947
                ( 64.50%)   0.8031* N   6 s( 17.77%)p 4.62( 82.02%)d 0.01(  0.21%)
                                           -0.0001  0.4208 -0.0242  0.0058 -0.0010
                                           -0.3059 -0.0282 -0.0003  0.5436 -0.0106
                                           -0.0098  0.6555  0.0198  0.0026 -0.0189
                                           -0.0163  0.0310 -0.0200 -0.0123
     3. (1.72241) BD ( 2) S   1 - N   6
                ( 15.92%)   0.3990* S   1 s(  9.95%)p 6.41( 63.83%)d 2.63( 26.22%)
                                            0.0000 -0.0003 -0.2088 -0.2281 -0.0620
                                           -0.0051 -0.0003  0.3693  0.0652  0.0503
                                            0.0009  0.3968 -0.1714  0.0108  0.0002
                                            0.5525 -0.0266  0.0466 -0.2476  0.0462
                                           -0.2813  0.2105 -0.2744
                ( 84.08%)   0.9170* N   6 s(  0.25%)p99.99( 99.55%)d 0.82(  0.20%)
                                            0.0006 -0.0471  0.0156  0.0019 -0.0001
                                            0.9073  0.0047  0.0025  0.0517  0.0056
                                            0.0003  0.4118 -0.0055 -0.0025  0.0389
                                            0.0012  0.0190 -0.0120  0.0039
What can be immediately noticed is the S-S bonds listed as entries 1 and 2 above. No S-S bonds were formally drawn, indicating the presence of a weak bond created by the overlap of the molecular orbitals on the sulphurs.
Molecular Orbitals
The molecular orbitals were of key interest in this project, and how folding from the planar structure into the cage structure resulted in a stabilisation. The calculated orbitals (for cage[16] and planar [17]) were compiled into a correlation diagram to show how the orbital energies changed with the transition from D4h symmetry to D2d symmetry. This diagram is shown below.
 |
As can be seen, the cage structure is highly favoured because of the vast stabilisation of the a2u level in the planar structure when folding into the cage structure occurs. This phenomenon is an example of a Jahn-Teller distortion, whereby a distortion occurs to remove the degeneracy of the ground state.
References
- ↑ Studt et al., Science, 2008, 320, 1320; DOI:10.1126/science.1156660
- ↑ M. S. Schuurman, W. D. Allen, H. F. Schaefer III, J. Comput. Chem., 2005, 26, 1106; DOI:10.1002/jcc.20238
- ↑ J. Glaser, G. Johansson, Acta Chem. Scand., Ser. A, 1982, 36, 125; DOI:10.3891/acta.chem.scand.36a-0125
- ↑ P. Hunt, Computational Inorganic Chemistry - Accuracy, London, http://www.huntresearchgroup.org.uk/teaching/teaching_comp_lab_year3/8a_accuracy.html (accessed February 2012)
- ↑ T. M. Trnka, Ph.D. thesis, California Institute of Technology, 2003.
- ↑ Convergence in Hartree-Fock calculations, http://www.cup.uni-muenchen.de/ch/compchem/energy/hf2.html (accessed February 2012)
- ↑ Gaussian 09 User's Reference - G09 Keywords: Opt, http://www.gaussian.com/g_tech/g_ur/k_opt.htm (accessed February 2012)
- ↑ http://hdl.handle.net/10042/to-12192
- ↑ http://hdl.handle.net/10042/to-12193
- ↑ http://hdl.handle.net/10042/to-12194
- ↑ http://hdl.handle.net/10042/to-12195
- ↑ D. Shriver and P. Atkins, in Shriver & Atkins Inorganic Chemistry, W. H. Freeman & Company, United States, 4th edn., 2006
- ↑ IUPAC Compendium of Chemical Terminology, Oxford, http://goldbook.iupac.org/ST07103.html (accessed February 2012)
- ↑ G. Chung, D. Lee, J. Mol. Struct.: THEOCHEM, 2002, 582, 85
- ↑ M. L. DeLucia, P. Coppens, Inorg. Chem., 1978, 17, 2336
- ↑ http://hdl.handle.net/10042/to-12190
- ↑ http://hdl.handle.net/10042/to-12191


