Rep:Mod:LJ4717 INORGANIC
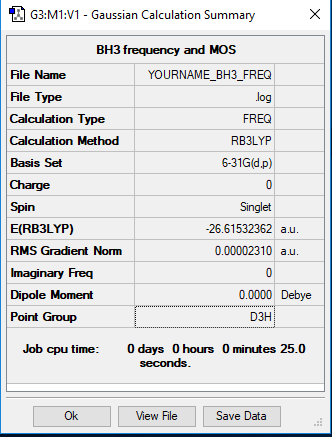
BH3 Molecule
Basis Set
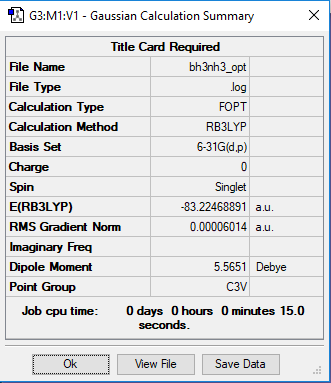
B3LYP/6-31G(d,p)
item
       Item               Value     Threshold  Converged?
Maximum Force            0.000004     0.000450     YES
RMS     Force            0.000002     0.000300     YES
Maximum Displacement     0.000017     0.001800     YES
RMS     Displacement     0.000008     0.001200     YES
low frequency table
Low frequencies ---  -11.7227  -11.7149   -6.6070    0.0002    0.0278    0.4278
Low frequencies --- 1162.9743 1213.1388 1213.1390
Frequency Link
Frequency file: Media:BH3S_L_FRQ.LOG
summary
Jmol 3D Model
BH3 Molecule |
6 vibrations
| wavenumber (cm-1 | Intensity (arbitrary units) | symmetry | IR active? | type |
| 1163 | 92.6 | A2 | yes | out-of-plane bend |
| 1213 | 14.1 | E | yes | bend |
| 1213 | 14.1 | E | yes | bend |
| 2583 | 0 | A1 | no | symmetric stretch |
| 2716 | 126.3 | E | yes | asymmetric stretch |
| 2716 | 126.3 | E | yes | symmetric stretch |
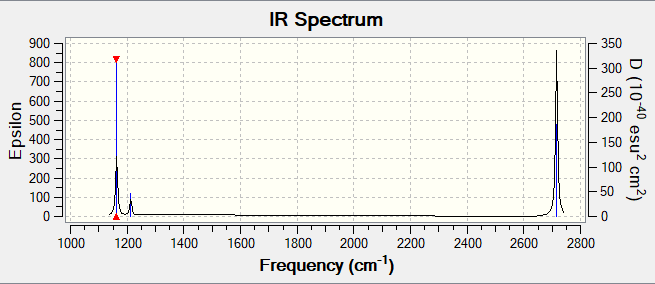
spectrum
Questions
Question:In your wiki explain why are there less than six peaks in the spectrum, when there are obviously six vibrations.
Answer:As can be seen on the spectrum, there are only 3 peaks although there are 6 vibration modes in total. Bending mode 2 and 3 are degenerated as stretching mode 5 and 6 are degenerated,which corresponds to 2 peaks on spectrum. However, mode 4 is not IR active because there is no dipole moment. The vibration mode 1 corresponds to another peak, therefore, only 3 peaks shown in the spectrum.
Good identification of both reasons and explained in relation to the peaks. Just note that the IR intensities in the table should be left to the nearest whole number and you would describe the modes as degenerate and not degenerated. Smf115 (talk) 14:56, 2 June 2019 (BST)
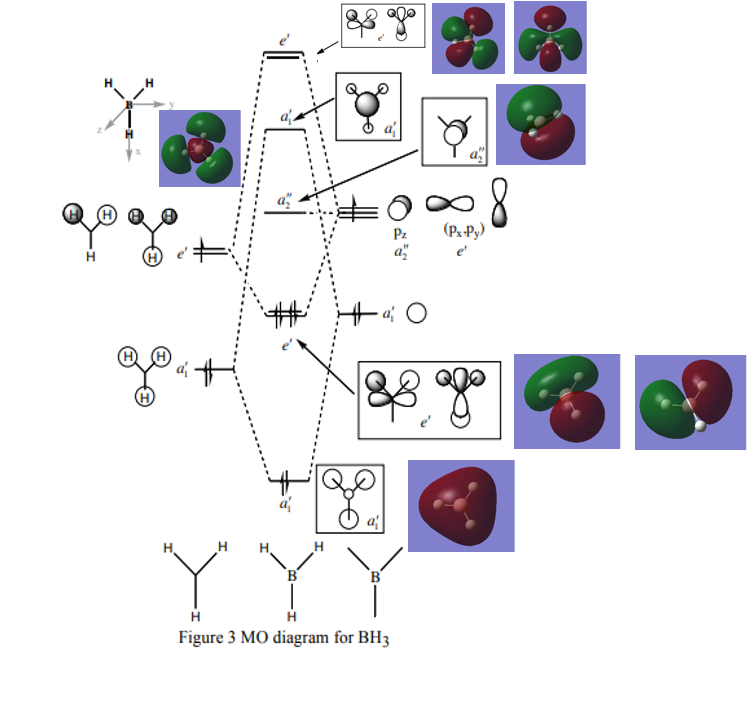
MO diagram
Reference: http://www.huntresearchgroup.org.uk/teaching/teaching_comp_lab_year2a/Tut_MO_diagram_BH3.pdf
Questions
Question:Are there any significant differences between the real and LCAO MOs? What does this say about the accuracy and usefulness of qualitative MO theory?
Answer:LCAO MOs represents the time-averaged electron distribution around an molecule but it is dynamic in reality.The LCAO MOs theory is consistent with the occupied and non-bonding MOs but not for unoccupied MOs.
Good inclusion of the calculated MOs on to the MO diagram. Your discussion isn't very clear though (e.g. are you implying that the calculated MOs are dynamic?) and you haven't really compared the calculated and LCAO MOs. For example, how do the LCAOs differ from the calculated unoccupied MOs, which MOs in the diagram show this? Smf115 (talk) 15:03, 2 June 2019 (BST)
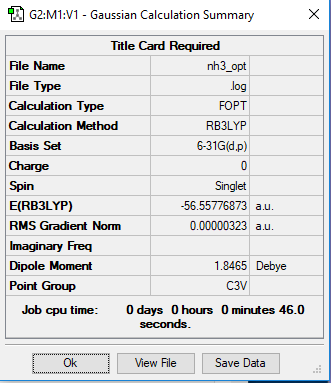
NH3 Molecule
Basis Set
B3LYP/6-31G(d,p)
item
Item               Value     Threshold  Converged?
Maximum Force            0.000006     0.000450     YES
RMS     Force            0.000004     0.000300     YES
Maximum Displacement     0.000012     0.001800     YES
RMS     Displacement     0.000008     0.001200     YES
summary table
Low Frequencies Table
Low frequencies --- -426.7361 -426.7361 -386.4702   -0.0018   -0.0017    0.0009
Low frequencies ---  789.8268 1652.9579 1652.9579
These are very high low frequencies! The frequency log file submitted is also not converged so something has gone wrong somewhere, the summary table above should have also been of the final frequency calculation and not the optimisation. Smf115 (talk) 15:05, 2 June 2019 (BST)
jmol diagram
NH3 Molecule |
Frequency Link
Frequency file: Media:NH3_FRE_LJ.LOG
NH3BH3 Molecule
Basis Set
B3LYP/6-31G(d.p.)
summary table
item
Item               Value     Threshold  Converged?
Maximum Force            0.000122     0.000450     YES
RMS     Force            0.000058     0.000300     YES
Maximum Displacement     0.000540     0.001800     YES
RMS     Displacement     0.000297     0.001200     YES
low frequency
Low frequencies ---   -0.0614   -0.0457   -0.0065   21.6948   21.7007   40.6047
Low frequencies ---  266.0399  632.3710  640.1443
jmol image
NH3BH3 Molecule |
Frequency Link
Frequency file: Media:NH3BH3_FREQ_lj.LOG
Association energy
E(NH3)=-56.55776873 a.u.
E(BH3)=-26.61532362 a.u.
E(NH3BH3)=-83.22468891 a.u.
ΔE= E(NH3BH3)-[E(NH3)+E(BH3)]
 = -83.22468891-(-56.55776873-26.61532362) a.u.
 = -0.05159656 a.u.
 = -0.05159656*2625.5 kJ/mol
 = -135.46676828 kJ/mol
Question
Question:Based on your energy calculation is the B-N dative bond weak, medium or strong? What comparison have you made to come to this conclusion?
Answer:B-N covalent bond energy is 389 KJ/mol,which is much greater than our calculated value(135KJ/mol).That means the B-N dative bond is weaker than B-N covalent bond.
Correct calculation and good comparison made. Just note the accuracy of final reported energy values should be 5 d.p. for a.u. and the nearest 1 for kJmol-1 and literature values should be referenced! Smf115 (talk) 15:10, 2 June 2019 (BST)
NI3 Molecule
summary table
item
Item               Value     Threshold  Converged?
Maximum Force            0.000084     0.000450     YES
RMS     Force            0.000062     0.000300     YES
Maximum Displacement     0.001108     0.001800     YES
RMS     Displacement     0.000520     0.001200     YES
low frequency
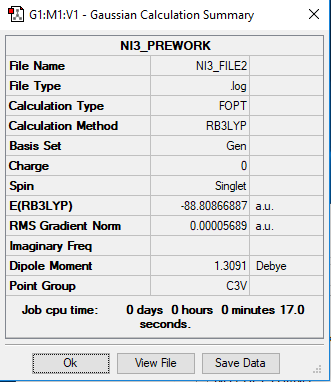
Low frequencies ---   -1.7762   -1.7378   -0.7557   -0.0031    0.0322    0.0731
Low frequencies ---  101.3565  101.3572  148.4310
Frequency Link
Frequency file: Media:NI3_FREQ_lj.LOG
Jmol image
NI3 Molecule |
Frequency Link
Frequency file: Media:NI3_FREQ_lj.LOG
Questions
Q: What is your optimised N-I distance?
Answer: 2.18
mini project:[N(CH3)4]+ Ion
Basis Set
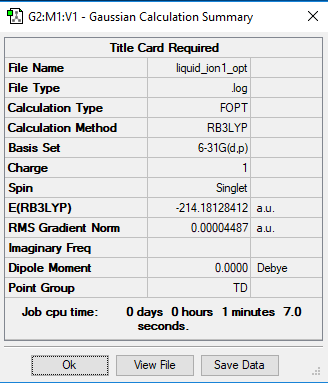
B3LYP/6-31G(d.p.)
item
Item               Value     Threshold  Converged?
Maximum Force            0.000068     0.000450     YES
RMS     Force            0.000027     0.000300     YES
Maximum Displacement     0.000151     0.001800     YES
RMS     Displacement     0.000067     0.001200     YES
summary
low frequency
Low frequencies ---   -0.0011   -0.0009   -0.0008   22.7128   22.7128   22.7128
Low frequencies ---  190.7452  294.0628  294.0628
Jmol image
[N(CH3)4]+ Ion |
frequency link
Frequency file: Media:LIQUID_ION1_FREQ.LOG
mini project:[P(CH3)4]+ Ion
Basis Set
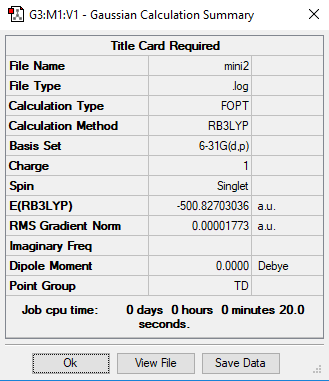
B3LYP/6-31G(d.p.)
summary
item
Item               Value     Threshold  Converged?
Maximum Force            0.000036     0.000450     YES
RMS     Force            0.000014     0.000300     YES
Maximum Displacement     0.000126     0.001800     YES
RMS     Displacement     0.000050     0.001200     YES
low frequency
Low frequencies ---   -0.0018    0.0026    0.0032   25.3789   25.3789   25.3789
Low frequencies ---  161.5279  195.9707  195.9707
frequency link
Frequency file: Media:P_IONS_FREQ.LOG
Jmol IMAGE
[P(CH3)4]+ Ion |
Mini project:Charge Distribution
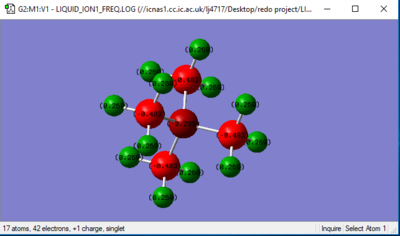
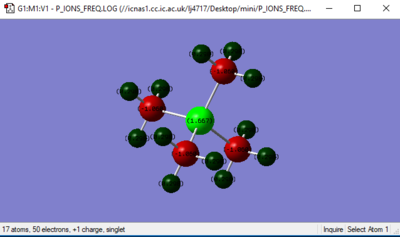
In [N(CH3)4]+] ion:
Charge on N = -0.295
Charge on C = -0.483
Charge on H = +0.269
In [P(CH3)4]+] ion:
Charge on P = +1.664
Charge on C = -1.060
Charge on H = +0.298
As can be seen above,the positive charge is located on the centre ion in [P(CH3)4]+] ion(p atom in this case), but it is not located on the N atom in [N(CH3)4]+] ion.Normal case is the positive charge lies on centre ion,however,that does not work for [N(CH3)4]+] ion. This is because nitrogen is more electronegative than hydrogen, so the positive charge tends to locate on Hydrogen.
Correct NBO charges calculated, however, you charge analysis is minimal and only contains a very basic argument considering electronegativity. It would have been nice to see more detail and also a uniform charge range should have been used across both ILs. Smf115 (talk) 21:07, 4 June 2019 (BST)
Q1:What does the "formal" positive charge on the N represent in the traditional picture?
 It means there is a dative bond between one of the N and H. The lone pair of electrons in
 nitrogen are both shared in the dative covalent bond.Result of positive charge on nitrogen
 is due to loss of electrons.
Q2:On what atoms is the positive charge actually located for this cation?
Hydrogen atoms carry the positive charge.
Clear identification of where the positive charge actually sites. To improve, you need to consider formal electron counting to explain how the +1 formal charge is calculated in the traditional picture. Smf115 (talk) 21:07, 4 June 2019 (BST)
Mini project:MOs
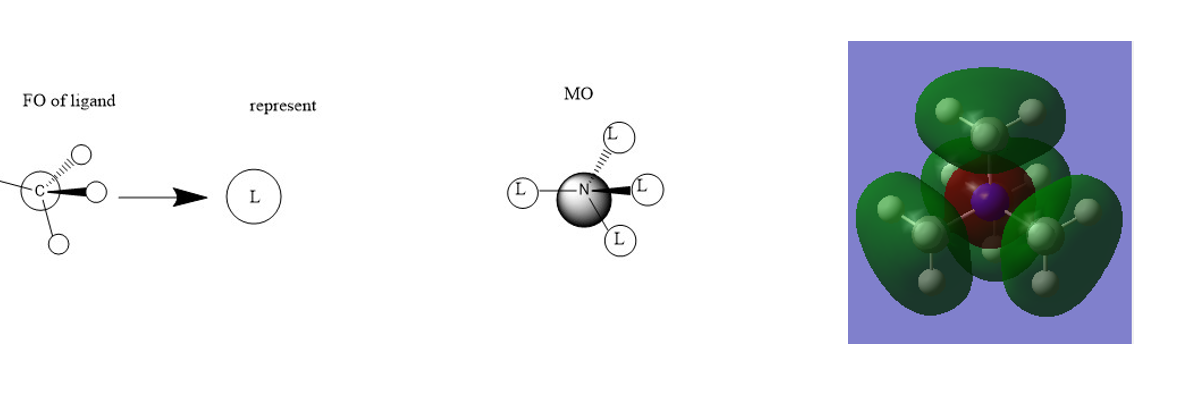
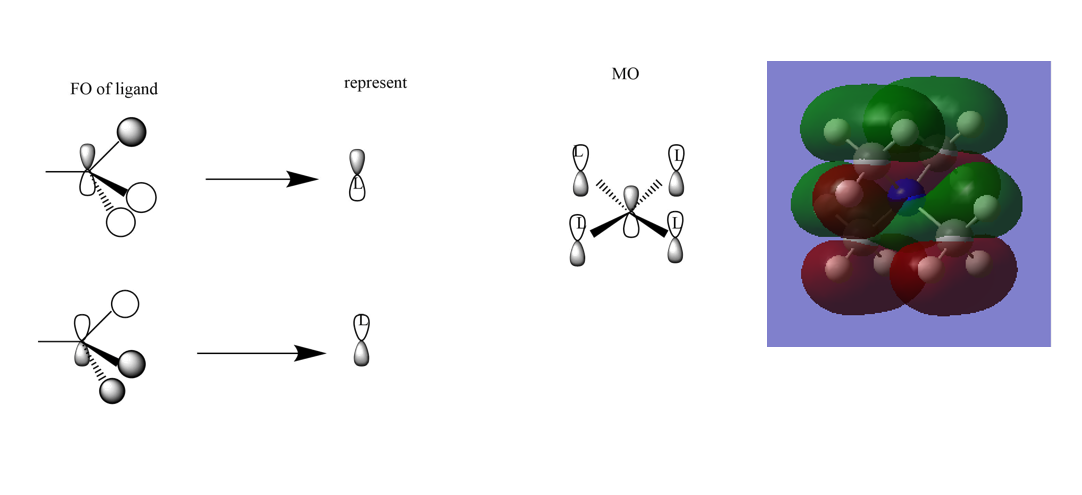
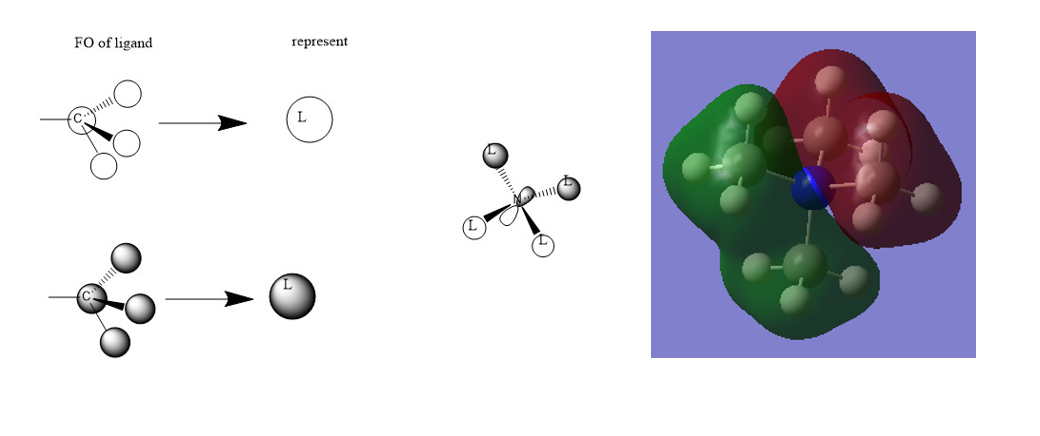
Correct FOs and a nice range of MOs selected. It would have been better to draw the LCAOs consistently and to have made some attempt at evaluating the character of the MOs and justifying it from the main interactions in the MO. Smf115 (talk) 21:10, 4 June 2019 (BST)
Overall, an ok report which could be improved by some more consideration in the analysis parts. Smf115 (talk) 21:10, 4 June 2019 (BST)

