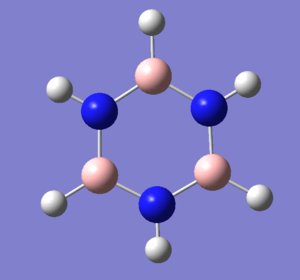
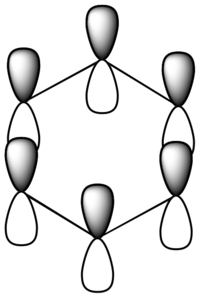
Rep:Mod:LE110
Computational Analysis of Borane
Optimising a Molecule of BH3
During an optimisation calculation there are two essential steps that take place; the first step uses the Schrodinger equation to solve for the electron density and the energy of the system for the fixed nuclei B and H. The second step in the calculation solves for the position of the nuclei this occurs by small changes in the nuclei position, this causes a change in the geometry of the system, the Schrodinger equation is then solved for each incremental change in nuclei position and continues until the minimum energy of the system is found. These calculations are computed using gaussview and the results are also analyzed in this software.
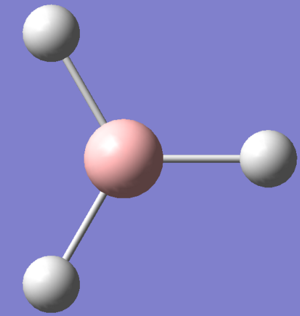
The optimisation of a planar BH3 molecule using gaussview has been completed and analyzed. The borane structure was created using the periodic table button and viewed using the molecule viewer window. All three B-H bond lengths were fixed to 1.5 Angstom (A). The calculation is set-up under Gaussian Calculation Setup, the job type is selected as an optimisation using method DFT, B3LYP and basis set 3-21G. This first calculation is solved by gaussian very fast as the basis set 3-21G is of low accuracy. The log file for the optimised borane molecule using the 3-21G basis set is linked here.
To check that the operation calculation has completed the .log file has been opened and the optimisation was then checked for convergence. When convergence occurs this means that the forces have converged which is the gradient of the energy against distance graph, this also shows that the energy no longer changes with small changes in nuclei positions and therefore geometry. The data below also shows the calculated bond angles and bond lengths, these can also be found using the inquire button in gaussview, this data can also be indicative of calculation completion and a comparison to literature is also helpful.
The table below shows the convergence, optimised Bond Angle of H-B-H 120.0 degrees (ο) and optimised Bond Length of B-H 1.19 Angstroms (Å) .
       Item               Value      Threshold   Converged?
Maximum Force            0.000413     0.000450     YES
RMS     Force            0.000271     0.000300     YES
Maximum Displacement     0.001610     0.001800     YES
RMS     Displacement     0.001054     0.001200     YES
Predicted change in Energy=-1.071764D-06
Optimization completed.
   -- Stationary point found.
                          ----------------------------
                          !   Optimized Parameters   !
                          ! (Angstroms and Degrees)  !
--------------------------                            --------------------------
! Name  Definition              Value          Derivative Info.                !
--------------------------------------------------------------------------------
! R1    R(1,2)                  1.1935         -DE/DX =    0.0004              !
! R2    R(1,3)                  1.1935         -DE/DX =    0.0004              !
! R3    R(1,4)                  1.1935         -DE/DX =    0.0004              !
! A1    A(2,1,3)              120.0            -DE/DX =    0.0                 !
! A2    A(2,1,4)              120.0            -DE/DX =    0.0                 !
! A3    A(3,1,4)              120.0            -DE/DX =    0.0                 !
! D1    D(2,1,4,3)            180.0            -DE/DX =    0.0                 !
--------------------------------------------------------------------------------
Progression of the calculation of borane by using a better basis set increases the accuracy of the optimisation calculation although it now takes longer for the calculation to complete in gaussview. The basis set used for the following calculation was 6-31G(d, p). The log file for the optimised borane molecule using the 6-31G(d,P) is linked to here.
| File Name | BH3_OPT_631G_DP |
| File Type | .log |
| Calculation Type | FOPT |
| Calculation Method | RB3LYP |
| Basis Set | 6-31G(d,p) |
| Energy E(RB3LYP) | -26.61532363 au |
| RMS Gradient Norm. | 0.00000398 au |
| Dipole Moment | 0.00 D |
| Point Group | D3H |
| Job CPU Time | 25.0 Seconds |
The table below shows the convergence, optimised Bond Angle of H-B-H 120.0 degrees (ο) and optimised Bond Length of B-H 1.19 Angstroms (Å) . These values are consistent with the literature values which use the basis set series (cc-pCVXZ, X T, Q, 5) of all-electron CCSD(T) (coupled-cluster singles and doubles with perturbative triples) giving an equilibrium bond length of B-H as re=1.1867 Å [1].
        Item               Value     Threshold   Converged?
Maximum Force            0.000005     0.000450     YES
RMS     Force            0.000003     0.000300     YES
Maximum Displacement     0.000019     0.001800     YES
RMS     Displacement     0.000012     0.001200     YES
Predicted change in Energy=-1.304899D-10
Optimization completed.
   -- Stationary point found.
                          ----------------------------
                          !   Optimized Parameters   !
                          ! (Angstroms and Degrees)  !
--------------------------                            --------------------------
! Name  Definition              Value          Derivative Info.                !
--------------------------------------------------------------------------------
! R1    R(1,2)                  1.1923         -DE/DX =    0.0                 !
! R2    R(1,3)                  1.1923         -DE/DX =    0.0                 !
! R3    R(1,4)                  1.1923         -DE/DX =    0.0                 !
! A1    A(2,1,3)              120.0            -DE/DX =    0.0                 !
! A2    A(2,1,4)              120.0            -DE/DX =    0.0                 !
! A3    A(3,1,4)              120.0            -DE/DX =    0.0                 !
! D1    D(2,1,4,3)            180.0            -DE/DX =    0.0                 !
--------------------------------------------------------------------------------
BH3 Total Energies:
The total energy obtained from the 3-21G optimisation was -26.46226338 au this is -69476.67 KJmol-1.
The total energy obtained from the 6-31G optimisation was -26.61532363 au this is -69878.53 KJmol-1.
These two energies can't be compared as each structure used a different basis set, only energies of the same basis set can be compared.
Frequency Analysis of BH3
Frequency analysis has been carried out on the optimised Borane molecule using basis set 6-31G(d,p). Frequency analysis is important because it gives conformation that the optimised structure is at its energy minimum and is therefore the stable geometry. Frequency analysis uses the most accurate optimisation of the Borane molecule which was the 6-31G(d,p) basis set. When completing a frequency calculation it is important that all basis sets remain the same as the optimised structure, if this changes the results will not be valid. One must also check that the energy of the output file for the frequency analysis is the same as the energy of the optimised Borane if this is not true the calculation must be repeated, a difference in energy means that the structures are not identical. The optimised Borane molecule using basis set 6-31G(d,p) output file was loaded in gaussview. The calculation was computed by selecting Gaussoan Calculation setup under the calculate tab, with the job type selected was frequency. The log file for the frequency analysis of borane is linked here.
| File Name | LAURA_ELLIOTT_BH3_FREQ_3 |
| File Type | .log |
| Calculation Type | FREQ |
| Calculation Method | RB3LYP |
| Basis Set | 6-31G(d,p) |
| Energy E(RB3LYP) | -26.61532363 au |
| RMS Gradient Norm. | 0.00000409 au |
| Dipole Moment | 0.00 D |
| Point Group | D3H |
| Job CPU Time | 7.0 Seconds |
Below is a table to show the calculation converged.
     Item               Value     Threshold  Converged?
Maximum Force            0.000008     0.000450     YES
RMS     Force            0.000004     0.000300     YES
Maximum Displacement     0.000032     0.001800     YES
RMS     Displacement     0.000016     0.001200     YES
Predicted change in Energy=-3.945284D-10
Optimization completed.
   -- Stationary point found.
The low frequencies are shown in the table below.
Low frequencies ---   -0.6399   -0.3542   -0.0054   13.9750   17.3265   17.3384
Low frequencies --- 1163.0484 1213.2177 1213.2204
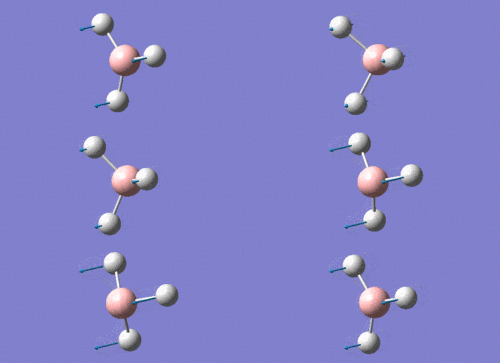
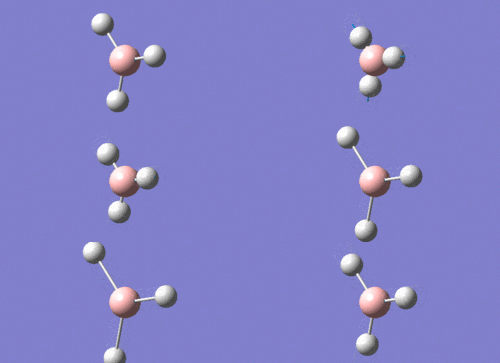
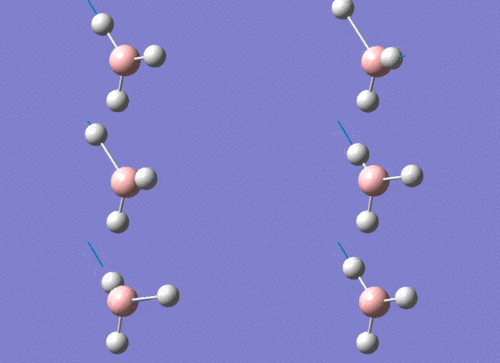
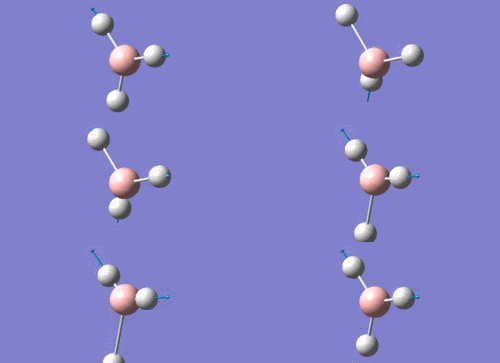
The low frequencies are very important as all non-linear molecules have 3N-6 degrees of vibrational mode, and a vibrational mode is only IR active when the vibration includes a change in the dipole moment. The low frequencies listed above are associated with the -6 part of the equation 3N-6, they are just the motions attached to the centre of mass of the molecule. The low frequencies should all be close to zero and an increase in basis set accuracy results in these six values being closer to zero. The low frequency range should be within ±15cm-1 this gives an indication that the calculation is at an energy minimum and the most stable geometry, the low frequencies range from -0.64 to 17.33 slightly outside this range. The highest zero frequency is 17cm-1 and the lowest vibrational frequency is 1163-1 as this is significantly larger the data appears to look satisfactory.
The real frequencies are shown in the data below.
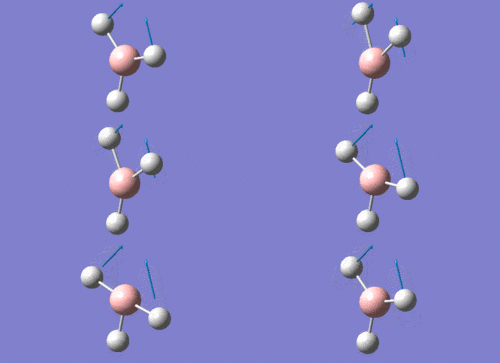
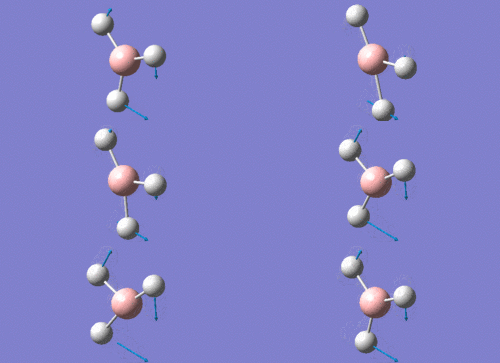
                    1                      2                      3
                   A2"                    E'                     E'
Frequencies --  1163.0484              1213.2177              1213.2204
Red. masses --     1.2531                 1.1072                 1.1072
Frc consts  --     0.9987                 0.9601                 0.9601
IR Inten    --    92.5429                14.0575                14.0612
 Atom  AN      X      Y      Z        X      Y      Z        X      Y      Z
    1   5     0.00   0.00   0.16     0.00   0.10   0.00    -0.10   0.00   0.00
    2   1     0.00   0.00  -0.57     0.00   0.08   0.00     0.81   0.00   0.00
    3   1     0.00   0.00  -0.57     0.39  -0.59   0.00     0.14  -0.39   0.00
    4   1     0.00   0.00  -0.57    -0.39  -0.59   0.00     0.14   0.39   0.00
                    4                      5                      6
                   A1'                    E'                     E'
Frequencies --  2582.0950              2715.2475              2715.2487
Red. masses --     1.0078                 1.1273                 1.1273
Frc consts  --     3.9589                 4.8970                 4.8970
IR Inten    --     0.0000               126.3365               126.3269
 Atom  AN      X      Y      Z        X      Y      Z        X      Y      Z
    1   5     0.00   0.00   0.00     0.11   0.00   0.00     0.00   0.11   0.00
    2   1     0.00  -0.58   0.00     0.02   0.00   0.00     0.00  -0.81   0.00
    3   1     0.50   0.29   0.00    -0.60  -0.36   0.00    -0.36  -0.19   0.00
    4   1    -0.50   0.29   0.00    -0.60   0.36   0.00     0.36  -0.19   0.00
Below is the IR spectrum generated by Gaussview from the Frequency calculation in gaussian.
This IR spectrum only shows three peaks despite the output log file showing six vibrational modes, not all the vibrational modes are IR active. Firstly the vibration of frequency 2582cm-1 has zero intensity and therefore doesn't appear on the IR spectrum, all the other vibrational frequencies have positive frequencies and so this doesn't explain the absence of the other frequencies. A zero intensity is the result of no change in dipole moment resulting in the frequency not appearing in the spectrum, for a frequency to be IR active there must be a change in the dipole moment. Secondly there are two E' asymmetric stretches at 2715cm-1 this produces one peak as both overlay each other in the spectrum as they are degenerate, another set of degenerate frequencies are at 1213cm-1 and therefore also only one peak is present in the spectrum. This leads to a total of three peaks displayed in the IR spectrum at 1163cm-1, 1213cm-1 and 2715cm-1.
Molecular Orbital Analysis of BH3
The molecular orbitals for boron have been computed by opening the .chk file from the optimisation of NH3. The new job type is now set toenergy the basis set 6-31G(d,p) is used, under the NBO tab select FULL NBO and add the additional key words to the text box"pop=full". The calculation was then sent to the HPC service and deposited in the D-space, here is the DOI link. DOI:10042/23444
The unoccupied orbitals are more diffuse compare to the occupied ones, therefore only the lower energy unoccupied orbitals have been shown, this is due to the absence of electron density. The linear combination of atomic orbitals are very similar to the orbitals generated in gaussview as the generated molecular orbitals have the same phase correlation as the LCAO's. One can conclude that using LCAO theory to determine molecular orbitals and molecular orbital diagrams for simple molecules is a relatively accurate method.
Computational Analysis of Thallium Tribromide
Optimising a Molecule of TlBr3
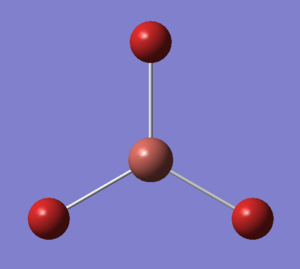
Thallium Tribromide structure has been created using gaussview, the molecular viewer window and the periodic table button. The symmetry of the molecule has been restricted this was done by using the edit tab and selecting point group a new window appeared and Enable point group symmetry was selected. The molecule was constrained to the D3h point group and the tolerance was increased to Very tight (0.0001). After this the calculation was set up under Gaussian Calculation Setup, the job type is selected as an optimisation using method DFT, B3LYP and basis set LanL2LDZ. The job was then submitted to the HPC service and once completed was deposited in the chemical database "D-space". The log file for the optimised Thallium Tribromide molecule can be accessed using this DOI link: DOI:10042/23368
To check that the operation calculation has completed the .log file has been opened and the optimisation was then checked for convergence. The table below shows the convergence, optimised Bond Angle of Br-Tl-Br 120.0 degrees (ο) and optimised Bond Length of Tl-Br 2.65 Angstroms (Å) . Literature value for the bond angle of 120 degrees (ο) [2]. and bond length 2.5122 Angstroms (Å) [3].
        Item               Value     Threshold  Converged?
Maximum Force            0.000002     0.000450     YES
RMS     Force            0.000001     0.000300     YES
Maximum Displacement     0.000022     0.001800     YES
RMS     Displacement     0.000014     0.001200     YES
Predicted change in Energy=-6.083935D-11
Optimization completed.
   -- Stationary point found.
                          ----------------------------
                          !   Optimized Parameters   !
                          ! (Angstroms and Degrees)  !
--------------------------                            --------------------------
! Name  Definition              Value          Derivative Info.                !
--------------------------------------------------------------------------------
! R1    R(1,2)                  2.651          -DE/DX =    0.0                 !
! R2    R(1,3)                  2.651          -DE/DX =    0.0                 !
! R3    R(1,4)                  2.651          -DE/DX =    0.0                 !
! A1    A(2,1,3)              120.0            -DE/DX =    0.0                 !
! A2    A(2,1,4)              120.0            -DE/DX =    0.0                 !
! A3    A(3,1,4)              120.0            -DE/DX =    0.0                 !
! D1    D(2,1,4,3)            180.0            -DE/DX =    0.0                 !
--------------------------------------------------------------------------------
Frequency Analysis of TlBr3
Frequency analysis has been carried out on the optimised Thallium Tribromide molecule using basis set LanL2DZ. The optimised molecule output file was loaded in gaussview. The calculation was computed by selecting Gaussian Calculation setup under the calculate tab, with the job type selected was frequency. The calculation was completed on the HPC service and here is the DOI link to access the file. DOI:10042/23486
| File Name | TlBr3_freq_LE110 |
| File Type | .log |
| Calculation Type | FREQ |
| Calculation Method | RB3LYP |
| Basis Set | LANL2DZ |
| Energy E(RB3LYP) | -91.21812851 au |
| RMS Gradient Norm. | 0.00000088 au |
| Dipole Moment | 0.00 D |
| Point Group | D3H |
| Job CPU Time | 28.2 Seconds |
The calculation converged and is shown below.
        Item               Value     Threshold  Converged?
Maximum Force            0.000002     0.000450     YES
RMS     Force            0.000001     0.000300     YES
Maximum Displacement     0.000022     0.001800     YES
RMS     Displacement     0.000011     0.001200     YES
Predicted change in Energy=-5.660901D-11
Optimization completed.
   -- Stationary point found.
The low frequencies and real frequencies are shown in the table below.
Low frequencies ---   -3.4213   -0.0026   -0.0004    0.0015    3.9367    3.9367
Low frequencies ---   46.4289   46.4292   52.1449
Harmonic frequencies (cm**-1), IR intensities (KM/Mole), Raman scattering
activities (A**4/AMU), depolarization ratios for plane and unpolarized
incident light, reduced masses (AMU), force constants (mDyne/A),
and normal coordinates:
                    1                      2                      3
                   E'                     E'                     A2"
Frequencies --    46.4289                46.4292                52.1449
Red. masses --    88.4613                88.4613               117.7209
Frc consts  --     0.1124                 0.1124                 0.1886
IR Inten    --     3.6867                 3.6867                 5.8466
 Atom  AN      X      Y      Z        X      Y      Z        X      Y      Z
    1  81     0.00   0.28   0.00    -0.28   0.00   0.00     0.00   0.00   0.55
    2  35     0.00   0.26   0.00     0.74   0.00   0.00     0.00   0.00  -0.48
    3  35     0.43  -0.49   0.00    -0.01  -0.43   0.00     0.00   0.00  -0.48
    4  35    -0.43  -0.49   0.00    -0.01   0.43   0.00     0.00   0.00  -0.48
                    4                      5                      6
                   A1'                    E'                     E'
Frequencies --   165.2685               210.6948               210.6948
Red. masses --    78.9183               101.4032               101.4032
Frc consts  --     1.2700                 2.6522                 2.6522
IR Inten    --     0.0000                25.4830                25.4797
The low frequencies should all be close to zero and an increase in basis set accuracy results in these six values being closer to zero. The low frequency range should be within ±15cm-1 this gives an indication that the calculation is at an energy minimum and the most stable geometry, the low frequencies range from -3 to 4 inside this range. The highest zero frequency is 4cm-1 and the lowest vibrational frequency is 46cm-1 as this is significantly larger the data appears to look satisfactory. The lowest "real" normal mode is 46cm-1.
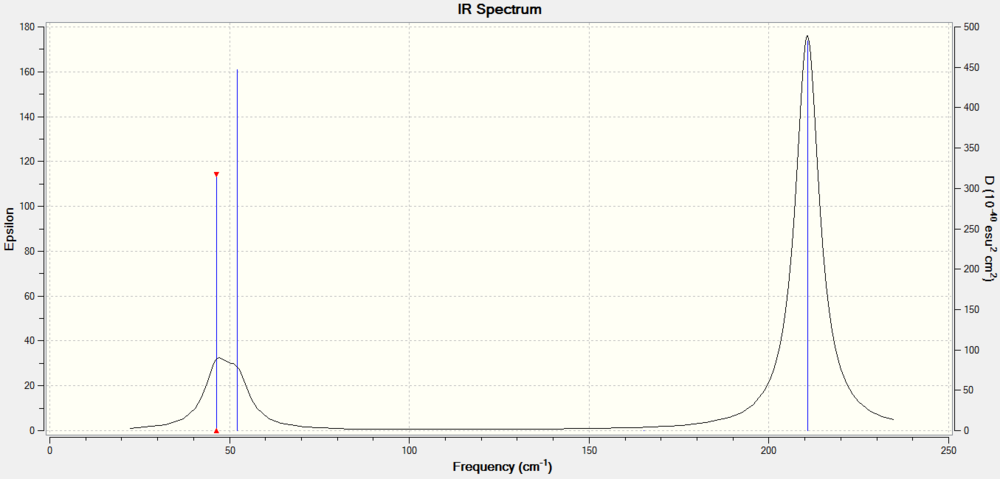
Below is the computed IR spectrum for Thallium Tribromide.
This IR spectrum only shows two broad peaks despite the output log file showing six vibrational modes, not all the vibrational modes are IR active. Firstly the vibration of frequency 165cm-1 has zero intensity and therefore doesn't appear on the IR spectrum. Secondly there are two E' stretches at 46cm-1 this produces one peak as both overlay each other in the spectrum as they are degenerate, another frequency occurs at 56cm-1 and therefore adds to the increased broadness of the peak ranging from 46-56. There is another peak at 210cm-1 for the degenerate E' stretch. In conclusion there are two peaks displayed in the IR spectrum at 46-56cm-1 and 210cm-1.
Comparison of TlBr3 and BH3 Vibrational Frequencies
| TlBr3 | BH3 |
| 46 | 1163 |
| 46 | 1213 |
| 52 | 1213 |
| 165 | 2582 |
| 210 | 2751 |
| 210 | 2751 |
The B-H frequencies are much larger than the Tl-Br frequencies this is due to the bond strength of B-H being much greater than Tl-Br, also the Tl-Br bond is longer showing a weaker bond interaction. Tl and B are both in group 13 but Tl occurs much further down this group and therefore has larger more diffuse orbitals, similarly Br has more diffuse orbitals compared to Hydrogen. More diffuse orbitals in bonding lead to a poor overlap of bonding orbitals, less overlap of electron clouds between atoms results in poor bonding and therefore a weaker bond. In contrast to his Boron and Hydrogen have a good orbital overlap and therefore exhibit stronger bonding.
One can move from the TlBr3 and BH3 molecules without a change in the order of vibrational modes, a reordering occurs when the molecules don't have the same point group and therefore have different symmetry labels. The IR spectra for TlBr3 and BH3 are similar as both contain three peaks, one vibrational frequency of zero intensity and two sets of degenerate point group symmetries. For both spectra the A2" and E' modes lie very close together similarly the A1' and E' modes also lie close together but this time as a higher energy. The A2" and E'modes both represent a bending type of motion including symmetrical wagging of A2" and rocking and symmetrical scissoring of E' modes. The other modes A1' and E'represent stretching vibrational frequencies and are therefore higher as more energy is required for stretching compared to bending, being A1' totally symmetric and E' asymmetric stretches.
As previously stated frequency analysis is important because it gives conformation that the optimised structure is at its energy minimum and is therefore the stable geometry. When completing a frequency calculation it is important that all basis sets remain the same as the optimised structure, if the basis set changes the results will not be valid. The low frequencies are very important as all non-linear molecules have 3N-6 degrees of vibrational mode, and a vibrational mode is only IR active when the vibration includes a change in the dipole moment. The low frequencies are associated with the -6 part of the equation 3N-6, they are just the motions attached to the centre of mass of the molecule. The low frequencies should be close to zero indicating accuracy of results.
Computational Analysis of Boron Tribromide
Computational analysis of Boron Trbromide has been completed by loading the BH3 optimised log file and adapting this molecule using the periodic table button replacing the Hydrogen atoms with Bromine atoms. The calculation was set up under Gaussian Calculation Setup, the job type is selected as an optimisation using method DFT, B3LYP and basis set GEN, along with the additional key words "pseudo=read gfinput". The text file was then edited using the following code:
Coordinates
(Blank line)
Atomic symbols (space) 0 (Zero)
Normal basis set
- (four stars)
(blank line)
Atomic symbols (space) 0 (Zero)
Pseudo-potential basis set
- (four stars)
(blank line)
Atomic symbols (space) 0 (Zero)
Pseudo-potential
(blank line)
This is used when compounds contain heavy atoms like Br and light atoms like B, the light atoms only need full basis sets to produce accurate results while the heavy atoms need to use pseudo-potentaials, therefore in this case a mix of pesudo-potentials and basis sets have been used. This type of calculation is large and was sent to the HPC service, the DOI link to the file is here: DOI:10042/23992
The item tabel below shows the calculation converged and has therefore completed successfully.
       Item               Value     Threshold  Converged?
Maximum Force            0.000008     0.000450     YES
RMS     Force            0.000005     0.000300     YES
Maximum Displacement     0.000036     0.001800     YES
RMS     Displacement     0.000023     0.001200     YES
Predicted change in Energy=-4.027600D-10
Optimization completed.
   -- Stationary point found.
The table below shows the optimised Bond Angle of Br-B-Br 120.0 degrees (ο) and optimised Bond Length of B-Br 1.93 Angstroms (Å) . Literature value for the bond length have been reported between 1.88Å [4].and 1.96Å [5], the value obtained lies between these two values and is therefore in good agreement with the literature.
                          ----------------------------
                          !   Optimized Parameters   !
                          ! (Angstroms and Degrees)  !
--------------------------                            --------------------------
! Name  Definition              Value          Derivative Info.                !
--------------------------------------------------------------------------------
! R1    R(1,2)                  1.934          -DE/DX =    0.0                 !
! R2    R(1,3)                  1.934          -DE/DX =    0.0                 !
! R3    R(1,4)                  1.934          -DE/DX =    0.0                 !
! A1    A(2,1,3)              120.0            -DE/DX =    0.0                 !
! A2    A(2,1,4)              120.0            -DE/DX =    0.0                 !
! A3    A(3,1,4)              120.0            -DE/DX =    0.0                 !
! D1    D(2,1,4,3)            180.0            -DE/DX =    0.0                 !
--------------------------------------------------------------------------------
Structural Analysis of BH3, TlBr3 and BBr3
| Molecule | Bond Length (Å) |
| BH3 | 1.19 |
| BBr3 | 1.93 |
| TlBr3 | 2.65 |
Changing the ligand to a larger atom with more diffuse orbitals like Bromide increases the bond length and therefore also weakens the bond. Hydrogen and Bromine are similar as both need one electron to complete their valence shell, but Bromine is in group 17 and has more diffuse orbitals extending to 4p compared to hydrogen. The difference between the BH3 and BBr3 is ~0.74 Å BH3 being the shorter one of the two molecules. This difference arise due to the nature of the orbital interactions BH3 which involves orbital overlap between 1H(s) and 2B(s) orbitals along with overlap of 1H(s) with 2B(P) symmetry label E' in contrast to the 1H(s) orbital overlap of 4P orbitals in Br which results in a mismatch in energy and orbital size resulting in the longer bond.
Changing the central element also causes a change in the bond length, Tl and B are both in group 13 of the periodic table and therefore the valence shells for both atoms contain three electrons. Tl bonding orbitals are 6pz and 6s compare to B being 2s and 2pz bond orbitals, there is a larger mismatch of orbital size and energy for the Tl bonding orbitals with the Br bonding orbitals and therefore the bonding becomes weaker and less efficient and leading to the overall consequence of a longer and weaker bond compared to B-Br. The difference between the Br-B and Tl-Br bond is ~0.72 Å.
In gaussview sometimes bonds are not draw in by the software after optimisation of a molecule however this doesn't mean that the bonds aren't there. Gaussview sets an arbitrary length as being a bond and if the bond length is longer than this it will not draw one in. There are many types of bonds that exist between atoms, bonds are caused by electrostatic forces of attraction between oppositely charged species, some examples of weak chemical bonds are dipole-dipole interactions and hydrogen bonding and in contrast to this examples of strong chemical bonds include covalent and ionic bonds.
A covalent bond involves a pair of electrons which occupy the space between atomic nuclei, as electrons are negatively charged they have attractive forces with the nuclei which are positively charged. When the attractive forces between electrons and nuclei outweighs the repulsive forces of electron-electron and nuclei-nuclei interactions there will be a fixed distance between the atoms which will remain in equilibrium, however there will be some vibrational degrees of freedom about this fixed position. Covalent bonds have a direction in space which is why they can be drawn in between atoms by representing the bonds by lines, this is known as the ball and stick type drawings whereby the atom is the ball and the bond is the stick between atoms. [6]
It is important to remember that electrons behave according to the wave-praticle duality theory, and the wave like nature of the electron cloud means that electrons occupy a large volume of space keeping the nuclei far apart from one another. Therefore bond length is dependent on electron density and orbital overlap between atoms and more diffuse orbitals exhibit bonding that is longer and weaker which may therefore be outside the arbitrary parameter set by gaussview. This results in atoms in a molecule not appearing to be connected by a bond, however the bond can be drawn in by hand using the add bond button manually.[6]
Computational Analysis of Ammonia
Optimsation Analysis of Ammonia
The optimisation of NH3 molecule using gaussview has been completed and analyzed. The ammonia structure was created using the periodic table button and viewed using the molecule viewer window. The calculation is set-up under Gaussian Calculation Setup, the job type is selected as an optimisation using method DFT, B3LYP and basis set 6-31G(d,p), the additional key word has been used "nosymm". The log file for the optimised ammonia molecule using the 6-31G basis set is linked here.
The item table below shows that the calculation has converged and has therefore completed.
       Item               Value     Threshold  Converged?
Maximum Force            0.000024     0.000450     YES
RMS     Force            0.000012     0.000300     YES
Maximum Displacement     0.000079     0.001800     YES
RMS     Displacement     0.000053     0.001200     YES
Predicted change in Energy=-1.629729D-09
Optimization completed.
   -- Stationary point found.
The table below shows the convergence, optimised Bond Angle of H-N-H 105.7 degrees (ο) and optimised Bond Length of N-H 1.02 Angstroms (Å) . Literature value has found the bond angle to be 106.8 degrees (ο) while the bond length was also found to be 1.011Å for the N-H bond, this is in extremely good agreement with the computational experiment. [7]
                          ----------------------------
                          !   Optimized Parameters   !
                          ! (Angstroms and Degrees)  !
--------------------------                            --------------------------
! Name  Definition              Value          Derivative Info.                !
--------------------------------------------------------------------------------
! R1    R(1,2)                  1.018          -DE/DX =    0.0                 !
! R2    R(1,3)                  1.018          -DE/DX =    0.0                 !
! R3    R(1,4)                  1.018          -DE/DX =    0.0                 !
! A1    A(2,1,3)              105.7413         -DE/DX =    0.0                 !
! A2    A(2,1,4)              105.7486         -DE/DX =    0.0                 !
! A3    A(3,1,4)              105.7479         -DE/DX =    0.0                 !
! D1    D(2,1,4,3)           -111.8631         -DE/DX =    0.0                 !
--------------------------------------------------------------------------------
Frequency Analysis of Ammonia
Frequency analysis has been carried out on the optimised Ammonia molecule using basis set 6-31G(d,p). The optimised molecule output file was loaded in gaussview. The calculation was computed by selecting Gaussian Calculation setup under the calculate tab, with the job type selected was frequency. The log file for the optimised ammonia molecule using the 6-31G basis set is linked here.
| File Name | NH3_FREQUENCY |
| File Type | .log |
| Calculation Type | FREQ |
| Calculation Method | RB3LYP |
| Basis Set | 6-31G(d,P) |
| Energy E(RB3LYP) | -56.55776872 au |
| RMS Gradient Norm. | 0.00000811 au |
| Dipole Moment | 1.85 D |
| Point Group | C1 |
| Job CPU Time | 23 seconds |
The low and real frequencies are shown below, the low frequencies are all within ±15cm-1 and all real frequencies are positive, the lowest real frequency is 1089cm-1 while the highest low frequency is 14.5 as this is considerably lower and of the correct order of magnitude compared to the real frequency the data appears to be satisfactory.
Low frequencies ---  -10.3123    0.0006    0.0010    0.0017    8.9888   14.5345
Low frequencies --- 1089.3114 1693.9155 1693.9481
Harmonic frequencies (cm**-1), IR intensities (KM/Mole), Raman scattering
activities (A**4/AMU), depolarization ratios for plane and unpolarized
incident light, reduced masses (AMU), force constants (mDyne/A),
and normal coordinates:
                    1                      2                      3
                    A                      A                      A
Frequencies --  1089.3114              1693.9155              1693.9481
Red. masses --     1.1800                 1.0644                 1.0644
Frc consts  --     0.8250                 1.7995                 1.7996
IR Inten    --   145.4454                13.5609                13.5561
 Atom  AN      X      Y      Z        X      Y      Z        X      Y      Z
    1   7     0.12   0.00   0.00     0.00   0.05   0.04     0.00   0.04  -0.05
    2   1    -0.53  -0.21   0.00     0.21   0.12  -0.45     0.15   0.09   0.61
    3   1    -0.53   0.11   0.18    -0.24  -0.20   0.27     0.11  -0.63   0.29
    4   1    -0.53   0.11  -0.18     0.03  -0.66  -0.36    -0.26   0.00  -0.17
                    4                      5                      6
                    A                      A                      A
Frequencies --  3461.2807              3589.7786              3589.9111
Red. masses --     1.0272                 1.0883                 1.0883
Frc consts  --     7.2509                 8.2633                 8.2639
IR Inten    --     1.0589                 0.2690                 0.2699
 Atom  AN      X      Y      Z        X      Y      Z        X      Y      Z
    1   7    -0.04   0.00   0.00     0.00  -0.03   0.07     0.00   0.07   0.03
    2   1     0.18  -0.55   0.00    -0.13   0.31   0.02     0.28  -0.69   0.01
    3   1     0.18   0.27   0.47    -0.18  -0.24  -0.37    -0.25  -0.29  -0.54
    4   1     0.18   0.27  -0.48     0.31   0.38  -0.65    -0.03  -0.02   0.08
Molecular Orbital Analysis of Ammonia
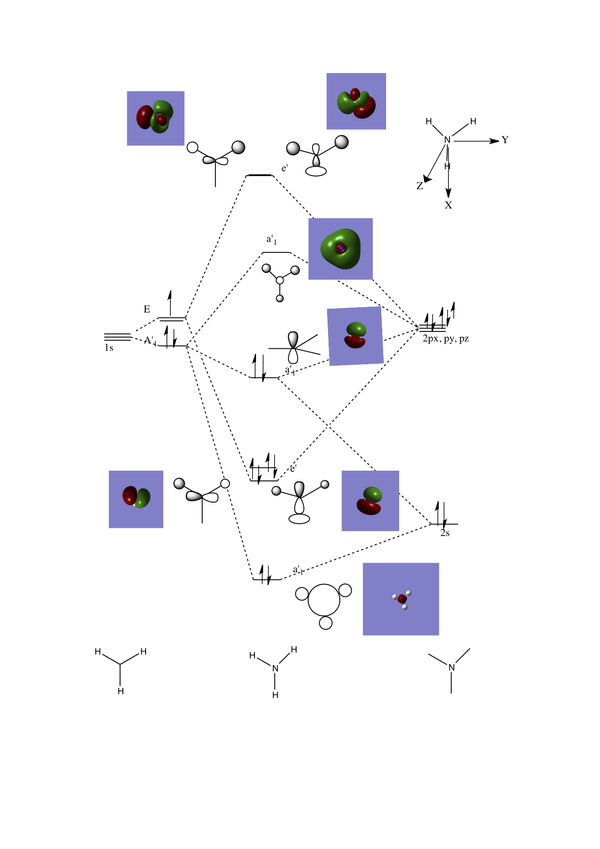
The molecular orbitals for ammonia have been computed by opening the .chk file from the optimisation of NH3. The new job type is now set to energy the basis set 6-31G(d,p) is used, under the NBO tab select FULL NBO and add the additional key words to the text box "pop=full". The calculation was then sent to the HPC service and deposited in the D-space, here is the DOI link. DOI:10042/23485
The unoccupied orbitals are more diffuse compare to the occupied ones, therefore only the lower energy unoccupied orbitals have been shown, this is due to the absence of electron density. The linear combination of atomic orbitals are very similar to the orbitals generated in gaussview as the generated molecular orbitals have the same phase correlation as the LCAO's. One can conclude that using LCAO theory to determine molecular orbitals and molecular orbital diagrams for simple molecules is a relatively accurate method.
Natural Bond Order (NBO) Analysis of Ammonia
The ammonia .log file has been opened from the population analysis. The NBO were viewed by going to results tab and charge distribution was selected, a new window appeared and NBO selected as the type and colour atoms by charge.
The image to the left shows the natural bond order coloured charges, while the image to the right shows the specific NBO charges for the Nitrogen is -1.125 and for the H is 0.375, the charge range used was -1.000 to +1.000. The red colour indicates a negative charge and green represents a positive charge. The nitrogen has a large negative charge.


Computational Analysis of Ammonia-Borane
Ammonia-borane is an acid-base complex and the energy of the dative covalent bond can be calculated using gaussview, in this dative bond Nitrogen "formally" donates two electrons into the Boron empty p orbital. When using gaussview to compute the energy of a dative bond it is important that the basis set and method remains constant a breach of this leads to invalid data and consequently invalid energies. Computing this energy requires the information of reactants being NH3 and BH3, along with the energy of the products. To compute the energy of the product, the molecule was made in gaussview using the molecular viewer window and the formatting button for alkyl chains, a molecule of ethane was made and the Nitrogen replaces one of the Carbons, the other carbon is replaced by a Boron using the periodic table button.
Optimisation analysis of Ammonia-Borane
Optimisation analysis has been carried out on the product molecule using basis set 6-31G(d,p) and method B3LYP. The calculation was submitted to the HPC service and deposited in the D-space, here is the link DOI:10042/23484
Below is the item table for Ammonia-Borane optimisation calculation, the calculation has converged and therefore has been successful.
        Item               Value     Threshold  Converged?
Maximum Force            0.000137     0.000450     YES
RMS     Force            0.000063     0.000300     YES
Maximum Displacement     0.000606     0.001800     YES
RMS     Displacement     0.000336     0.001200     YES
Predicted change in Energy=-1.993988D-07
Optimization completed.
   -- Stationary point found --
The table below shows the convergence optimised Bond Length of N-H 1.02 Angstroms (Å) , Bond Length of B-H 1.2 Angstroms (Å) and Bond Length of N-B 1.67 Angstroms (Å) .
                          ----------------------------
                          !   Optimized Parameters   !
                          ! (Angstroms and Degrees)  !
--------------------------                            --------------------------
! Name  Definition              Value          Derivative Info.                !
--------------------------------------------------------------------------------
! R1    R(1,7)                  1.0186         -DE/DX =   -0.0001              !
! R2    R(2,7)                  1.0186         -DE/DX =   -0.0001              !
! R3    R(3,7)                  1.0186         -DE/DX =   -0.0001              !
! R4    R(4,8)                  1.2101         -DE/DX =   -0.0001              !
! R5    R(5,8)                  1.2101         -DE/DX =   -0.0001              !
! R6    R(6,8)                  1.2101         -DE/DX =   -0.0001              !
! R7    R(7,8)                  1.668          -DE/DX =   -0.0001              !
! A1    A(1,7,2)              107.87           -DE/DX =    0.0                 !
! A2    A(1,7,3)              107.8652         -DE/DX =    0.0                 !
! A3    A(1,7,8)              111.0329         -DE/DX =    0.0                 !
! A4    A(2,7,3)              107.8697         -DE/DX =    0.0                 !
! A5    A(2,7,8)              111.0286         -DE/DX =    0.0                 !
! A6    A(3,7,8)              111.0291         -DE/DX =    0.0                 !
! A7    A(4,8,5)              113.8693         -DE/DX =    0.0                 !
! A8    A(4,8,6)              113.8721         -DE/DX =    0.0                 !
! A9    A(4,8,7)              104.6003         -DE/DX =    0.0                 !
! A10   A(5,8,6)              113.8747         -DE/DX =    0.0                 !
! A11   A(5,8,7)              104.6003         -DE/DX =    0.0                 !
! A12   A(6,8,7)              104.5984         -DE/DX =    0.0                 !
! D1    D(1,7,8,4)           -179.9867         -DE/DX =    0.0                 !
! D2    D(1,7,8,5)            -59.9892         -DE/DX =    0.0                 !
! D3    D(1,7,8,6)             60.0135         -DE/DX =    0.0                 !
! D4    D(2,7,8,4)            -59.9839         -DE/DX =    0.0                 !
! D5    D(2,7,8,5)             60.0136         -DE/DX =    0.0                 !
! D6    D(2,7,8,6)           -179.9837         -DE/DX =    0.0                 !
! D7    D(3,7,8,4)             60.0161         -DE/DX =    0.0                 !
! D8    D(3,7,8,5)           -179.9864         -DE/DX =    0.0                 !
! D9    D(3,7,8,6)            -59.9837         -DE/DX =    0.0                 !
--------------------------------------------------------------------------------
Frequency Analysis of Ammonia-Borane
Frequency calculation set up using basis set 6-31G(d,p) and method DFT, B3LYP. The calculation was sent to the HPC service and once completed was deposited to the D-space, the DOI link is DOI: DOI:10042/23493
| File Name | NH3BH3_FREQ_log |
| File Type | .log |
| Calculation Type | FREQ |
| Calculation Method | RB3LYP |
| Basis Set | 6-31G(d,P) |
| Energy E(RB3LYP) | -83.22468907 au |
| RMS Gradient Norm. | 0.00006789 au |
| Dipole Moment | 5.57 D |
| Point Group | C1 |
| Job CPU Time | 1 minute 4.1 seconds |
The table below shows the low frequencies for ammonia-borane molecule:
Low frequencies ---   -0.0006   -0.0005    0.0012   16.9374   22.4174   37.9152
Low frequencies ---  265.7297  632.3742  639.0598
| Mode | Frequency (cm-1) | IR Intensity |
| 1 | 266 | 0 |
| 2 | 632 | 14 |
| 3 | 639 | 4 |
| 4 | 640 | 4 |
| 5 | 1069 | 40 |
| 6 | 1070 | 41 |
| 7 | 1197 | 109 |
| 8 | 1204 | 4 |
| 9 | 1204 | 3 |
| 10 | 1330 | 113 |
| 11 | 1676 | 28 |
| 12 | 1676 | 28 |
| 13 | 2470 | 67 |
| 14 | 2530 | 231 |
| 15 | 2530 | 231 |
| 16 | 3462 | 3 |
| 17 | 3579 | 28 |
| 18 | 3579 | 28 |
Energy Analysis of Dative Bond in Ammonia-Borane
E(NH3)= -56.55776856 au
E(BH3)= -26.61532363 au
E(NH3BH3)= -83.22468907 au
ΔE=E(NH3BH3)-[E(BH3)+E(NH3)]
ΔE= -83.22468907-[-26.61532363 + -56.55776856]
ΔE= -0.05159688 au
Dissociation energy of the dative bond in ammonia-borane is -135.47KJmol-1.
Computational Analysis of Benzene
This part of the project focuses on aromatic compounds, and how modifying substituents on an aromatic compound relates to changed in the MO digram.
Optimisation Analysis of Benzene
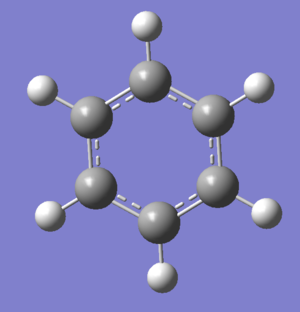
Firstly starting with the aromatic compound benzene, the optimisation has been completed by creating the molecule using gaussview. The calculation is set-up under Gaussian Calculation Setup, the job type is selected as an optimisation using method DFT, B3LYP and basis set6-31G(d,p). This calculation is submitted to the HPC service and deposited in the D space the DOI link is found here. DOI:10042/23488
Benzene has a very negative energy due to the additional stabilisation of delocalised electrons compared to that of the previously calculated planar molecules. The log file was opened and checked for convergence, the calculation has converged and therefore was successful.
    Item               Value     Threshold  Converged?
Maximum Force            0.000212     0.000450     YES
RMS     Force            0.000085     0.000300     YES
Maximum Displacement     0.000991     0.001800     YES
RMS     Displacement     0.000315     0.001200     YES
Predicted change in Energy=-5.157454D-07
Optimization completed.
-- Stationary point found.
The table below shows the optimised Bond Length of C-H 1.09 Angstroms (Å) and C-C 1.40 Angstroms (Å) .LIterature bond length of benzene has been found also to be 1.40Å. [8]
                          ----------------------------
                          !   Optimized Parameters   !
                          ! (Angstroms and Degrees)  !
--------------------------                            --------------------------
! Name  Definition              Value          Derivative Info.                !
--------------------------------------------------------------------------------
! R1    R(1,2)                  1.3963         -DE/DX =    0.0001              !
! R2    R(1,6)                  1.3961         -DE/DX =    0.0002              !
! R3    R(1,7)                  1.0861         -DE/DX =    0.0002              !
! R4    R(2,3)                  1.3961         -DE/DX =    0.0002              !
! R5    R(2,8)                  1.0861         -DE/DX =    0.0002              !
! R6    R(3,4)                  1.3963         -DE/DX =    0.0001              !
! R7    R(3,9)                  1.086          -DE/DX =    0.0002              !
! R8    R(4,5)                  1.3961         -DE/DX =    0.0002              !
! R9    R(4,10)                 1.086          -DE/DX =    0.0002              !
! R10   R(5,6)                  1.3963         -DE/DX =    0.0001              !
! R11   R(5,11)                 1.0861         -DE/DX =    0.0002              !
! R12   R(6,12)                 1.0861         -DE/DX =    0.0002              !
! A1    A(2,1,6)              119.9972         -DE/DX =    0.0                 !
! A2    A(2,1,7)              119.9949         -DE/DX =    0.0                 !
! A3    A(6,1,7)              120.0079         -DE/DX =    0.0                 !
! A4    A(1,2,3)              120.0079         -DE/DX =    0.0                 !
! A5    A(1,2,8)              119.9881         -DE/DX =    0.0                 !
! A6    A(3,2,8)              120.004          -DE/DX =    0.0                 !
! A7    A(2,3,4)              119.9948         -DE/DX =    0.0                 !
! A8    A(2,3,9)              120.0086         -DE/DX =    0.0                 !
! A9    A(4,3,9)              119.9966         -DE/DX =    0.0                 !
! A10   A(3,4,5)              119.9972         -DE/DX =    0.0                 !
! A11   A(3,4,10)             119.9934         -DE/DX =    0.0                 !
! A12   A(5,4,10)             120.0094         -DE/DX =    0.0                 !
! A13   A(4,5,6)              120.0083         -DE/DX =    0.0                 !
! A14   A(4,5,11)             120.0014         -DE/DX =    0.0                 !
! A15   A(6,5,11)             119.9904         -DE/DX =    0.0                 !
! A16   A(1,6,5)              119.9946         -DE/DX =    0.0                 !
! A17   A(1,6,12)             120.0106         -DE/DX =    0.0                 !
! A18   A(5,6,12)             119.9948         -DE/DX =    0.0                 !
! D1    D(6,1,2,3)             -0.0059         -DE/DX =    0.0                 !
! D2    D(6,1,2,8)            180.0023         -DE/DX =    0.0                 !
! D3    D(7,1,2,3)           -180.01           -DE/DX =    0.0                 !
! D4    D(7,1,2,8)             -0.0019         -DE/DX =    0.0                 !
! D5    D(2,1,6,5)             -0.0055         -DE/DX =    0.0                 !
! D6    D(2,1,6,12)          -179.9972         -DE/DX =    0.0                 !
! D7    D(7,1,6,5)           -180.0013         -DE/DX =    0.0                 !
! D8    D(7,1,6,12)             0.007          -DE/DX =    0.0                 !
! D9    D(1,2,3,4)              0.0117         -DE/DX =    0.0                 !
! D10   D(1,2,3,9)           -179.9914         -DE/DX =    0.0                 !
! D11   D(8,2,3,4)            180.0036         -DE/DX =    0.0                 !
! D12   D(8,2,3,9)              0.0005         -DE/DX =    0.0                 !
! D13   D(2,3,4,5)             -0.0062         -DE/DX =    0.0                 !
! D14   D(2,3,4,10)          -180.0059         -DE/DX =    0.0                 !
! D15   D(9,3,4,5)            179.9969         -DE/DX =    0.0                 !
! D16   D(9,3,4,10)            -0.0028         -DE/DX =    0.0                 !
! D17   D(3,4,5,6)             -0.0051         -DE/DX =    0.0                 !
! D18   D(3,4,5,11)           180.0058         -DE/DX =    0.0                 !
! D19   D(10,4,5,6)          -180.0055         -DE/DX =    0.0                 !
! D20   D(10,4,5,11)            0.0054         -DE/DX =    0.0                 !
! D21   D(4,5,6,1)              0.011          -DE/DX =    0.0                 !
! D22   D(4,5,6,12)           180.0027         -DE/DX =    0.0                 !
! D23   D(11,5,6,1)          -179.9999         -DE/DX =    0.0                 !
! D24   D(11,5,6,12)           -0.0082         -DE/DX =    0.0                 !
--------------------------------------------------------------------------------
GradGradGradGradGradGradGradGradGradGradGradGradGradGradGradGradGradGrad
Frequency Analysis of Benzene
The frequency analysis has been completed using the .log file of optimised benzene, the basis set and method previously mentioned for the optimisation calculation of benzene has been used this time the job type is selected as frequency. The calculation was sent to the HPC service and deposited in the D-space, the DOI link is here. DOI:10042/23489
| File Name | Benzene_FREQ_LE110_log |
| File Type | .log |
| Calculation Type | FREQ |
| Calculation Method | RB3LYP |
| Basis Set | 6-31G(d,P) |
| Energy E(RB3LYP) | -232.25820551 au |
| RMS Gradient Norm. | 0.00009549 au |
| Dipole Moment | 0.00 D |
| Point Group | C1 |
| Job CPU Time | 5 minutes 30.3 seconds |
The calculation has converged.
     Item               Value     Threshold  Converged?
Maximum Force            0.000195     0.000450     YES
RMS     Force            0.000095     0.000300     YES
Maximum Displacement     0.001064     0.001800     YES
RMS     Displacement     0.000381     0.001200     YES
Predicted change in Energy=-5.065853D-07
Optimization completed.
   -- Stationary point found.
The low frequencies are low and within the appropriate range. The lowest real frequency is 414cm-1 while the highest low frequency is -0.0008, as this is much smaller the data appears to be correct. The real frequencies are all positive and are tabulated below.
Low frequencies ---  -17.2788  -14.5868   -9.6527   -0.0009   -0.0009   -0.0008
Low frequencies ---  413.7971  414.4697  620.8545
| Mode | Frequency (cm-1) | IR Intensity | Mode | Frequency (cm-1) | IR Intensity |
| 1 | 414 | 0 | 16 | 1179 | 0 |
| 2 | 414 | 0 | 17 | 1202 | 0 |
| 3 | 621 | 0 | 18 | 1202 | 0 |
| 4 | 621 | 0 | 19 | 1356 | 0 |
| 5 | 693 | 74 | 20 | 1380 | 0 |
| 6 | 718 | 0 | 21 | 1524 | 7 |
| 7 | 864 | 0 | 22 | 1525 | 7 |
| 8 | 865 | 0 | 23 | 1653 | 0 |
| 9 | 974 | 0 | 24 | 1653 | 0 |
| 10 | 974 | 0 | 25 | 3175 | 0 |
| 11 | 1013 | 0 | 26 | 3185 | 0 |
| 12 | 1018 | 0 | 27 | 3185 | 0 |
| 13 | 1020 | 0 | 28 | 3200 | 47 |
| 14 | 1066 | 3 | 29 | 3201 | 47 |
| 15 | 1066 | 3 | 30 | 3211 | 0 |
Molecular Orbital Analysis of Benzene
The molecular orbitals for boron have been computed by opening the .chk file from the optimisation of benzene. The new job type is now set to energy the basis set 6-31G(d,p) is used, under the NBO tab select FULL NBO and add the additional key words to the text box "pop=full". The calculation was then sent to the HPC service and deposited in the D-space, here is the DOI link. DOI:10042/23491
The molecular orbitals have been viewed on gaussian and LCAO have been created by working in a backwards fashion. The molecular orbitals from 1-6 are not present in this digram as these molecular orbitals contribute less to the overall stability of benzene, and are mainly made up of the carbon 2s orbitals. The centre of the molecular orbital diagram has been completed only showing molecular orbitals that are in the filled state up-to the HOMO level and the unoccupied degenerate LUMO level is also shown.
The molecular orbitals extend over the six carbons in the planar ring, the pi cloud is delocalised above and below this carbon plane, this leads to the increased stability of benzene. This pi delocalisation is present in molecular orbital 17, where there is no electron density there is zero change of finding an electron in this space while an increases in electron density leads to an increased probability of finding electron. Aromaticity is present when there are alternating saturated and unsaturated bonds, lone pairs or empty orbitals present in a ring system and a aromatic compound will show a greater stabilisation than one would expect. aromaticity is dependent upon pi electron density, the molecular orbitals formally contain two electrons each but then in a conjugated system can delocalise throughout the pi system network.
Natural Bond Order (NBO) Analysis of Benzene
The benzene .log file has been opened from the population analysis. The NBO were viewed by going to results tab and charge distribution was selected, a new window appeared and NBO selected as the type and colour atoms by charge.
The image to the left shows the natural bond order coloured charges, while the image to the right shows the specific NBO charges for the Carbon is-0.239 and for the H is 0.239, the colour range used was -0.4 to +0.4. The red colour indicates a negative charge and green represents a positive charge. The carbon is electronegative due to the delocalised electrons being above and below the plane of the carbons, the delocalised charges is further from the Hydrogens allowing them to be electropositive. Colour charge distribution of NBO for benzene left and numerical charge distribution of NBO in benzene on the right.
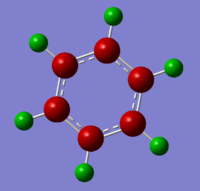
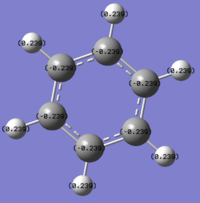
Computational Analysis of Boratabenzene
Optimisation of Boratabenzene

Boratabenzene has a similar structure to benzene, the difference being that one boron atom replaces a carbon atom in the planar ring. The structure is isoelectronic with benzene after accounting for the negative charge on boron of -1. The structure was created in gaussview, a benzene structure was created and viewed using the molecular viewer window, one of the carbon atoms was replaced with a boron atom using the periodic table button. The optimisation calculation was then generated by opening gaussian calculation set-up, the job type was selected as an optimisation and the method used was RB3LYP/DFT, along with basis set 6-31G(d,p) and the charge set to -1. The calculation was submitted to the HPC service and deposited in the D-space, here is the DOI:10042/23721
The calculation has converged, shown in the table below.
      Item               Value     Threshold  Converged?
Maximum Force            0.000159     0.000450     YES
RMS     Force            0.000069     0.000300     YES
Maximum Displacement     0.000911     0.001800     YES
RMS     Displacement     0.000329     0.001200     YES
Predicted change in Energy=-6.571678D-07
Optimization completed.
   -- Stationary point found.
The table below shows the optimised Bond Length of C-H 1.10 Angstroms (Å), B-H 1.22 Angstroms (Å), B-C 1.51 Angstroms (Å) and C-C 1.40 Angstroms (Å) .
                          ----------------------------
                          !   Optimized Parameters   !
                          ! (Angstroms and Degrees)  !
--------------------------                            --------------------------
! Name  Definition              Value          Derivative Info.                !
--------------------------------------------------------------------------------
! R1    R(1,2)                  1.3989         -DE/DX =    0.0                 !
! R2    R(1,5)                  1.4053         -DE/DX =   -0.0001              !
! R3    R(1,6)                  1.0968         -DE/DX =    0.0001              !
! R4    R(2,7)                  1.097          -DE/DX =   -0.0001              !
! R5    R(2,12)                 1.5137         -DE/DX =    0.0002              !
! R6    R(3,4)                  1.3989         -DE/DX =    0.0                 !
! R7    R(3,9)                  1.097          -DE/DX =   -0.0001              !
! R8    R(3,12)                 1.5138         -DE/DX =    0.0001              !
! R9    R(4,5)                  1.4053         -DE/DX =   -0.0001              !
! R10   R(4,10)                 1.0968         -DE/DX =    0.0001              !
! R11   R(5,11)                 1.0916         -DE/DX =   -0.0001              !
! R12   R(8,12)                 1.2185         -DE/DX =    0.0                 !
! A1    A(2,1,5)              122.1394         -DE/DX =    0.0001              !
! A2    A(2,1,6)              120.4237         -DE/DX =   -0.0002              !
! A3    A(5,1,6)              117.437          -DE/DX =    0.0                 !
! A4    A(1,2,7)              115.9496         -DE/DX =    0.0001              !
! A5    A(1,2,12)             120.0811         -DE/DX =   -0.0001              !
! A6    A(7,2,12)             123.9693         -DE/DX =   -0.0001              !
! A7    A(4,3,9)              115.9541         -DE/DX =    0.0001              !
! A8    A(4,3,12)             120.0808         -DE/DX =   -0.0001              !
! A9    A(9,3,12)             123.9651         -DE/DX =   -0.0001              !
! A10   A(3,4,5)              122.1382         -DE/DX =    0.0001              !
! A11   A(3,4,10)             120.4266         -DE/DX =   -0.0002              !
! A12   A(5,4,10)             117.4352         -DE/DX =    0.0                 !
! A13   A(1,5,4)              120.4509         -DE/DX =   -0.0001              !
! A14   A(1,5,11)             119.7757         -DE/DX =    0.0001              !
! A15   A(4,5,11)             119.7734         -DE/DX =    0.0001              !
! A16   A(2,12,3)             115.1096         -DE/DX =    0.0                 !
! A17   A(2,12,8)             122.449          -DE/DX =    0.0                 !
! A18   A(3,12,8)             122.4414         -DE/DX =    0.0                 !
! D1    D(5,1,2,7)           -180.0047         -DE/DX =    0.0                 !
! D2    D(5,1,2,12)            -0.003          -DE/DX =    0.0                 !
! D3    D(6,1,2,7)              0.0006         -DE/DX =    0.0                 !
! D4    D(6,1,2,12)           180.0023         -DE/DX =    0.0                 !
! D5    D(2,1,5,4)              0.0096         -DE/DX =    0.0                 !
! D6    D(2,1,5,11)           180.0051         -DE/DX =    0.0                 !
! D7    D(6,1,5,4)            180.0044         -DE/DX =    0.0                 !
! D8    D(6,1,5,11)            -0.0001         -DE/DX =    0.0                 !
! D9    D(1,2,12,3)            -0.0017         -DE/DX =    0.0                 !
! D10   D(1,2,12,8)          -180.0001         -DE/DX =    0.0                 !
! D11   D(7,2,12,3)           180.0001         -DE/DX =    0.0                 !
! D12   D(7,2,12,8)             0.0017         -DE/DX =    0.0                 !
! D13   D(9,3,4,5)            180.0078         -DE/DX =    0.0                 !
! D14   D(9,3,4,10)            -0.0017         -DE/DX =    0.0                 !
! D15   D(12,3,4,5)             0.0064         -DE/DX =    0.0                 !
! D16   D(12,3,4,10)         -180.003          -DE/DX =    0.0                 !
! D17   D(4,3,12,2)             0.0001         -DE/DX =    0.0                 !
! D18   D(4,3,12,8)           179.9985         -DE/DX =    0.0                 !
! D19   D(9,3,12,2)          -180.0014         -DE/DX =    0.0                 !
! D20   D(9,3,12,8)            -0.003          -DE/DX =    0.0                 !
! D21   D(3,4,5,1)             -0.0114         -DE/DX =    0.0                 !
! D22   D(3,4,5,11)          -180.0069         -DE/DX =    0.0                 !
! D23   D(10,4,5,1)          -180.0022         -DE/DX =    0.0                 !
! D24   D(10,4,5,11)            0.0023         -DE/DX =    0.0                 !
--------------------------------------------------------------------------------
GradGradGradGradGradGradGradGradGradGradGradGradGradGradGradGradGradGrad
Frequency analysis of Boratabenzene
Frequency analysis has been completed for boratabenzene, the calculation was set up using the optimised log file for boratabenzene, the basis set and method remain the same as the ones used for the optimisation calculation. The calculation was modified by the job type being a frequency calculation. The calculation was submitted to the HPC service and deposited in the D-space, DOI: DOI:10042/23747
| File Name | boratabenzene_freq_le110_log |
| File Type | .log |
| Calculation Type | FREQ |
| Calculation Method | RB3LYP |
| Basis Set | 6-31G(d,P) |
| Energy E(RB3LYP) | -219.02052984 au |
| RMS Gradient Norm. | 0.00015781 au |
| Dipole Moment | 2.85 D |
| Point Group | C1 |
| Job CPU Time | 4 minutes 54.2 seconds |
The calculation has converged.
        Item               Value     Threshold  Converged?
Maximum Force            0.000434     0.000450     YES
RMS     Force            0.000158     0.000300     YES
Maximum Displacement     0.000889     0.001800     YES
RMS     Displacement     0.000395     0.001200     YES
Predicted change in Energy=-7.166783D-07
Optimization completed.
   -- Stationary point found.
The low frequencies are low and within the appropriate range. The lowest real frequency is 371cm-1 while the highest low frequency is 18, as this is much smaller the data appears to be correct. The real frequencies are all positive and are tabulated below.
Low frequencies ---  -13.1291   -0.0012   -0.0011   -0.0007   15.0628   18.1728
Low frequencies ---  371.3456  404.2330  565.2518
| Mode | Frequency (cm-1) | IR Intensity | Mode | Frequency (cm-1) | IR Intensity |
| 1 | 371 | 2 | 16 | 1085 | 3 |
| 2 | 404 | 0 | 17 | 1175 | 1 |
| 3 | 565 | 0 | 18 | 1180 | 1 |
| 4 | 568 | 0 | 19 | 1228 | 1 |
| 5 | 608 | 11 | 20 | 1333 | 31 |
| 6 | 711 | 3 | 21 | 1449 | 9 |
| 7 | 757 | 7 | 22 | 1463 | 14 |
| 8 | 814 | 0 | 23 | 1564 | 7 |
| 9 | 873 | 28 | 24 | 1592 | 40 |
| 10 | 906 | 0 | 25 | 2447 | 368 |
| 11 | 917 | 1 | 26 | 3028 | 109 |
| 12 | 951 | 0 | 27 | 3030 | 2 |
| 13 | 951 | 0 | 28 | 3060 | 378 |
| 14 | 960 | 2 | 29 | 3062 | 8 |
| 15 | 1012 | 4 | 30 | 3116 | 113 |
Molecular Orbital Analysis of Boratabenzene
The molecular orbitals for boron have been computed by opening the .chk file from the optimisation of boratabenzne. The new job type is now set to energy the basis set 6-31G(d,p) is used, under the NBO tab select FULL NBO and add the additional key words to the text box "pop=full". The calculation was then sent to the HPC service and deposited in the D-space, here is the DOI link. DOI:10042/23756 I have discussed three of the MO's of boratabenzene and compared them respectively to the corresponding benzene MO's which can be found in the section heading MO comparisons.
Natural Bond Order (NBO) Analysis of Boratabenzene
The boratabenzene .log file has been opened from the population analysis. The NBO were viewed by going to results tab and charge distribution was selected, a new window appeared and NBO selected as the type and colour atoms by charge.
The colour range used was -0.588 to +0.588. The red colour indicates a negative charge the darker and more intense the colour the more negative the atom and green represents a positive charge. The carbon is electronegative due to the delocalised electrons being above and below the plane of the carbons, the delocalised charges is further from the Hydrogens allowing them to be electropositive. Numerical charge distribution of NBO for boratabenzene left and colour change representing electron distribution of NBO in boratabenzene on the right.


The carbons that are ortho and para to the boron are the most electronegative having numerical charge values of -0.588 and -0.340 respectively. The carbons in the meta positions are less electronegative having a value of -0.250. Boron is electropositive with a value of 0.202 and the hydrogen attached to this atom is electronegative at -0.096. The other hydrogens which are attached to the carbon atoms are all electropositive ranging from the ortho H's at 0.184 and para H's at 0.186, while the meta H's have a value of 0.179. These values give an insight into the resonance forms experienced by boratabenzene and also give an indication to chemical reactivity, the ortho carbons are nearest to the negative charge that is on boron therefore this increases the electron distribution on these carbon atoms making them more electronegative. It is also apparent that the meta carbons don't experience the localised negative charge in the resonance structures as they are less electronegative compared the other carbon atoms. In the resonance structures boron must mainly be electron deficient which explains the positive charge of 0.202, boron is less electronegative compared to carbon. The resonance structures are shown below.

Computational Analysis of Pyridinium
Optimisation of Pyridinium

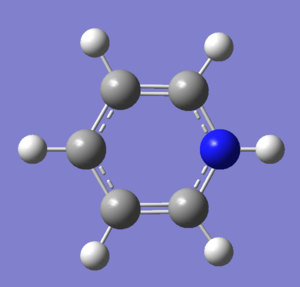
Pyridinium has a similar structure to benzene, the difference being that one Nitrogen atom replaces a carbon atom in the planar ring. The structure is isoelectronic with benzene after adding a positive charge on Nitrogen of +1. The structure was created in gaussview, a benzene structure was created and viewed using the molecular viewer window, one of the carbon atoms was replaced with a nitrogen atom using the periodic table button. The optimisation calculation was then generated by opening gaussian calculation set-up, the job type was selected as an optimisation and the method used was RB3LYP/DFT, along with basis set 6-31G(d,p) and the charge set to 1. The calculation was submitted to the HPC service and deposited in the D-space, here is the DOI:10042/23777
The calculation has converged, shown in the table below.
        Item               Value     Threshold  Converged?
Maximum Force            0.000072     0.000450     YES
RMS     Force            0.000029     0.000300     YES
Maximum Displacement     0.000771     0.001800     YES
RMS     Displacement     0.000194     0.001200     YES
Predicted change in Energy=-9.518388D-08
Optimization completed.
   -- Stationary point found.
The table below shows the optimised Bond Length of C-H 1.08 Angstroms (Å), N-H 1.02 Angstroms (Å), N-C 1.35 Angstroms (Å) and C-C 1.38 Angstroms (Å) .
                          ----------------------------
                          !   Optimized Parameters   !
                          ! (Angstroms and Degrees)  !
--------------------------                            --------------------------
! Name  Definition              Value          Derivative Info.                !
--------------------------------------------------------------------------------
! R1    R(1,2)                  1.3808         -DE/DX =    0.0                 !
! R2    R(1,5)                  1.3959         -DE/DX =   -0.0001              !
! R3    R(1,6)                  1.0817         -DE/DX =    0.0                 !
! R4    R(2,7)                  1.0815         -DE/DX =    0.0                 !
! R5    R(2,12)                 1.3504         -DE/DX =    0.0001              !
! R6    R(3,4)                  1.3808         -DE/DX =    0.0                 !
! R7    R(3,9)                  1.0815         -DE/DX =    0.0                 !
! R8    R(3,12)                 1.3505         -DE/DX =    0.0001              !
! R9    R(4,5)                  1.396          -DE/DX =   -0.0001              !
! R10   R(4,10)                 1.0817         -DE/DX =    0.0                 !
! R11   R(5,11)                 1.0834         -DE/DX =    0.0                 !
! R12   R(8,12)                 1.016          -DE/DX =   -0.0001              !
! A1    A(2,1,5)              119.0839         -DE/DX =    0.0                 !
! A2    A(2,1,6)              119.4333         -DE/DX =    0.0                 !
! A3    A(5,1,6)              121.4828         -DE/DX =   -0.0001              !
! A4    A(1,2,7)              123.8969         -DE/DX =    0.0                 !
! A5    A(1,2,12)             119.2614         -DE/DX =    0.0                 !
! A6    A(7,2,12)             116.8417         -DE/DX =    0.0                 !
! A7    A(4,3,9)              123.9007         -DE/DX =    0.0                 !
! A8    A(4,3,12)             119.2604         -DE/DX =    0.0                 !
! A9    A(9,3,12)             116.8389         -DE/DX =    0.0                 !
! A10   A(3,4,5)              119.0847         -DE/DX =    0.0                 !
! A11   A(3,4,10)             119.4357         -DE/DX =    0.0                 !
! A12   A(5,4,10)             121.4796         -DE/DX =   -0.0001              !
! A13   A(1,5,4)              120.0694         -DE/DX =    0.0                 !
! A14   A(1,5,11)             119.9669         -DE/DX =    0.0                 !
! A15   A(4,5,11)             119.9637         -DE/DX =    0.0                 !
! A16   A(2,12,3)             123.2402         -DE/DX =   -0.0001              !
! A17   A(2,12,8)             118.3808         -DE/DX =    0.0                 !
! A18   A(3,12,8)             118.3791         -DE/DX =    0.0                 !
! D1    D(5,1,2,7)           -180.0009         -DE/DX =    0.0                 !
! D2    D(5,1,2,12)             0.0028         -DE/DX =    0.0                 !
! D3    D(6,1,2,7)             -0.0011         -DE/DX =    0.0                 !
! D4    D(6,1,2,12)           180.0026         -DE/DX =    0.0                 !
! D5    D(2,1,5,4)             -0.0005         -DE/DX =    0.0                 !
! D6    D(2,1,5,11)          -180.0012         -DE/DX =    0.0                 !
! D7    D(6,1,5,4)           -180.0003         -DE/DX =    0.0                 !
! D8    D(6,1,5,11)            -0.0009         -DE/DX =    0.0                 !
! D9    D(1,2,12,3)            -0.004          -DE/DX =    0.0                 !
! D10   D(1,2,12,8)          -180.0028         -DE/DX =    0.0                 !
! D11   D(7,2,12,3)          -180.0006         -DE/DX =    0.0                 !
! D12   D(7,2,12,8)             0.0006         -DE/DX =    0.0                 !
! D13   D(9,3,4,5)            180.0007         -DE/DX =    0.0                 !
! D14   D(9,3,4,10)            -0.0003         -DE/DX =    0.0                 !
! D15   D(12,3,4,5)            -0.0002         -DE/DX =    0.0                 !
! D16   D(12,3,4,10)         -180.0011         -DE/DX =    0.0                 !
! D17   D(4,3,12,2)             0.0027         -DE/DX =    0.0                 !
! D18   D(4,3,12,8)           180.0014         -DE/DX =    0.0                 !
! D19   D(9,3,12,2)           180.0019         -DE/DX =    0.0                 !
! D20   D(9,3,12,8)             0.0007         -DE/DX =    0.0                 !
! D21   D(3,4,5,1)             -0.0008         -DE/DX =    0.0                 !
! D22   D(3,4,5,11)          -180.0002         -DE/DX =    0.0                 !
! D23   D(10,4,5,1)           180.0001         -DE/DX =    0.0                 !
! D24   D(10,4,5,11)            0.0008         -DE/DX =    0.0                 !
--------------------------------------------------------------------------------
Frequency analysis for Pyridinium
Frequency analysis has been completed for pyridinium, the calculation was set up using the optimised log file for pyridinium, the basis set and method remain the same as the ones used for the optimisation calculation. The calculation was modified by the job type being a frequency calculation. The calculation was submitted to the HPC service and deposited in the D-space, DOI:10042/23778 :
| File Name | pyridinium |
| File Type | .log |
| Calculation Type | FREQ |
| Calculation Method | RB3LYP |
| Basis Set | 6-31G(d,P) |
| Energy E(RB3LYP) | -248.71789063 au |
| RMS Gradient Norm. | 0.00005191 au |
| Dipole Moment | 1.87 D |
| Point Group | C1 |
| Job CPU Time | 6 minutes 54.6 seconds |
The calculation has converged.
        Item               Value     Threshold  Converged?
Maximum Force            0.000202     0.000450     YES
RMS     Force            0.000052     0.000300     YES
Maximum Displacement     0.000841     0.001800     YES
RMS     Displacement     0.000249     0.001200     YES
The low frequencies are low and within the appropriate range. The lowest real frequency is 391cm-1 while the highest low frequency is 18, as this is much smaller the data appears to be correct. The real frequencies are all positive and are tabulated below.
Low frequencies ---   -9.1018    0.0005    0.0006    0.0007   15.1624   17.5117
Low frequencies ---  390.7090  403.1231  623.3414
| Mode | Frequency (cm-1) | IR Intensity | Mode | Frequency (cm-1) | IR Intensity |
| 1 | 390 | 1 | 16 | 1199 | 3 |
| 2 | 403 | 0 | 17 | 1226 | 2 |
| 3 | 623 | 0 | 18 | 1291 | 4 |
| 4 | 647 | 0 | 19 | 1360 | 11 |
| 5 | 680 | 99 | 20 | 1415 | 4 |
| 6 | 748 | 85 | 21 | 1517 | 23 |
| 7 | 857 | 7 | 22 | 1575 | 41 |
| 8 | 884 | 0 | 23 | 1649 | 37 |
| 9 | 997 | 2 | 24 | 1666 | 33 |
| 10 | 1012 | 0 | 25 | 3203 | 0 |
| 11 | 1019 | 3 | 26 | 3220 | 0 |
| 12 | 1049 | 1 | 27 | 3221 | 12 |
| 13 | 1054 | 1 | 28 | 3231 | 21 |
| 14 | 1079 | 3 | 29 | 3233 | 0 |
| 15 | 1083 | 5 | 30 | 3551 | 162 |
Molecular Orbital Analysis of Pyridinium
The molecular orbitals for boron have been computed by opening the .chk file from the optimisation of pyridinium . The new job type is now set to energy the basis set 6-31G(d,p) is used, under the NBO tab select FULL NBO and add the additional key words to the text box"pop=full". The calculation was then sent to the HPC service and deposited in the D-space, here is the DOI link. DOI:10042/23779 I have discussed three of the MO's of pyridinium and compared them respectively to the corresponding benzene MO's which can be found in the section heading MO comparisons.
Natural Bond Order (NBO) Analysis of Pyridinium
The pyridinium .log file has been opened from the population analysis. The NBO were viewed by going to results tab and charge distribution was selected, a new window appeared and NBO selected as the type and colour atoms by charge.
The colour range used was -0.488 to +0.488. The red colour indicates a negative charge the darker and more intense the colour the more negative the atom and green represents a positive charge. The numerical charge distribution of NBO is shown on the left and colour change representing electron distribution of NBO is on the right.


The carbons that are meta and para to the nitrogen are the most electronegative having numerical charge values of -0.198 and -0.073 respectively. The carbons in the ortho positions are electropositive having a value of 0.117. Nitrogen is electronegative with a value of -0.436 and the hydrogen attached to this atom is more electropositive at 0.441 compared to the other hyrdogens. The other hydrogens which are attached to the carbon atoms are all electropositive ranging from the ortho H's at 0.240 and para H's at 0.244, while the meta H's have a value of 0.253. These values give an insight into the resonance forms experienced by pyridinium and also give an indication to chemical reactivity. The ortho carbons are nearest to the positive charge that is on Nitrogen therefore this decreases the electron distribution on these carbon atoms making them more electronpositive, the nitrogen withdraws electron density being the more electronegative atom of the two. It is also apparent that the meta carbons experience no localised positive charge in the resonance structures as they are the most electronegative compared the other carbon atoms. In the resonance structures Nitrogen must mainly be electron sufficient which explains the negative charge of -0.436. The resonance structures are shown below.

Computational Analysis of Borazine
Optimisation of Borazine

Borazine has an analogous structure to benzene, the difference being that Nitrogen and Boron atoms replace the carbon atoms in an alternating fashion. The structure was created in gaussview, a benzene structure was created and viewed using the molecular viewer window, the carbon atoms were replaced with nitrogen and boron atoms using the periodic table button. The optimisation calculation was then generated by opening gaussian calculation set-up, the job type was selected as an optimisation and the method used was RB3LYP/DFT, along with basis set 6-31G(d,p) and the charge set to 0. The calculation was submitted to the HPC service and deposited in the D-space, here is the DOI:10042/23791
The calculation has converged, shown in the table below.
        Item               Value     Threshold  Converged?
Maximum Force            0.000117     0.000450     YES
RMS     Force            0.000036     0.000300     YES
Maximum Displacement     0.000327     0.001800     YES
RMS     Displacement     0.000104     0.001200     YES
Predicted change in Energy=-1.206131D-07
Optimization completed.
   -- Stationary point found.
The table below shows the optimised Bond Length of B-H 1.19 Angstroms (Å), N-H 1.01 Angstroms (Å) and N-B 1.43 Angstroms (Å).
                          ----------------------------
                          !   Optimized Parameters   !
                          ! (Angstroms and Degrees)  !
--------------------------                            --------------------------
! Name  Definition              Value          Derivative Info.                !
--------------------------------------------------------------------------------
! R1    R(1,9)                  1.0097         -DE/DX =    0.0                 !
! R2    R(2,11)                 1.1949         -DE/DX =    0.0001              !
! R3    R(3,8)                  1.0097         -DE/DX =    0.0                 !
! R4    R(4,10)                 1.1949         -DE/DX =    0.0001              !
! R5    R(5,7)                  1.0097         -DE/DX =    0.0                 !
! R6    R(6,12)                 1.1949         -DE/DX =    0.0001              !
! R7    R(7,10)                 1.4307         -DE/DX =   -0.0001              !
! R8    R(7,12)                 1.4307         -DE/DX =    0.0                 !
! R9    R(8,10)                 1.4307         -DE/DX =   -0.0001              !
! R10   R(8,11)                 1.4306         -DE/DX =    0.0                 !
! R11   R(9,11)                 1.4307         -DE/DX =   -0.0001              !
! R12   R(9,12)                 1.4306         -DE/DX =    0.0                 !
! A1    A(5,7,10)             118.5605         -DE/DX =    0.0                 !
! A2    A(5,7,12)             118.5554         -DE/DX =    0.0                 !
! A3    A(10,7,12)            122.884          -DE/DX =    0.0                 !
! A4    A(3,8,10)             118.5663         -DE/DX =    0.0                 !
! A5    A(3,8,11)             118.5598         -DE/DX =    0.0                 !
! A6    A(10,8,11)            122.8739         -DE/DX =    0.0                 !
! A7    A(1,9,11)             118.5672         -DE/DX =    0.0                 !
! A8    A(1,9,12)             118.5621         -DE/DX =    0.0                 !
! A9    A(11,9,12)            122.8707         -DE/DX =    0.0                 !
! A10   A(4,10,7)             121.4457         -DE/DX =    0.0                 !
! A11   A(4,10,8)             121.4367         -DE/DX =    0.0                 !
! A12   A(7,10,8)             117.1176         -DE/DX =    0.0                 !
! A13   A(2,11,8)             121.437          -DE/DX =    0.0                 !
! A14   A(2,11,9)             121.4314         -DE/DX =    0.0                 !
! A15   A(8,11,9)             117.1316         -DE/DX =    0.0                 !
! A16   A(6,12,7)             121.4339         -DE/DX =    0.0                 !
! A17   A(6,12,9)             121.4439         -DE/DX =    0.0                 !
! A18   A(7,12,9)             117.1222         -DE/DX =    0.0                 !
! D1    D(5,7,10,4)             0.0008         -DE/DX =    0.0                 !
! D2    D(5,7,10,8)           180.0            -DE/DX =    0.0                 !
! D3    D(12,7,10,4)         -179.9977         -DE/DX =    0.0                 !
! D4    D(12,7,10,8)            0.0015         -DE/DX =    0.0                 !
! D5    D(5,7,12,6)            -0.0006         -DE/DX =    0.0                 !
! D6    D(5,7,12,9)           179.9989         -DE/DX =    0.0                 !
! D7    D(10,7,12,6)          179.9979         -DE/DX =    0.0                 !
! D8    D(10,7,12,9)           -0.0026         -DE/DX =    0.0                 !
! D9    D(3,8,10,4)            -0.0012         -DE/DX =    0.0                 !
! D10   D(3,8,10,7)           179.9995         -DE/DX =    0.0                 !
! D11   D(11,8,10,4)          180.0002         -DE/DX =    0.0                 !
! D12   D(11,8,10,7)            0.0009         -DE/DX =    0.0                 !
! D13   D(3,8,11,2)             0.0011         -DE/DX =    0.0                 !
! D14   D(3,8,11,9)          -180.0008         -DE/DX =    0.0                 !
! D15   D(10,8,11,2)          179.9997         -DE/DX =    0.0                 !
! D16   D(10,8,11,9)           -0.0022         -DE/DX =    0.0                 !
! D17   D(1,9,11,2)            -0.0012         -DE/DX =    0.0                 !
! D18   D(1,9,11,8)           180.0007         -DE/DX =    0.0                 !
! D19   D(12,9,11,2)         -180.0008         -DE/DX =    0.0                 !
! D20   D(12,9,11,8)            0.0011         -DE/DX =    0.0                 !
! D21   D(1,9,12,6)             0.0011         -DE/DX =    0.0                 !
! D22   D(1,9,12,7)          -179.9984         -DE/DX =    0.0                 !
! D23   D(11,9,12,6)         -179.9993         -DE/DX =    0.0                 !
! D24   D(11,9,12,7)            0.0012         -DE/DX =    0.0                 !
--------------------------------------------------------------------------------
Frequency analysis for Borazine
Frequency analysis has been completed for borazine, the calculation was set up using the optimised log file for borazine, the basis set and method remain the same as the ones used for the optimisation calculation. The calculation was modified by the job type being a frequency calculation. The calculation was submitted to the HPC service and deposited in the D-space, DOI:10042/23800
| File Name | borazine_freq_log |
| File Type | .log |
| Calculation Type | FREQ |
| Calculation Method | RB3LYP |
| Basis Set | 6-31G(d,P) |
| Energy E(RB3LYP) | -242.68459789 au |
| RMS Gradient Norm. | 0.00007121 au |
| Dipole Moment | 0.00 D |
| Point Group | C1 |
| Job CPU Time | 4 minutes 9.9 seconds |
The calculation has converged.
       Item               Value     Threshold  Converged?
Maximum Force            0.000206     0.000450     YES
RMS     Force            0.000071     0.000300     YES
Maximum Displacement     0.000379     0.001800     YES
RMS     Displacement     0.000137     0.001200     YES
Predicted change in Energy=-1.383509D-07
Optimization completed.
   -- Stationary point found.
The low frequencies are low and within the appropriate range. The lowest real frequency is 289cm-1 while the highest low frequency is 11, as this is much smaller the data appears to be correct. The real frequencies are all positive and are tabulated below.
Low frequencies ---  -11.1389   -0.0011   -0.0009   -0.0003    8.7190   11.2074
Low frequencies ---  288.5030  290.4086  404.0146
| Mode | Frequency (cm-1) | IR Intensity | Mode | Frequency (cm-1) | IR Intensity |
| 1 | 289 | 0 | 16 | 1052 | 0 |
| 2 | 290 | 0 | 17 | 1080 | 0 |
| 3 | 404 | 24 | 18 | 1081 | 0 |
| 4 | 525 | 1 | 19 | 1245 | 0 |
| 5 | 525 | 1 | 20 | 1314 | 0 |
| 6 | 709 | 0 | 21 | 1400 | 11 |
| 7 | 711 | 0 | 22 | 1400 | 11 |
| 8 | 732 | 60 | 23 | 1492 | 494 |
| 9 | 864 | 0 | 24 | 1492 | 494 |
| 10 | 927 | 0 | 25 | 2641 | 284 |
| 11 | 928 | 0 | 26 | 2641 | 284 |
| 12 | 937 | 236 | 27 | 2651 | 0 |
| 13 | 944 | 0 | 28 | 3642 | 0 |
| 14 | 945 | 0 | 29 | 3644 | 39 |
| 15 | 945 | 0 | 30 | 3644 | 40 |
Molecular Orbital Analysis of Borazine
The molecular orbitals for boron have been computed by opening the .chk file from the optimisation of borazine. The new job type is now set to energy the basis set 6-31G(d,p) is used, under the NBO tab select FULL NBO and add the additional key words to the text box "pop=full". The calculation was then sent to the HPC service and deposited in the D-space, here is the DOI link. DOI:10042/23804
I have discussed three of the MO's of borazine and compared them respectively to the corresponding benzene MO's which can be found in the section heading MO comparisons.
Natural Bond Order (NBO) Analysis of Borazine
The borazine .log file has been opened from the population analysis. The NBO were viewed by going to results tab and charge distribution was selected, a new window appeared and NBO selected as the type and colour atoms by charge.
The colour range used was -1.102 to +1.102. The red colour indicates a negative charge the darker and more intense the colour the more negative the atom and green represents a positive charge. The numerical charge distribution of NBO is shown on the left and colour change representing electron distribution of NBO is on the right.
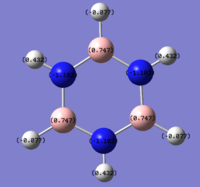
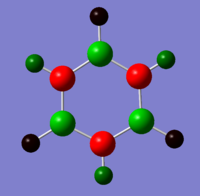
The borazine is electropositive at 0.747 while the nitrogen is electronegative at -1.102, the hydrogens attached to the boron atoms are electronegative at -0.077 and the hydrogens attached to the nitrogen atoms are electropositive at 0.432. Nitrogen is more electronegative than boron and therefore withdraws electron density more efficiently from the ring system and from the hydrogens, this creates the alternating pattern of electropositive to electronegative atoms in the ring system.
Comparison Between Aromatic Structures
Molecular Orbital (MO) Comparison between Aromatics
Natural Bond Order (NBO) Comparison between Aromatics
References
- ↑ M. Schuurman, W. Allen, H. Schaefer, Journal of Computational Chemistry, 2005, 26 (11), 1106. DOI 10.1002/jcc.20238.
- ↑ M. Anatosov et al., J. Phys. Chem. ,2001,105, 5450 - 5467.
- ↑ J. Glaser, G. Johansson, Acta Chemica Scandinavica , 1982, 36,125-135.
- ↑ A. F. Holleman, E. Wiberg, N. Wiberg, Inorg. Chem., pg 1760.
- ↑ C. Ballhausen, H. Gray, Inorg. Chem. , 1 (1), 1962, pp 111-122.
- ↑ 6.0 6.1 Lewis, Gilbert N. (1916). "The Atom and the Molecule". Journal of the American Chemical Society 38: 772.
- ↑ S.Szabo, C.F. Bri, G.b Czako, E. M. Tyus, and A. G. Csa ́sza ́; Journal of American Chem. Soc." 4356−4362.
- ↑ H. Burgi et al., Angewandte Chemie, 1995, 34(13), 1454-1456.

