Rep:Mod:LBinfieldWiki
Lucy Binfield: Year Three Computational Chemistry Lab
The following calculations were carried out using Gaussian 5.0.9, a program which allows users to design and construct molecules on which to run gaussian Calculations. It is a powerful tool for investigating reactions that might be toxic, expensive or time consuming in the lab. When necessary, Gaussian calculations were run using the Imperial College Utility Computing service
Week one - Exercises
BH3
I first optimised BH3 using a 312G Basis set. Each time I ran an optimization, I checked that the values had converged and added the 'item' table to this Wiki along with a summary of the calculation:
Link to the BH3 optimization using the 312g basis set
| Bh3 optimization | ||
| File Type | .log | |
| Calculation Type | FOPT | |
| Calculation Method | RB3LYP | |
| Basis Set | 3-21G | |
| Charge | 0 | |
| Spin | Singlet | |
| Total Energy | -26.46226338 | a.u. |
| RMS Gradient Norm | 0.00020672 | a.u. |
| Dipole Moment | 0 | Debye |
| Point Group | D3H | |
| Job time | 6 seconds | |
        Item               Value     Threshold  Converged?
Maximum Force            0.000413     0.000450     YES
RMS     Force            0.000271     0.000300     YES
Maximum Displacement     0.001610     0.001800     YES
RMS     Displacement     0.001054     0.001200     YES
Predicted change in Energy=-1.071764D-06
Optimization completed.
I then ran an optimization using the B-61G basis set:
        Item               Value     Threshold  Converged?
Maximum Force            0.000433     0.000450     YES
RMS     Force            0.000284     0.000300     YES
Maximum Displacement     0.001702     0.001800     YES
RMS     Displacement     0.001114     0.001200     YES
Predicted change in Energy=-1.189019D-06
Optimization completed.
| BH3 6-31G (d,p) optimization | ||
| Bond length (angstrom) | 1.22503 | |
| Bond angle (degrees) | 120 | |
| Total Energy | -26.61394113 | |
Link to the BH3 Optimization using a 631G basis set
Geometric Intermediates
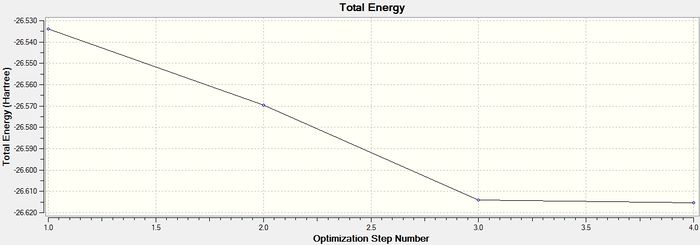
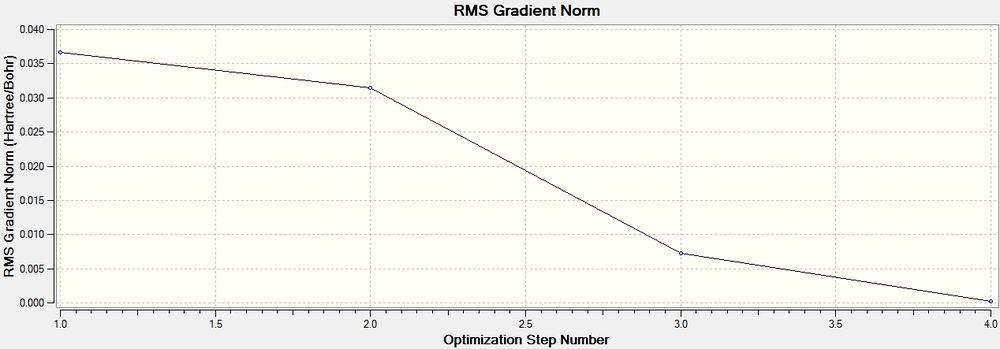
These graphs show how the total energy of the molecule is minimised in a series of steps as the program traverses is potential enegry surface of the molecule and finds a stable point corresponding to an energy minimum or maximum (later I will confirm that it is in this case a minimum by doing a frequency analysis) . The second graph shows the changing gradient of energy change over the same steps: The program is 'looking for' a point where the gradient=zero. At this point the graph converges.
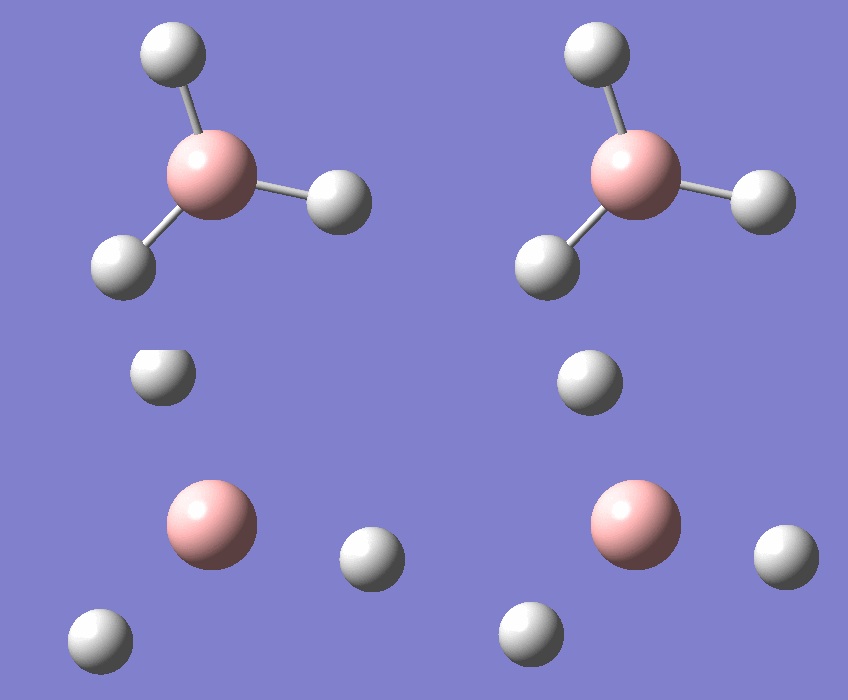
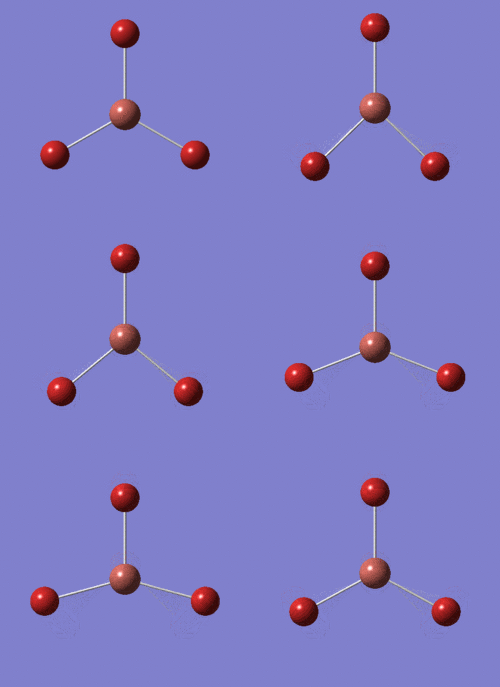
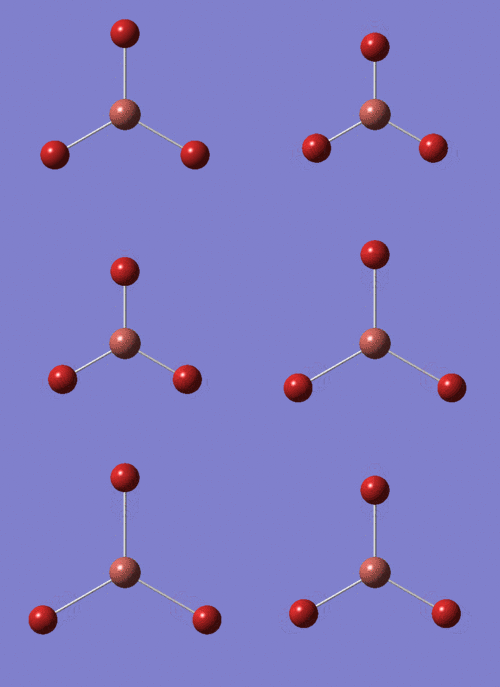
The GIF below shows the molecule going through the four steps to reach its minimum energy. In the first step, the program has not drawn bonds between the atoms. This is because the atoms are far apart enough for the orbitals to have insufficient overlap to form bonds. A 'bond' as referred to in Chemistry is nothing more than a stable energy minimum where the relevant orbitals overlap to form an energetically favourable interaction.
TlBr3
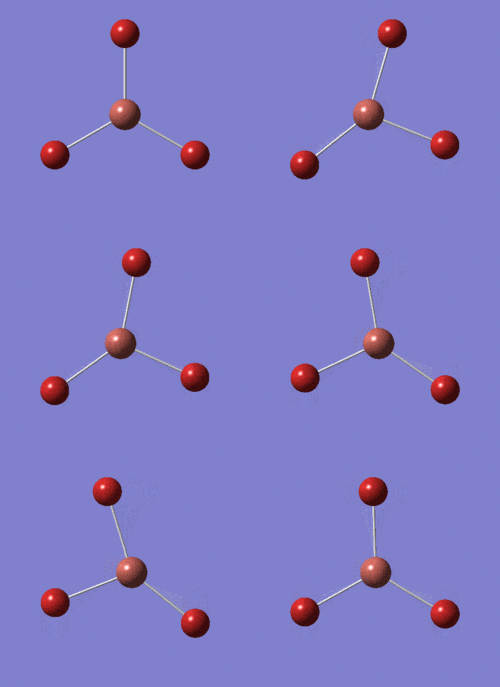
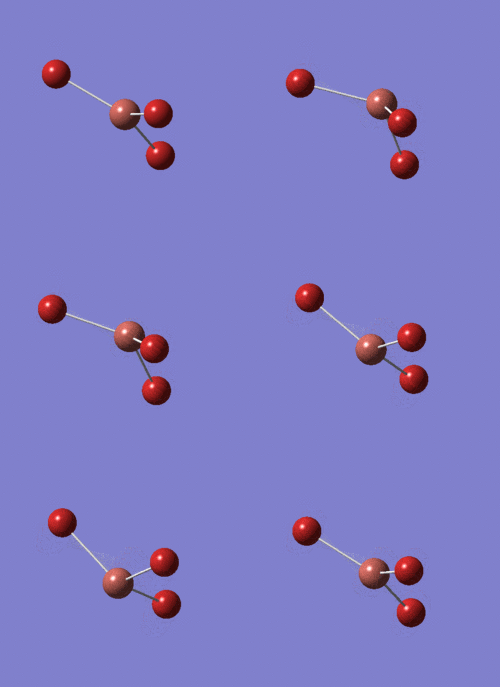
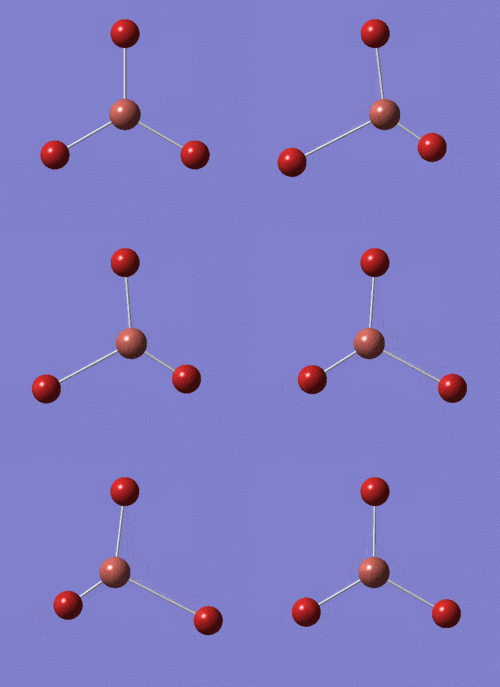
I repeated the steps above for BBr3(in the next section)and TlBr3 (below) , checking that the calculations had converged each time. These molecules differ greatly from BH3 in that BH3 does not exist at room temperature, it will always dimerise.
Item               Value     Threshold  Converged?
Maximum Force            0.000002     0.000450     YES
RMS     Force            0.000001     0.000300     YES
Maximum Displacement     0.000022     0.001800     YES
RMS     Displacement     0.000014     0.001200     YES
Predicted change in Energy=-6.084040D-11
Optimization completed.
| BBr3 optimization | ||
| File Name | Bbr3finished | |
| File Type | .log | |
| Calculation Type | FOPT | |
| Calculation Method | RB3LYP | |
| Basis Set | Gen | |
| Charge | 0 | |
| Spin | Singlet | |
| E(RB3LYP) | -64.43645296 | a.u. |
| RMS Gradient Norm | 0.00000382 | a.u. |
| Imaginary Freq | ||
| Dipole Moment | 0 | Debye |
| Point Group | D3H | |
| Job cpu time: 0 days 0 hours 0 minutes 33.6 seconds. | ||
BBr3
14159
         Item               Value     Threshold  Converged?
 Maximum Force            0.000008     0.000450     YES
 RMS     Force            0.000005     0.000300     YES
 Maximum Displacement     0.000036     0.001800     YES
 RMS     Displacement     0.000023     0.001200     YES
 Predicted change in Energy=-4.027673D-10
 Optimization completed.
| BBr3 optimization | ||
| File Name | Bbr3finished | |
| File Type | .log | |
| Calculation Type | FOPT | |
| Calculation Method | RB3LYP | |
| Basis Set | Gen | |
| Charge | 0 | |
| Spin | Singlet | |
| E(RB3LYP) | -64.43645296 | a.u. |
| RMS Gradient Norm | 0.00000382 | a.u. |
| Imaginary Freq | ||
| Dipole Moment | 0 | Debye |
| Point Group | D3H | |
| Job cpu time: 0 days 0 hours 0 minutes 33.6 seconds. | ||
| Bond lengths and bond angles | |||
| BH3 | TlBr3 | BBr3 | |
| Bond length (angstrom) | 1.22503 | 2.65095 | 1.99396 |
| Bond angle (degrees) | 120 | 120 | 120 |
| Total Energy | -26.61394113 | -91.21812851 | -64.43645296 |
Average Tl-Br bond lengths have been calculated in literature to be around 2.5 Angstrom which is coherent with my calculations.[1]. The bond between Thallium and bromine is, as expected, longer that the B-Br bond in BBr3 which is also coherent with the previously recorded bond length of 1.893254Å[2]. This is due to the stronger overlap between B and Br. Thallium is a much bigger and more diffuse atom as well as being a metal whereas Boron is a non-metal, althouh they are both is group 13. The B-H bond in BH3 was calculated to be even shorter by Gaussian, and the theoretically determined B-H bond distance in literature is slightly shorter at 1.19Å[3] H is a tiny electropositive ligand with no lone pairs. Br is elecronegative and therefore has less diffuse and smaller orbitals, which in part explains its weaker bond with Boron.
Frequency Analysis
BH3
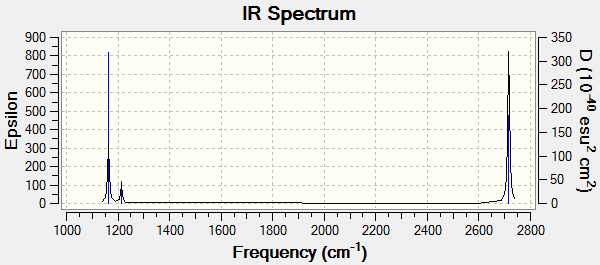
A frequency analysis was run on the optimised BH3 molecule to ensure a minima was found. The 'low frequency' values below confirm the presence of such a minimum since there are no non-zero frequencies and the 'low frequencies' are all below 20cm-1.
Link to the frequency analysis of BH3
| BH3 Frequency optimization | ||
| File Name | BH3frequency3 | |
| File Type | .log | |
| Calculation Type | FREQ | |
| Calculation Method | RB3LYP | |
| Basis Set | 6-31G(d,p) | |
| Charge | 0 | |
| Spin | Singlet | |
| E(RB3LYP) | -26.61532364 | a.u. |
| RMS Gradient Norm | 0.00000162 | a.u. |
| Imaginary Freq | 0 | |
| Dipole Moment | 0 | Debye |
| Point Group | D3H | |
| Job cpu time: 0 days 0 hours 0 minutes 11.0 seconds. | ||
Item               Value     Threshold  Converged?
 Maximum Force            0.000003     0.000015     YES
 RMS     Force            0.000002     0.000010     YES
 Maximum Displacement     0.000013     0.000060     YES
 RMS     Displacement     0.000008     0.000040     YES
 Predicted change in Energy=-6.170060D-11
 Optimization completed.
    -- Stationary point found.

Low frequencies ---   -7.0794   -7.0439   -0.0279   -0.0006    0.7084    6.6303
 Low frequencies --- 1163.0023 1213.1577 1213.1579
Below are the vibrational frequencies of the molecules, given by the Gaussian frequency analysis.
The IR spectrum of BH3 was also generated showing the energies of the vibrations. As vibrations 2, 3, 5 and 6 are each doubly degenerate and 4 has zero intensity, 3 peaks can be seen.
-
.
TlBr3
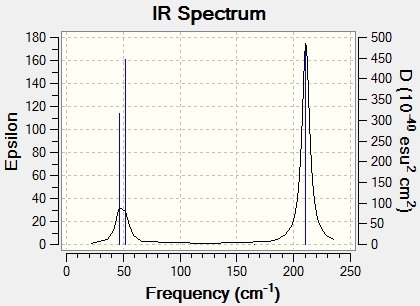
A similar frequency analysis was carried out on TlBr3. The summary and 'low frequencies' are shown below.
Low frequencies ---   -3.4213   -0.0026   -0.0004    0.0015    3.9367    3.9367
 Low frequencies ---   46.4289   46.4292   52.1449
| TlBr3 freq anal | ||
| File Name | TLBR3_FREQ_FIRST | |
| File Type | .log | |
| Calculation Type | FREQ | |
| Calculation Method | RB3LYP | |
| Basis Set | LANL2DZ | |
| Charge | 0 | |
| Spin | Singlet | |
| E(RB3LYP) | -91.21812851 | a.u. |
| RMS Gradient Norm | 0.00000088 | a.u. |
| Imaginary Freq | 0 | |
| Dipole Moment | 0 | Debye |
| Point Group | D3H | |
| Job cpu time: 0 days 0 hours 0 minutes 15.0 seconds. | ||
The lowest 'real' frequency as can be seen is 46cm-1.
The IR spectrum of TLBr3 was calculated thus by gaussian. 3 peaks can be seen.
Comparison
| no. | BH3 | ' | TlBr3 | ' |
| Frequency | Intensity | Frequency | Intensity | |
| 1 | 1163.0 | 96.5 | 46.4 | 4.0 |
| 2 | 1213.2 | 14.0 | 46.4 | 4.0 |
| 3 | 1213.2 | 14.0 | 52.1 | 6.0 |
| 4 | 2582.5 | 0 | 165.3 | 0.0 |
| 5 | 2715.6 | 126.3 | 210.7 | 25.5 |
| 6 | 2715.6 | 126.3 | 210.7 | 25.5 |
From this comparison table of the vibration energies of the two molecules various differences can be seen. Although the two molecules both have the same point group and therefore the same symmetries of vibration and the IR spectrum of both contains 3 peaks the intensities and frequencies of the vibrations are very different. This si due to the huge difference in Bond length and strength between the two molecules- The H-Br bond is much shorter (1.19 compared with 2.5 Å) and there is much greater overlap of orbitals leading to greater mixing and higher intensity vibrations.
MO diagram for BH3
The molecular orbitals for BH3 were created using a Guassian calculation and are shown below in context with the qualitative MO diagram for the same compound. The LCAO's are a different shape than the calculated molecular orbitals but they have the same symmetry, which is why LCAO theory is very useful for determining which symmettr the atomic orbitals will have.
NH3
 Item               Value     Threshold  Converged?
 Maximum Force            0.000048     0.000450     YES
 RMS     Force            0.000025     0.000300     YES
 Maximum Displacement     0.000522     0.001800     YES
 RMS     Displacement     0.000253     0.001200     YES
 Predicted change in Energy=-1.826229D-08
 Optimization completed.
    -- Stationary point found.
| nh3 optimisation | ||
| File Name | nh3_optimised_lucyb | |
| File Type | .log | |
| Calculation Type | FOPT | |
| Calculation Method | RHF | |
| Basis Set | 6-31G | |
| Charge | 0 | |
| Spin | Singlet | |
| E(RHF) | -56.16552123 | a.u. |
| RMS Gradient Norm | 0.00002194 | a.u. |
| Imaginary Freq | ||
| Dipole Moment | 1.3849 | Debye |
| Point Group | C1 | |
| Job cpu time: 0 days 0 hours 0 minutes 42.0 seconds.| | ||
link to the optimized ammonia molecule
Frequency analysis
| nh3 freq | ||
| File Name | nh3_freq_lucyb | |
| File Type | .log | |
| Calculation Type | FREQ | |
| Calculation Method | RHF | |
| Basis Set | 6-31G | |
| Charge | 0 | |
| Spin | Singlet | |
| E(RHF) | -56.1552123 | a.u. |
| RMS Gradient Norm | 0.00002194 | a.u. |
| Imaginary Freq | 0 | |
| Dipole Moment | 1.3849 | Debye |
| Point Group | C1 | |
| Job cpu time: 0 days 0 hours 0 minutes 10.0 seconds.| | ||
Low frequencies --- -21.6461 -9.2607 -0.0014 -0.0007 0.0009 20.4352 Low frequencies --- 599.4246 1814.7492 1814.7973
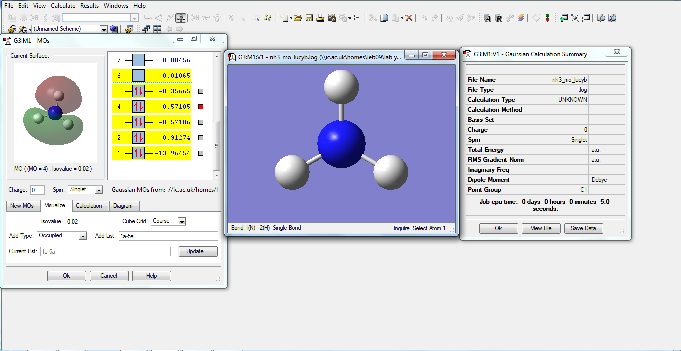
The Molecular orbitals of NH3 were also calculated.
NBO analysis of NH3
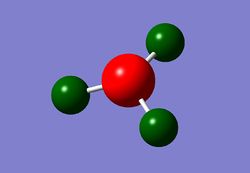
Below are shown representations of NH3 showing the charge distribution around the molecule. Below, the colour range for the below molecule is -1.175≥x≤1.175 debye (red being negative and green positive).
In the picture above, the charge on the central N atom is -1.175debye and the equal and opposite positive partial charges are shared around the attached hydrogens.
Below is a manipulable jmol image of the NH3 molecule I created.
4
NH3 molecule
1 N    -0.5606     0.7990    -0.0104
2 H    -0.3626    -0.1724    -0.0105
3 H    -0.3625     1.2848     0.8308
4 H    -0.3627     1.2847    -0.8516
NHmolecule |
Analysis of Amonia-Borane
Link to the optimised amonia-borane molecule
Item               Value     Threshold  Converged?
 Maximum Force            0.000072     0.000450     YES
 RMS     Force            0.000024     0.000300     YES
 Maximum Displacement     0.000607     0.001800     YES
 RMS     Displacement     0.000270     0.001200     YES
 Predicted change in Energy=-5.817727D-08
 Optimization completed.
    -- Stationary point found.
| amoniaborane 613g optimised | ||
| File Name | amoniaborane_optimised_lucyb | |
| File Type | .log | |
| Calculation Type | FOPT | |
| Calculation Method | RHF | |
| Basis Set | 6-31G(d,p) | |
| Charge | 0 | |
| Spin | Singlet | |
| E(RHF) | -82.62497328 | a.u. |
| RMS Gradient Norm | 0.00002443 | a.u. |
| Imaginary Freq | ||
| Dipole Moment | 5.5408 | Debye |
| Point Group | C3 | |
| Job cpu time: 0 days 0 hours 0 minutes 12.0 seconds. | ||
The below frequency analysis confirms that a minimum was found and the low frequencies are low and there are no negative total frequencies.
Link to the frequency analysis of amonia-borane
Low frequencies ---   -2.9271   -0.0012   -0.0006    0.0008    9.1337    9.1348,
Low frequencies ---  254.4885  600.5654  676.6009
In order to find the BDE of amonia-borane, the total energies of amonia and borane were compared , both separate and apart:
- E(NH3)=-56.1552123 a.u.
- E(BH3)=-26.46226338a.u.
- E(NH3BH3)=-82.62497328 a.u.
- ΔE=E(NH3BH3)-[E(NH3)+E(BH3)]= 0.0074976 a.u. which corresponds to a Bond dissociation energy of around 19.7KJ/mol
Mini project: Ionic Liquids: Designer solvents
In this mini-project, the properties of various ions were compared with respect to their use as 'designer' solvents
Analysis of the N(CH3)4+ cation
An optimization using a 613G basis set was used, the details of which are shown below.
| nh4plus optimisation | ||
| File Name | nh4plus612goptlucyb | |
| File Type | .log | |
| Calculation Type | FOPT | |
| Calculation Method | UHF | |
| Basis Set | 6-31G(d,p) | |
| Charge | 1 | |
| Spin | Singlet | |
| E(UHF) | -212.70422109 | a.u. |
| RMS Gradient Norm | 0.00023677 | a.u. |
| Imaginary Freq | ||
| Dipole Moment | 3.9202 | |
| Point Group | C1 | |
| Job cpu time: 0 days 0 hours 1 minutes 34.0 seconds. | ||
Item               Value     Threshold  Converged?
 Maximum Force            0.000368     0.000450     YES
 RMS     Force            0.000146     0.000300     YES
 Maximum Displacement     0.001327     0.001800     YES
 RMS     Displacement     0.000508     0.001200     YES
 Predicted change in Energy=-2.721171D-06
 Optimization completed.
Optimized Tetramethyl Ammonium cation
N-C bond lengths= 1.4591 Å. C-N-C BOND ANGLE= 109.471
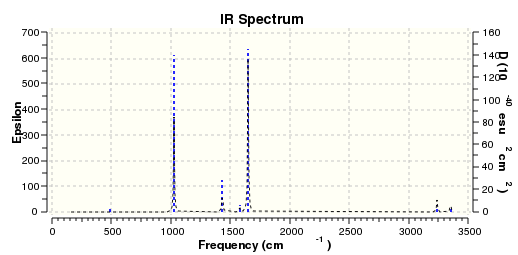
A frequency ananlysis was then carried out. The frequencies imply that a minimum was reached as they are all above zero.
Frequency analysis of Tetramethyl Ammonium cation
Low frequencies ---  -20.8297  -20.8259  -20.8245   -0.0004    0.0003    0.0005
Low frequencies ---  185.3868  306.9859  306.9884
| nh4plus freq | ||
| File Name | scan_nh4plus_freq_lucy | |
| File Type | .log | |
| Calculation Type | FREQ | |
| Calculation Method | UHF | |
| Basis Set | 6-31G(d,p) | |
| Charge | 1 | |
| Spin | Singlet | |
| E(UHF) | -212.7042211 | a.u. |
| RMS Gradient Norm | 0.00023678 | a.u. |
| Imaginary Freq | 0 | |
| Dipole Moment | 3.9202 | Debye |
| Point Group | C1 | |
| Job cpu time: 0 days 0 hours 5 minutes 25.1 seconds. | ||
MO calculations
The MO calculations, shown below, provide us with a picture of how the charge is split up in the molecule.
| nh4plus opt | ||
| File Name | nh4plus612g_mothurs_lucyb | |
| File Type | .log | |
| Calculation Type | SP | |
| Calculation Method | UB3LYP | |
| Basis Set | 6-31G(d,p) | |
| Charge | 1 | |
| Spin | Singlet | |
| E(UB3LYP) | -214.1812718 | a.u. |
| RMS Gradient Norm | a.u. | |
| Imaginary Freq | ||
| Dipole Moment | 3.9203 | Debye |
| Point Group | C1 | |
| Job cpu time: 0 days 0 hours 1 minutes 49.0 seconds. | ||
| no. MO | Annotated MO image | bonding/antibonding |
| 7 |  |
Quite strongly bonding |
| 8 | 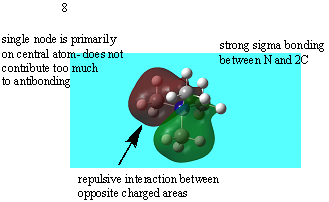 |
Overall Bonding |
| 10 | 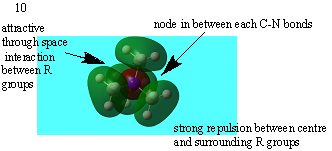 |
strongly antibonding |
| 18 | 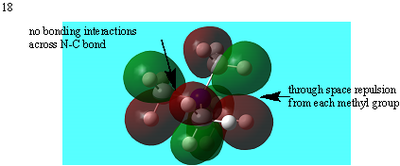 |
Many nodal planes between bonds- strongly antibonding |
| 21 | 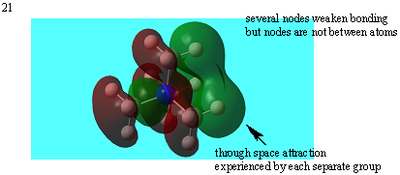 |
Weakly antibonding |
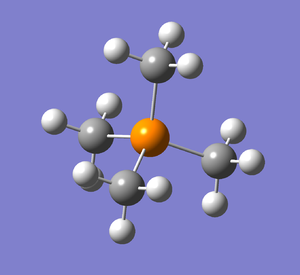
Analysis of the [P(CH3)4]+ cation
A similar analysis was carried out for the equivalent phosphorous cation
P-C bond length- 1.80885Å
| pch4plus optimisation | ||
| File Name | pch4_opt_lucyb | |
| File Type | .log | |
| Calculation Type | FOPT | |
| Calculation Method | RHF | |
| Basis Set | 6-31G(d,p) | |
| Charge | 1 | |
| Spin | Singlet | |
| E(RHF) | -499.0230269 | a.u. |
| RMS Gradient Norm | 0.00002569 | a.u. |
| Imaginary Freq | ||
| Dipole Moment | 3.9202 | Debye |
| Point Group | C1 | |
| Job cpu time: 0 days 0 hours 5 minutes 42.7 seconds. | ||
         Item               Value     Threshold  Converged?
 Maximum Force            0.000110     0.000450     YES
 RMS     Force            0.000025     0.000300     YES
 Maximum Displacement     0.000392     0.001800     YES
 RMS     Displacement     0.000153     0.001200     YES
 Predicted change in Energy=-8.862195D-08
 Optimization completed.
Link to the Tetramethyl Phosphorous cation optimization
Analysis of the [S(CH3)3+] cation
Again using a 613g(d,p) basis set this molecule was optimized and a frequency analysis and MO calculations run
| sulhurcationopt | ||
| File Name | sulphurcation_opt_real_lucy | |
| File Type | .log | |
| Calculation Type | FOPT | |
| Calculation Method | RB3LYP | |
| Basis Set | 6-31G(d,p) | |
| Charge | 1 | |
| Spin | Singlet | |
| E(RB3LYP) | -517.6832745 | a.u. |
| RMS Gradient Norm | 0.00000867 | a.u. |
| Imaginary Freq | ||
| Dipole Moment | 3.1966 | Debye |
| Point Group | C1 | |
| Job cpu time: 0 days 0 hours 21 minutes 32.0 seconds. | ||
Item               Value     Threshold  Converged?
 Maximum Force            0.000017     0.000450     YES
 RMS     Force            0.000007     0.000300     YES
 Maximum Displacement     0.001312     0.001800     YES
 RMS     Displacement     0.000519     0.001200     YES
 Predicted change in Energy=-2.593070D-08
 Optimization completed.
    -- Stationary point found.

====Frequency Analysis====

The low frequencies confirm the presence of a minimum.
<pre>
Low frequencies ---  -23.4703    0.0016    0.0032    0.0048    5.7285   26.1882
 Low frequencies ---  162.2176  197.3073  208.4647

sulhurcationfreq
File Name	sulphurcation_freq_real_lucy
File Type	.log
Calculation Type	FREQ
Calculation Method	RB3LYP
Basis Set	6-31G(d,p)
Charge	1
Spin	Singlet
E(RB3LYP)	-517.68327451	 a.u.
RMS Gradient Norm	0.00000872	 a.u.
Imaginary Freq	0
Dipole Moment	3.1966	 Debye
Point Group	C1
Job cpu time:  0 days  0 hours  4 minutes 38.1 seconds.
Comparison of Cation Structures
Charge Distribution Comparison
| cation | Visual charge summary | numerical charge summary |
| N(CH3)4)+ |  |

|
| P(CH3)4)+ |  |
|
| S(CH3)3+ |  |

|

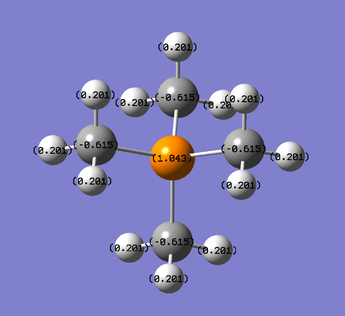
This representation of the charge distribution of N(CH3)4 shows the positive charge (green) is distributed around the methyl groups, with the central N atom bearing the positive charge. The H atoms bear all of the positive charge and the surrounding C atoms are more positively charged than the central N. The charge range pictured here is -1debye to 1debye. A tabulated representation of the partial charge distribution is shown below. The hydrogen atoms differ in partial charge which correlates with their different acidity in each cation.
| atom | charge(debye) |
| H | 0.18 |
| N | -0.196 |
| C | -0.396 |
| X | Partial charge on H |
| N | 0.182 |
| P | 0.201 |
| S | each C atom has two attached H with 0.217 debye and 1H with 0.201 debye |
Thus it can be said that the traditional picture of an NR4+ cation[4] (see below) is erroneous as the tetravalent Nitrogen centre is in fact electron deficient, whereas the Phosphorous atom is positively charged as would be imagined in the classical representation of an XR4,+ molecule. This discrepancy may suggest further bonding is present in the NR4+ cation, and further analysis, for examble witha higher nergy basis set, would be needed to determine the truth behind this charge distribution. 
Relative contribution of C and X to the C-X bond
The contribution depends on the electronegativity of X- since N is much more electronegative than P it makes a larger contribution towards the bond- according to MO theory in which the deeper in energy an atom is, the more it will contribute to the bonding orbital and the less to the anti-bonding orbital. The order of electronegativity is P<S<N, which is what is seen in the share of the 'bond electron density' in the table below.
Effects of Functional Groups
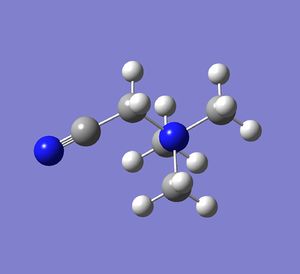
In order to determine what the effects of a change in functional group might be on the properties discussed, molecules of [N(CH3)3(CH2CN)]+ and [N(CH3)3(CH2OH)]+ were optimised and compared.
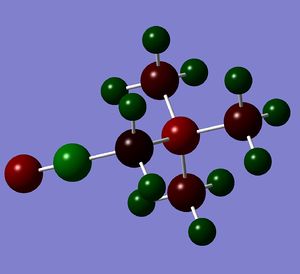
- [N(CH3)3(CH2OH)]+
- [N(CH3)3(CH2CN)]+
cyano ammonium opt + freq
File Name	cyanoamonium_opt_lucy
File Type	.log
Calculation Type	FREQ
Calculation Method	RB3LYP
Basis Set	6-31G(d,p)
Charge	1
Spin	Singlet
E(RB3LYP)	-306.39376383	 a.u.
RMS Gradient Norm	0.00000081	 a.u.
Imaginary Freq	0
Dipole Moment	5.7642	 Debye
Point Group	C1
Job cpu time:  0 days  0 hours 29 minutes 29.6 seconds.
Low frequencies ---   -2.6617   -0.0007   -0.0006    0.0007    7.1427    9.6736
 Low frequencies ---   91.7721  154.0280  210.9257
Comparison
| Cation | Contribution of C | Contribution of X |
| N(CH3)4)+ | 33% | 66% |
| P(CH3)4) | 63% | 37% |
| S(CH3)3+ | 47% | 53% |
This data showcases the contrast between C-N and OH as groups which can change the charge distribution and bond strengths in a molecule. The C-N bond is slightly weakened by both functional groups which are both electron-withdrawing, but C-N more so that O-H due to O- donating electron density into the system via resonance. The alpha C-O bond is very polarised accounting for its unusual charge in the second molecule.
Notes
- ↑ 1. J. Glaser GJ. On the structures of the hydrated thallium (III) ion and its bromide complexes in aqueous solution. Acta, Chem Scand. 1982;36:125-135. doi: http://actachemscand.dk/pdf/acta_vol_36a_p0125-0135.pdf.
- ↑ 2. D. Grant DD. Heats of formation and bond energies of the H(3-n)BXn compounds for (X ) F, cl, br, I,NH2, OH, and SH). J Phys Chem [bond lengths BHnXn]. 2009(113):777-787.
- ↑ 3. C.Paduini MW. Theoretical study of the stability and electronic structureof al(BH4)n=1f4 and al(BF4)n=1f4 and TheirHyperhalogen behavior. J Phys Chem. 2011;115:10257.
- ↑ Quaternary_ammonium_cation.svg, Wikipedia


