Rep:Mod:Kcl14
Introduction to molecular dynamics simulation
Velocity Verlet Algorithm
'Analytical' is given by .
'Energy' is given by the summation of the potential energy, , and kinetic energy, , for a harmonic oscillator.
'Error' is given by the absolute difference between the 'Analytical' value and Velocity-Verlet value.
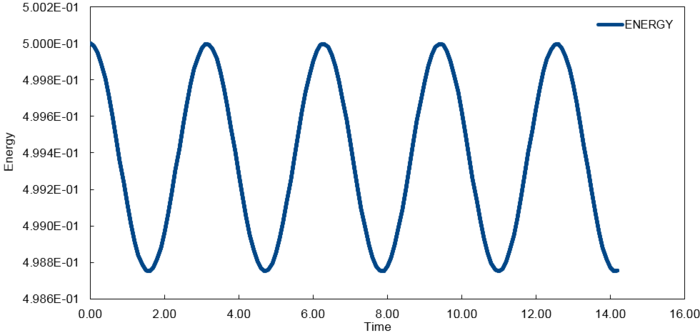

The value of obtained from a linear fit of the error maxima suggests a strong linear correlation.
The fluctuations in energy for timesteps, 0.1, 0.05 and 0.2, were then calculated as a percentage of the lowest value observed and plotted against time.
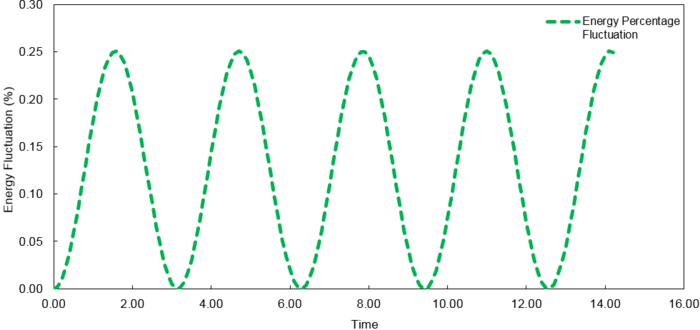
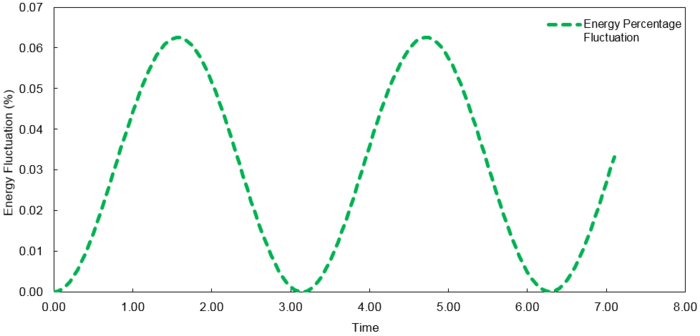
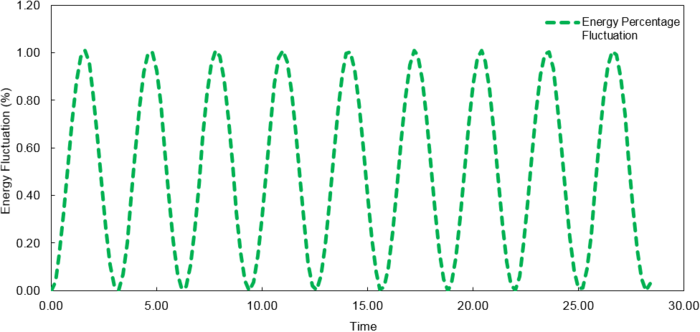
At time step = 0.2, the fluctuation in the energy values during the simulation does not exceed 1%. It is important to ensure the total energy fluctuations of a system are not significant enough to introduce large errors into the simulation of its thermodynamic properties.
Atomic Forces - Lennard Jones Potential
Potential energy is zero when ,
The force at can be obtained with the relationship where ,
Substituting ,
The equilibrium separation can be found by obtaining the minimum of the Lennard Jones Interaction where ,
The well depth is then calculated with a substitution of ,
For
Volume of Water Molecules
The number of water molecules can be calculated from the number of moles of water in 1 ml (assuming a density of 1 g per ml) multiplied by Avogadro's number.
The volume of water molecules can be calculated from the number of water molecules multiplied by the volume of one molecule which can be obtained from the previous calculation.
Cubic Simulation Box
After accounting for the periodic boundary conditions and since the box runs for one unit length in each direction, the particle reappears from the opposite side of the box at coordinates shown below.
Reduced Units
LJ cutoff in real units
Reduced Temperature
Well Depth
Equilibration
Simulation Box
Giving the atoms random initial coordinates gives rise to the possibility where the atoms are generated really close to each other. This can lead to large repulsive interactions that would not normally occur under realistic conditions.
And since there is 1 lattice point per unit cell,
For the face-centred cubic (FCC) lattice,
For a FCC lattice, since there are 1000 unit cells generated and there are 4 lattice points per unit cell, there will be 4000 lattice points in the box. This corresponds to 4000 atoms.
Setting the Properties of the Atoms [1]
"mass 1 1.0" sets the mass of all type "1" atoms to "1.0".
"pair_style lj/cut 3.0" sets the pairwise interactions between particles to follow a Lennard Jones Potential and ignore interactions above "3.0".
"pair_coeff * * 1.0 1.0" sets the coefficients of pairwise force field interactions between pairs of any type of atoms to "1.0". In this case, they would be and of the Lennard Jones Potential.
The specification of initial position and velocity allows the use of the velocity-verlet algorithm.
Running the Simulation
Generalising the input script with variables such as "n_steps" allows convenient altering of the input script. This is especially helpful when the same value is used multiple times within the script since the value only needs to be assigned to the text variable once.
Equilibration
Thermodynamic quantities of a simulated system (0.001 timestep) are plotted below to verify if they reach a constant average which indicates an equilibrium state.

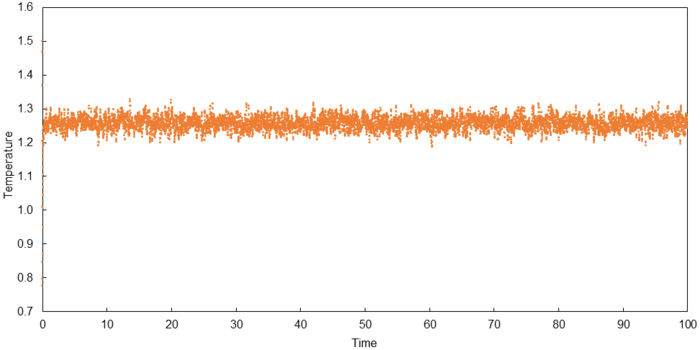
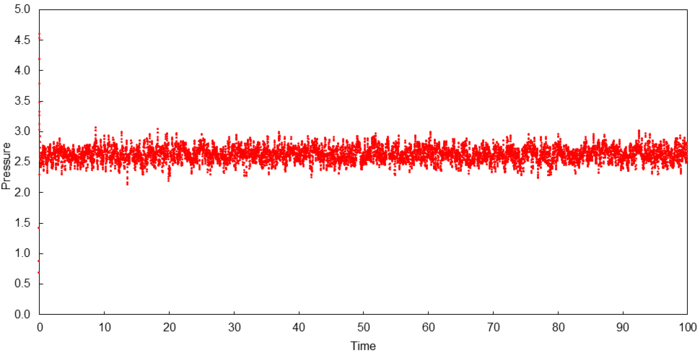
A constant average for all three thermodynamic quantities was obtained within the duration of simulation which indicates that equilibrium was obtained in all cases. The time required to attain equilibrium was approximately 0.30 for each thermodynamic quantity.

The largest timestep to give acceptable results is 0.0025 which converged to the same values for 0.001. Above 0.0025, the constant averages obtained were higher than that obtained for a timestep of 0.001.
A particularly bad choice would be to use a timestep of 0.015. In this particular simulation, equilibrium was not obtained.
Running simulations under specific conditions
Thermostats and Barostats
Examining the Input Script [1]
'100' refers to the number of timesteps between the sampling of each set of input values.
'1000' refers to the number of times each input value is sampled so that an average can be calculated.
'100000' refers to the number of timesteps between each time an average is calculated.
The amount of time simulated is the number of steps, '100000', multiplied by the size of each timestep. In this experiment, a timestep of was used. Thus, the simulations were long.
Plotting the Equations of State
The temperatures (T*) chosen are 2.0, 2.5, 3.0, 3.5 and 4.0 which are above the critical temperature to ensure liquification does not occur. The pressures (P*) chosen are 2.0 and 3.0. Using combinations of the two parameters, 10 simulations were run with a timestep of and the results are plotted below. A corresponding ideal gas law plot is drawn in orange for each pressure as well. The ideal gas law plot was obtained from taking into account Lennard-Jones reduced units of temperature and pressure where is the density.
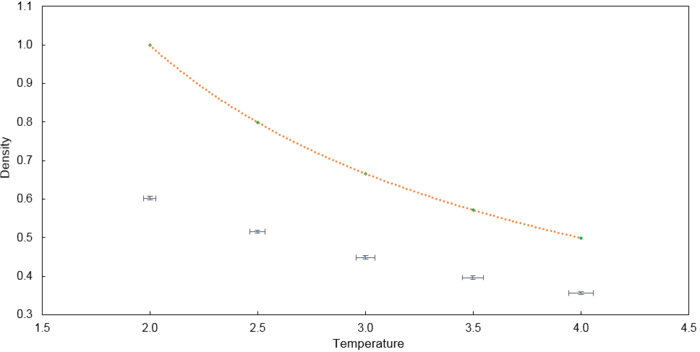
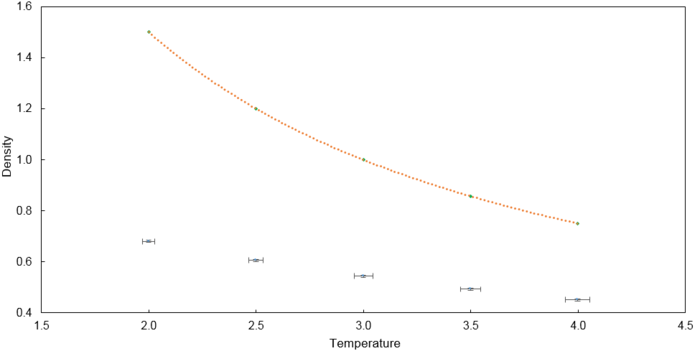
The simulated density is lower than that predicted by the ideal gas law. In the ideal gas law, particles do not interact and the volume occupied by particles is negligible compared to the volume of the container. In this simulation, there are repulsive interactions introduced by the use of the Lennard Jones potential. Hence, on average, the simulated particles are further apart from one another compared to a scenario with ideal particles.
This discrepancy between the simulated density and the ideal density increases with increasing pressure. At higher pressures, particles are closer to one another due to the reduced volume which leads to higher repulsive interactions. Thus, on average, the simulated particles are further apart from one another compared to a scenario with ideal particles.
Calculating heat capacities using statistical physics
Heat Capacity Calculation
Attached below is an example of an input script.
### SPECIFY THE REQUIRED THERMODYNAMIC STATE ###
variable T equal 2.0
variable d equal 0.8
variable timestep equal 0.002

### DEFINE SIMULATION BOX GEOMETRY ###
lattice sc ${d}
region box block 0 15 0 15 0 15
create_box 1 box
create_atoms 1 box

### DEFINE PHYSICAL PROPERTIES OF ATOMS ###
mass 1 1.0
pair_style lj/cut/opt 3.0
pair_coeff 1 1 1.0 1.0
neighbor 2.0 bin

### ASSIGN ATOMIC VELOCITIES ###
velocity all create ${T} 12345 dist gaussian rot yes mom yes

### SPECIFY ENSEMBLE ###
timestep ${timestep}
fix nve all nve

### THERMODYNAMIC OUTPUT CONTROL ###
thermo_style custom time etotal temp press
thermo 10

### RECORD TRAJECTORY ###
dump traj all custom 1000 output-1 id x y z

### SPECIFY TIMESTEP ###

### RUN SIMULATION TO MELT CRYSTAL ###
run 10000
unfix nve
reset_timestep 0

### BRING SYSTEM TO REQUIRED STATE ###
variable tdamp equal ${timestep}*100
fix nvt all nvt temp ${T} ${T} ${tdamp}
run 10000
reset_timestep 0

### SWITCHING OFF THERMOSTAT ###
unfix nvt
fix nve all nve

### MEASURE SYSTEM STATE ###
thermo_style custom step etotal temp press density atoms vol
variable atoms equal atoms
variable dens equal density
variable temp equal temp
variable temp2 equal temp*temp
variable etotal equal etotal
variable etotal2 equal etotal*etotal
variable vol equal vol
variable press equal press
fix aves all ave/time 100 1000 100000 v_dens v_temp v_press v_etotal2 v_etotal v_temp2
run 100000

variable avedens equal f_aves[1]
variable avetemp equal f_aves[2]
variable avepress equal f_aves[3]
variable aveetotal2 equal f_aves[4]
variable aveetotal equal f_aves[5]
variable hcapacity equal ${atoms}*${atoms}*((f_aves[4]-f_aves[5]*f_aves[5])/(f_aves[6]))

print "Averages"
print "--------"
print "Number of Atoms: ${atoms}"
print "Heatcapacity: ${hcapacity}"
print "Volume: ${vol}"
print "Density: ${avedens}"
print "Energy: ${aveetotal}"
print "Energy2: ${aveetotal2}"
print "Temperature: ${avetemp}"
print "Pressure: ${avepress}"
Simulations were then conducted at of 2.0, 2.2, 2.4, 2.6, 2.8 with values of 0.2 and 0.8. Thus, was plotted as a function of and the plots are shown below.
Heat capacity was calculated using the relationship where .
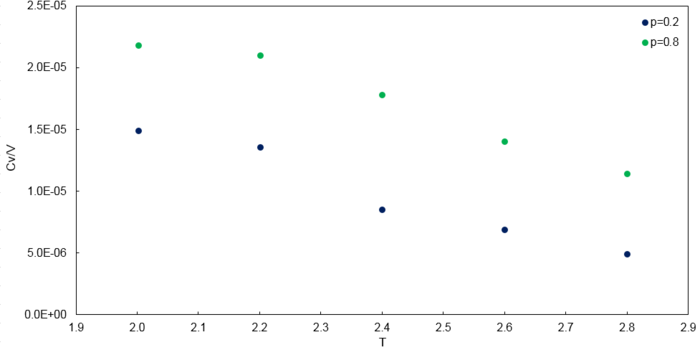
The trends observed are as expected. Firstly, values of decreased with increasing temperature. This is because at higher temperatures, it will be easier to access higher energy levels (vibrational) and thus less energy is required to access the higher energy levels. As a result, heat capacity decreases since heat capacity is the amount of heat energy required to raise the temperature of a system by one degree.
Secondly, values of increased with higher density. At higher density, there is a greater number of atoms per unit volume which means that heat capacity should be higher since there are more energy levels that can be occupied to store energy in a given volume. As a result, increased. However, since heat capacity is an extensive property, would suggest a four times increase in the value compared to at . This is not the case in this simulation, possibly due to errors from the relatively small size of the simulated system.
Structural properties and the radial distribution function
The phases were simulated using the specified temperatures and densities as shown below.
| Phase | Temperature | Density |
|---|---|---|
| Vapour | 1.0 | 0.1 |
| Liquid | 1.0 | 0.8 |
| Solid | 1.0 | 1.3 |
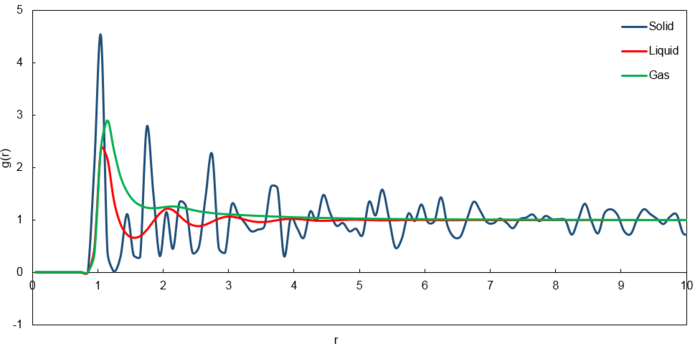
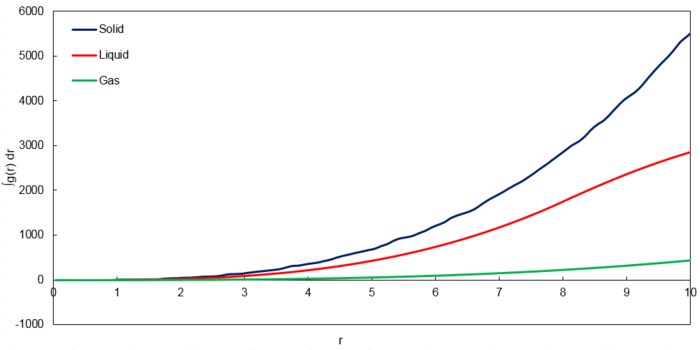
The RDF for the solid phase reveals 3 sharp peaks which correspond to the first 3 nearest neighbours on the FCC lattice used to simulate the solid phase. This indicates that the structure of the solid phase is rigid where the atoms vibrate about fixed positions and long range order. The fluctuations correspond to the defects in the solid and further lattice points.
The RDF for the liquid phase reveals 1 sharp peak followed by 2 broader peaks before quickly attaining a constant value of 1. This indicates a lack of long range order but a presence of short range order where nearby atoms can interact and order themselves.
The RDF for the vapour phase reveals 1 sharp peak and quickly attaining a constant value of 1. This indicates an even more pronounced lack of long range order compared to the liquid phase with entirely no short range order. Thus, the vapour phase is the most disordered phase.

Using the red point as the reference lattice point, the green points are the nearest neighbours, followed by the blue points then the yellow points. The lattice spacing should correspond to the distance to the second nearest neighbours (blue points) which is 1.45 obtained from the second peak in the graph of for the solid simulation.
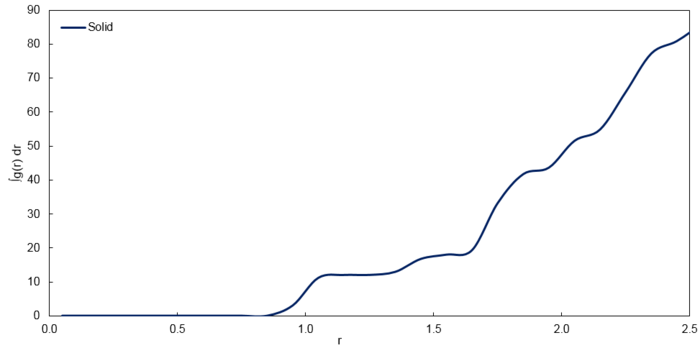
With these points as the 3 nearest neighbours, there are 12, 6 and 24 atoms in increasingly further layers respectively. Furthermore, since coordination number is defined as the number of nearest neighbours, the corresponding coordination numbers for the 3 peaks are 12, 6 and 24 respectively which corresponds to the graph of against for the solid phase as shown below. It is to note that the integrals correspond to the number of atoms.
| r | Running Integral | Coordination Number |
|---|---|---|
| 1.25 | 12.0156 | 12 |
| 1.55 | 17.9772 | 6 |
| 1.85 | 41.6666 | 24 |
Dynamical properties and the diffusion coefficient
The Lennard Jones simulations[2] for a vapour, liquid[3], and solid phase were run using the specified densities and temperatures as shown below.
| Phase | Temperature | Density |
|---|---|---|
| Gas | 1.0 | 0.1 |
| Liquid | 1.0 | 0.8 |
| Solid | 1.0 | 1.3 |
Mean Squared Displacement
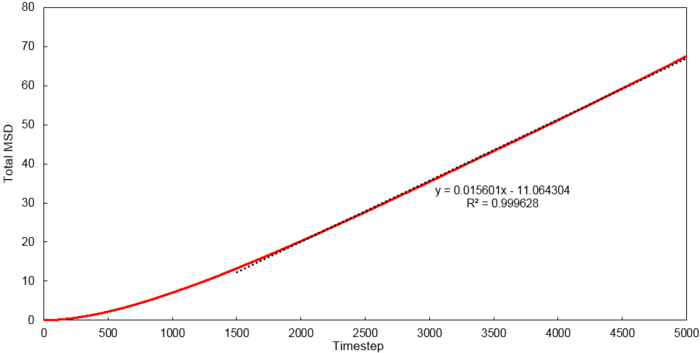
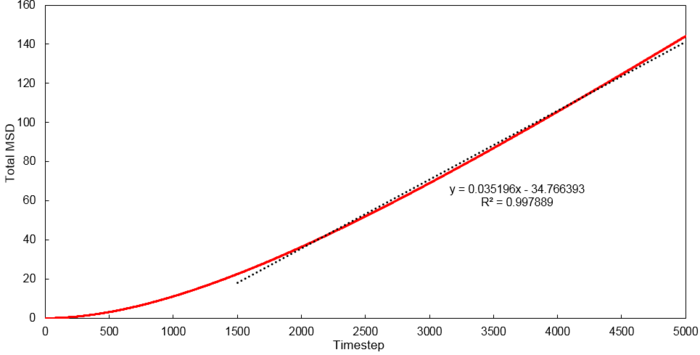
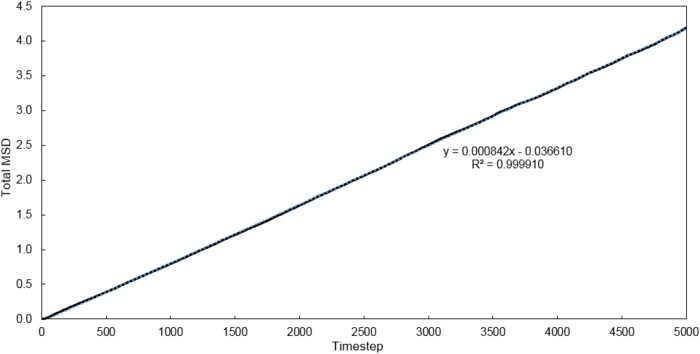
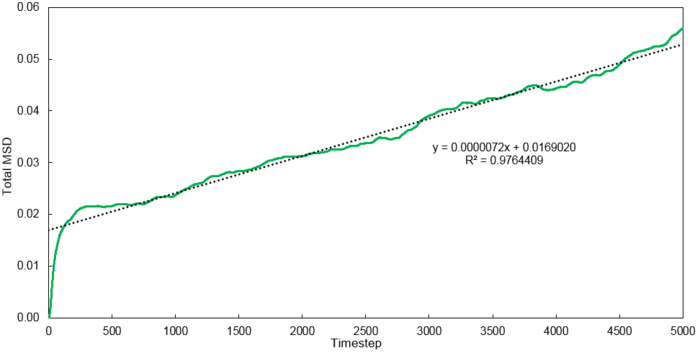
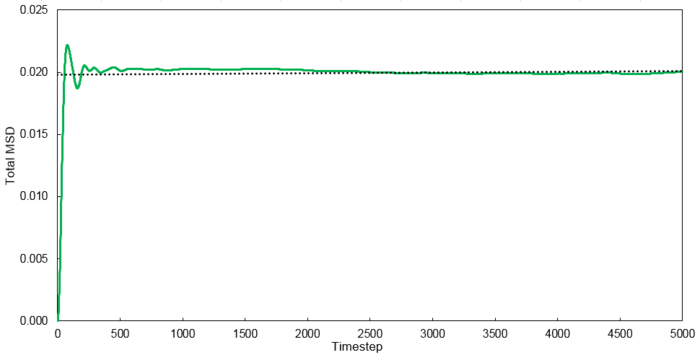
Using the relationship where , D values were calculated for each system simulated.
| Phase | 8 thousand atoms | 1 million atoms |
|---|---|---|
| Vapour | 1.3001 | 2.9332 |
| Liquid | 0.0702 | 0.0875 |
| Solid | 0.0006 | 0 |
Velocity Autocorrelation Function
The normalised velocity autocorrelation function for a 1D harmonic oscillator[4] is evaluated and shown below,
Then substituting,
,
and
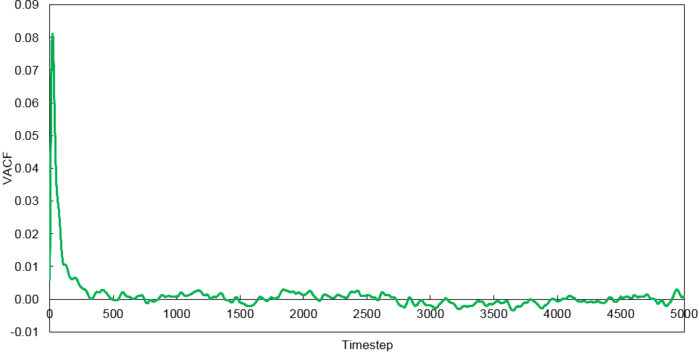
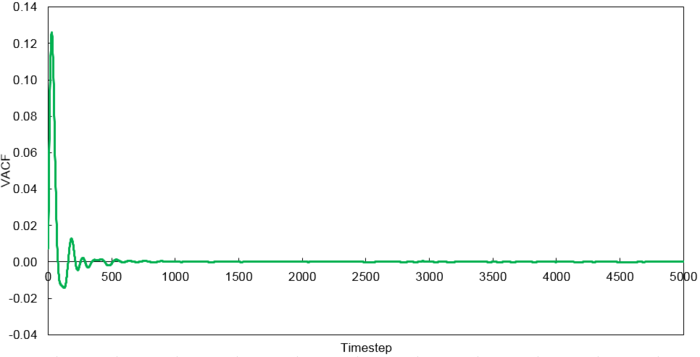
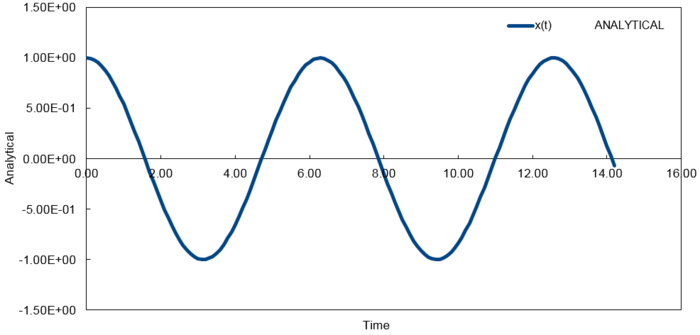
The VACFs from the liquid and solid simulation as well as the analytic solution are plotted below.
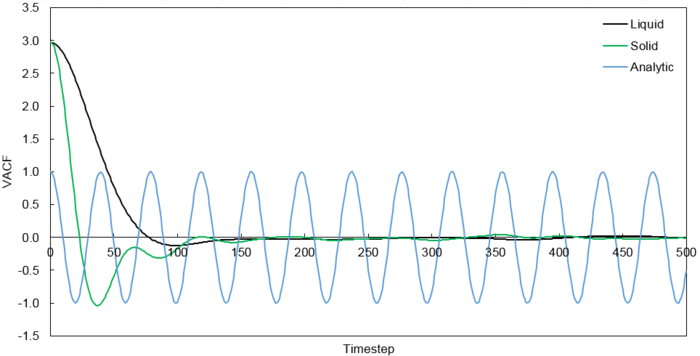
The minimum of the VACFs represent a reversal in the velocity of the particle. The liquid and solid VACF both taper down due to the decorrelation of the velocity with time. However, it is to note that the solid phase decorrelates slower than the liquid phase. In the solid phase, the atoms vibrate about a fixed point and a perfect oscillation would be obtained in an ideal scenario. However, there are other perturbative forces which disrupt this oscillatory motion resulting in a damped harmonic motion leading to a gradual decay. On the contrary in the liquid phase, the atoms do not vibrate about a fixed point. However, there are diffusive forces which disrupt any oscillatory motion even more rapidly than the perturbative forces in the solid phase. Thus, it can be observed that a very damped oscillation occurs which quickly decays. This can be thought of as two atoms colliding with one another and then quickly diffusing away.
It is noted that the harmonic oscillator VACF is very different to the Lennard Jones solid and liquid as described above. This is due to the harmonic oscillator VACF not taking into account any disruptive forces that can destroy the oscillatory motion. As a result, perfect oscillation can be observed where the initial velocity correlates to every subsequent velocity.
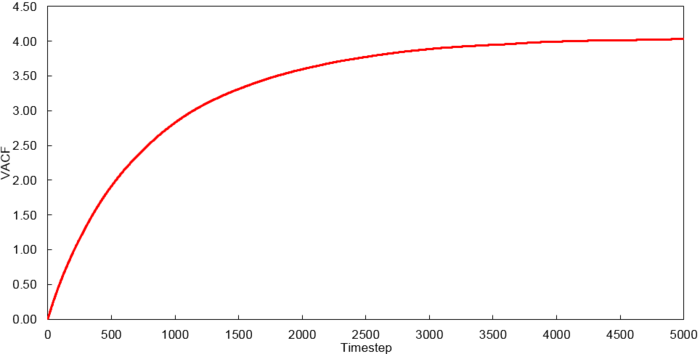
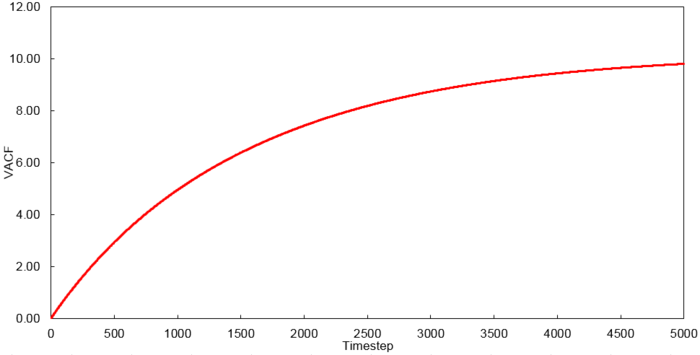
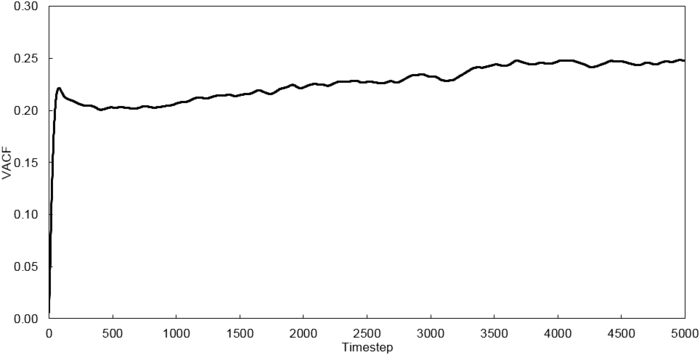
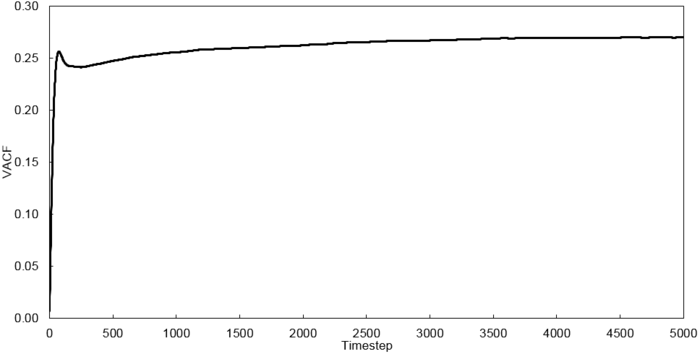
The running integrals for each simulated system were calculated using the trapezium rule and are shown below.
Using the relationship where , D values were calculated for each system simulated. The VACF values at 5000 timesteps were used.
| Phase | 8 thousand atoms | 1 million atoms |
|---|---|---|
| Vapour | 1.34409 | 3.26851 |
| Liquid | 0.08258 | 0.09009 |
| Solid | 0 | 0 |
The values obtained through VACF are similar to that obtained through MSD. It is to note that the values increase from the solid to the liquid to the vapour phase for both methods which is an expected result. The values for the solid are approximately zero which is expected since the atoms are vibrating about a fixed point. However, the values obtained for the vapour phase are significantly different for the small system and the larger system. This error is attributed to an inaccurate simulation due to the small number of atoms used in the smaller system. It is expected that the real value of is closer to that of the value obtained from the 1 million atoms system for both the MSD and VACF simulation. The largest source of error is the length of time the simulations are run for. It is clear from the simulations above that the VACF values are still increasing for the liquid and vapour phases. This indicates that the actual values are higher than that of the simulated values.
References
- ↑ 1.0 1.1 LAMMPS Manual, http://lammps.sandia.gov/doc/Section_commands.html#individual-commands. Accessed on 12 March 2017.
- ↑ J. Hansen and L. Verlet, Phase Transitions of the Lennard-Jones System, Phys. Rev., 1969, 184, 151.
- ↑ D. Chandler, Equilibrium Structure and Molecular Motion in Liquids, Acc. Chem. Res., 1974, 7, 246.
- ↑ D. Levesque and L. Verlet, Computer "Experiments" on Classical Fluids. III. Time-Dependent Self-Correlation Functions, Phys. Rev. A, 1970, 2, 2514.

