Rep:Mod:Ka'kari
Module 3
Owen Davis
Introduction and Aims
In chemical reactions, transition states occur. These correspond to an energy maximum on a reaction coordinate. The energy of this transition state determines the activation energy of a reaction and will determine if a reaction will occur. Unfortunately, as transition states are unstable, they are not usually observed in experimental time scales. Therefore, it is for computational chemists to model these reactions and determine the structure and relative energy of transition states.
However, as most molecules in chemical reactions are quite large, the very simple molecular mechanics / force field methods used in previous modules are not accurate enough to determine the structure of these transition structures. Therefore, a new method must be adopted. Using molecular orbital-based methods, which numerically solve the Schrödinger equation, the transition structure can be located based on the local shape of the reactions' potential energy surface. Not only does this allow the structure of the transition state to be calculated, but also reaction paths and activation energies can be calculated.
In this module, transition structures of various chemical reactions (the Cope rearrangement and Diels Alder cycloaddition) involving relatively large molecules will be modelled. These structures will then be analysed to determine a variety of properties of the reaction. For example, which transition state corresponds to the kinetic pathway and why a certain transition structure is stabilised over another.
The Cope Rearrangement
Introduction
The Cope rearrangement is a reaction involving the [3,3]-sigmatropic rearrangement of 1,5-dienes[1]. Figure 1 shows the Cope rearrangement of 1,5-hexadiene.
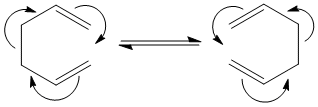
Although the Cope rearrangement is concerted and pericyclic, it is generally accepted that it follows an allowed concerted route through a homoaromatic transition state[2]. The Cope rearrangement can occur via either a "chair" or a "boat" conformation.
In this exercise, both of these transition structures will be calculated and the relative energies of both structures determined in order to show whether this reaction occurs via a "chair" or "boat" conformation.
Geometry Optimisation of the Reactants and Products
1,5-hexadiene was drawn using GaussView. This molecule had an approximate antiperiplanar conformation for the central 4 carbon atoms. This was done by modifying the dihedral angle of these bonds to be 180°. Before optimisation, the Clean function in GaussView was used to clean the structure of the molecule. The molecule was then optimised using the Hartree-Fock method with the low level 3-21G basis set. This optimisation yielded the ‘anti2’ conformation (as described in Appendix 1) which can be seen in Table 1 along with a summary of its key data. It was shown that this molecule has Ci symmetry.
The above optimisation was repeated for another molecule of 1,5-hexadiene. However, this time, the central 4 carbon atoms had an approximate gauche conformation, with a dihedral angle of 60°. This yielded the ‘gauche6’ conformation which can also be seen in Table 1 along with its key data. This molecule had C1 symmetry.
| Conformer | ||
|---|---|---|
| Point Group | Ci | C1 |
| Data | 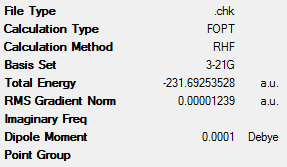 |
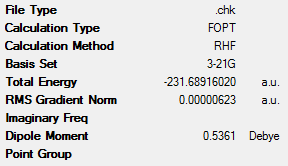 |
From this data it can be clearly seen that the ‘anti2’ conformation has lower energy than the ‘gauche6’ conformer (the difference being 8.86kJmol-1). This is expected, as the gauche conformations would have larger steric clashes and therefore be higher in energy. These steric interactions are seen between the vinyl protons, which are in close proximity to one another[3].
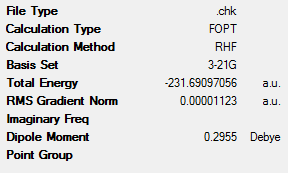
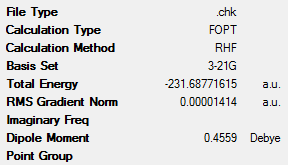
In order to get varying antiperiplanar and gauche conformations with different symmetries and therefore different energies, the initial structures were altered and optimised as before. These new structures are shown in Table 2, along with their key data. These structures and point groups were identified by using Appendix 1.
| Conformer | ||||
|---|---|---|---|---|
| Point Group | C2h | C1 | C2 | C1 |
| Data | 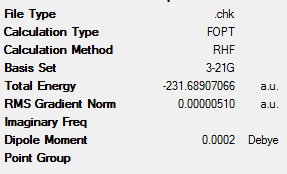 |
 |
 |
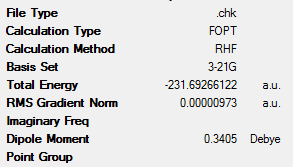 |
It can be seen that, in the majority of case, the antiperiplanar conformations are lower in energy than the gauche conformations. However, this is not the case with the ‘gauche3’ conformation. This has a lower energy than the most stable antiperiplanar conformation (‘anti2’). This energy difference is 0.33 kJmol-1. This implies that other factors apart from steric interactions determine the energy of the various conformers. One of these factors would be the interaction between the C=C π-orbital and the C-C σ* orbital. This favourable interaction would lead to the stabilisation of the conformer[3]. However, due to the fact that the conformers have very similar energies, it can be concluded that the 10 main conformers of 1,5-hexadiene are degenerate[3].
Due to the fact that the ‘anti2’ was initially found, it was not redrawn. It can be clearly seen that the structure is that of ‘anti2’ as it has the same energy as described in Appendix 1.
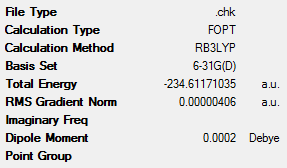
This ‘anti2’ conformation was optimised again. However, this time, the B3LYP method was used as this allows the electronic structure of many-electron systems to be determined. The more advanced and accurate 6-31G(d) basis set was also used. This gives far better approximations of the geometry of the various conformers and, as a result, of their energy. The data from this optimisation can be seen in Table 3 below. Unfortunately, the energy of the molecule cannot be compared with those seen in the tables above as different methods were used. However, geometrical parameters can be compared and are shown in Table 4.
|
 |
| Bond Length / Å | |||
| HF/3-21G | B3LYP/6-31G(d) | Literature[4] | |
|---|---|---|---|
|
C=C |
1.32 | 1.33 | 1.34 |
|
=C-C |
1.51 | 1.50 | 1.51 |
|
C-C |
1.55 | 1.55 | 1.54 |
| Central Dihedral Angle / ° | |||
| HF/3-21G | B3LYP/6-31G(d) | Literature[3] | |
| 180 | 180 | 180 | |
Table 4 shows various geometrical parameters for the two optimised structures. It can be seen that, for the B3LYP/6-31G(d) optimised structure, the dihedral angle for the central 4 carbon atoms is very close to 180°, which is in good agreement with literature values[3]. The bond distances are also very similar to the literature values[4] which are also in Table 4. Due to the fact that these results are closer to the literature values compared with the HF/3-21G optimised structure. Therefore, it can be said that the B3LYP/6-31G(d) level of computational analysis is accurate when modelling many-electron systems.
Frequency Analysis
This fully optimised structure of the ‘anti2’ conformer of 1,5-hexadiene was used to carry out the frequency analysis. This allowed us to confirm that the optimised structure obtained was indeed the most stable structure, i.e. has the lowest energy. This involves a calculation which computes the second derivative, which gives the curvature of the potential energy surface (which represent the frequencies of the molecule). If all the second derivatives (frequencies) are positive, it is an energy minimum. However, if one of the frequencies is negative, it implies that the geometry found is that for a transition state. Finally, if all the second derivatives are negative, it is an energy maximum. This means that a critical point was not found and the optimisation calculation most likely failed. In this scenario, more optimisation calculations would have to be conducted.
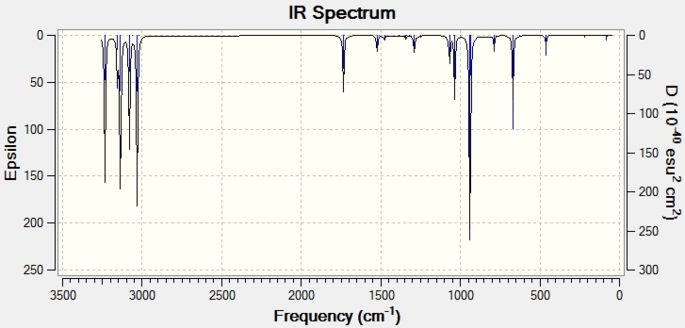
From the B3LYP/6-31G(d) optimised structure, the frequency analysis was run, ensuring that the same level of theory was used. This yielded no negative frequencies. This shows that the geometry calculated was indeed an energy minimum and not a transition state. The calculated infra-red spectrum can be seen in Figure 2 and matches well to the literature[5]:
This frequency analysis also allowed for various thermochemical properties to be calculated which were:
- the sum of the electronic and zero-point energies - This is the potential energy of the molecule at 0 K including the contribution from the vibrational zero-point energy.
- the sum of electronic and thermal energies - This is the energy of the molecule at room temperature and pressure (298.15 K and 1 atm), and includes contributions from translantional, rotational and vibrational energy modes.
- the sum of electronic and thermal enthalpies - This includes an additional correction for the thermal energy. This is vital when looking at dissociation reactions.
- the sum of electronic and thermal free energies - This includes the entropic contribution to the free energy.
The frequency analysis was automatically run at 298.15 K, but this was re-calculated for 0 K. This was done by using the additional keyword “Freq=ReadIsotopes” and manually editing the Gaussian Input file before the calculation was run. However, inputting a value of 0.0 K was read by Gaussian to be the default value (298.15 K). Therefore, in order to calculate the thermochemical data at 0 K, the input temperature was 0.0001 K. The results of both calculations can be seen in Table 5.
| Thermochemical Data / Eh | ||
| 298.15 K | 0 K | |
| Sum of the Electronic and Zero-Point Energies |
-234.469203 | -234.468766 |
| Sum of Electronic and Thermal Energies |
-234.461857 | -234.468766 |
| Sum of Electronic and Thermal Enthalpies |
-234.460913 | -234.468766 |
| Sum of Electronic and Thermal Free Energies |
-234.500776 | -234.468766 |
It can be seen from the data that the energies at 0 K correspond to only the electronic and zero point energies. This is because the thermal contributions at 0 K are zero. It can also be seen that the sum of the electronic and thermal free energies is more negative at 298.15 K. This shows that, at higher temperatures, the ‘anti2’ conformer is slightly more stable.
Optimisation of the “Chair” and “Boat” Transition Structures
Introduction
There are two possible conformations for the transition state for the Cope rearrangement of 1,5-hexadiene. These are the chair conformer, which has C2h symmetry and the boat conformer which has C2v symmetry. Both of these can be seen in Figure 3.

This part of the course looks at these different conformations and will determine which is most stable and therefore more likely to be the structure of the transition state.
“Chair” Optimisation
In order to determine the transition states, allyl fragments (CH2CHCH2) were drawn in GaussView and optimised using the low level HF/3-21G method and basis set. This fragment, as well as a copy of the fragment, was used to create a rough chair-like transition state, which can be seen in Appendix 2. The distance between the two carbon atoms where the new bonds would be formed was adjusted so that it would be approximately 2.2 Å. This transition state structure was optimised using two different methods, the TS (Berny) method, and the Freeze Coordinate Method.
TS (Berny) Method
This method involved making an initial reasonable guess for the transition structure geometry. This is usually done by computing the force constant matrix (Hessian) in the first step of the optimization which would then be updated as the optimization proceeded. This transition state structure geometry was optimised using the HF/3-21G method and basis set and the ‘Opt+Freq’ option, and selecting ‘Optimisation to a TS (Berny)’, with only one force constant being calculated and the additional keyword “Opt=NoEigen”. This keyword stops the calculations from crashing if more than one imaginary frequency is detected during the optimisation process. This happens fairly often when the initial guess for the transition structure geometry is reasonable poor. This optimisation yielded the transition structure that is seen in Table 6, with a single imaginary frequency at -818 cm-1. This shows that the structure calculated was indeed a transition state. The imaginary frequency, which shows the bond forming process, is also animated in Table 6. This imaginary frequency also shows that the bond breaking and forming process is a concerted process as both occur simultaneously, which is expected for the Cope rearrangement[1].
| Optimised Structure |
| |||
|---|---|---|---|---|
| Energy / Eh | -231.6193 | |||
| Bond Length / Å | 2.02 | |||
| Imaginary Frequency / cm-1 |
|
Freeze Coordinate Method
This method usually produces far better transition structures. This is done by freezing the reaction coordinate, while optimising the rest of the molecule. After this optimisation, the reaction coordinate is unfrozen and the transition state optimisation is calculated, as for the TS (Berny) method. This can save a lot of computational time due to the fact that the the whole Hessian might not need to be computed and differentiating along the reaction coordinate might give a good enough estimate for the initial Hessian.
For this method, the interatomic distance between both termini of the allyl fragments was set to 2.2 Å using the Reducdant Coord Editor in GaussView. Once the initial optimisation (HF/3-21G) was completed, the interatomic distances were unfrozen and the optimisation to a TS (Berny) was initiated. This method yielded the transition structure as seen in Table 7, with the same single imaginary frequency at -818 cm-1.
| Optimised Structure |
| |||
|---|---|---|---|---|
| Energy / Eh | -231.6193 | |||
| Bond Length / Å | 2.02 | |||
| Imaginary Frequency / cm-1 |
|
Comparing both methods, it can be seen that both yielded the same chair-like transition structure, with the terminal C-C bond lengths being 2.02 Å for both methods. The only difference that can be seen is that the energy of the transition structures are slightly different for the different methods, with the freeze coordinate method being negligibly lower in energy (with the difference in the energy is only seen in the 8th decimal place). The above analysis shows that the transition structures calculated using the different methods yielded identical results.
“Boat” Optimisation
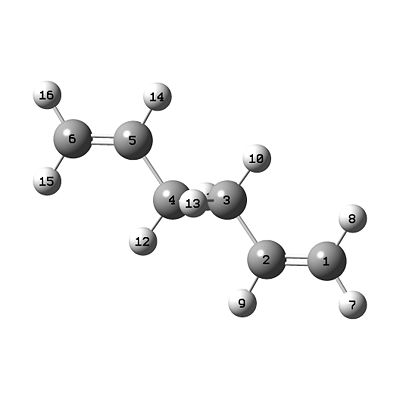
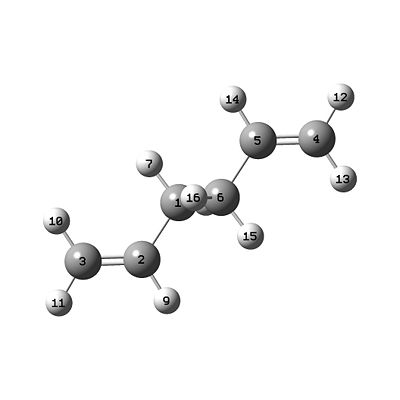
In order to determine the boat-like transition structure, the QST2 method had to be invoked. This method allows the reactant and product molecules to be specified and the calculation interpolates between the two structures to determine the transition state between them. This requires the atoms in both the reactants and products to be numbered exactly the same. Unfortunately this had to be done manually. The B3LYP/6-31G(d) optimised structure of the ‘anti2’conformer was copied into a new window, and the atom numbers of the product molecule edited so that they corresponded to those of the reactant molecule. The result of this editing can be seen in Figure 4.
 |
 |
| Figure 4: Amended "anti2" Conformers | |
Using the HF/3-21G method and basis set, a combined optimisation and frequency analysis was run on these structures using the TS (QST2) calculation. It was found that the calculation failed. This was due to the fact, that, when the calculation was running, it simply translated the top allyl fragment and did not consider rotation around the central bonds as a possibility to optimise the transition structure.
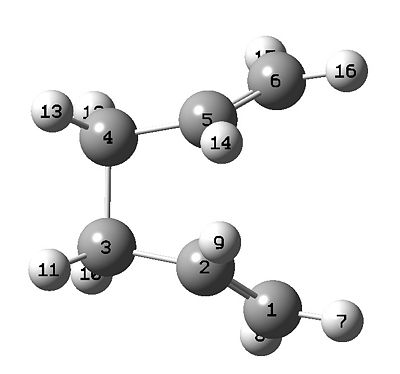
As a result of this failure, the initial reactant and product structures had to be geometrically adjusted to that they resembled the boat transition structure. This was done by changing the central dihedral angle to 0° and both inside C-C-C bond angles to 100°. This was repeated for the product molecule as well. The result of this adjustment can be seen in Figure 5.
 |
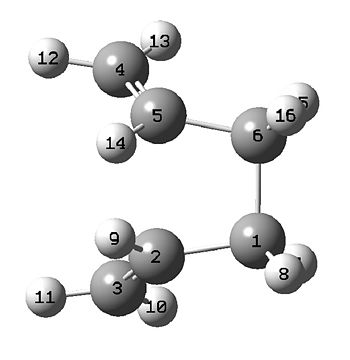 |
| Figure 5: Geometrically Amended "anti2" Conformers | |
The above optimisation was repeated and the calculation reached completion. The results of this calculation can be seen in Table 8.
| Optimised Structure |
| |||
|---|---|---|---|---|
| Energy / Eh | -231.6028 | |||
| Bond Length / Å | 2.14 | |||
| Imaginary Frequency / cm-1 |
|
As it can be seen from the .jmol file, the bonds between the two allyl fragments have been drawn in by Gaussian. This means that the distance between the allyl fragements is shorter than the distance criteria that GaussView implements. Once again, only one imaginary frequency has been calculated. This shows that the structure obtained is that of a transition state. It can be seen that the imaginary frequency for the boat-like transition state is more negative. However, the animated imaginary frequency still shows that the reaction occurs in a concerted manner. The main difference between the “chair” and “boat” transition structures is that the bond lengths in the “boat” transition structure is slightly longer (0.12 Å). This implies that the new bonds being formed will be slightly weaker for the “boat” transition structure and therefore implies that the “boat” transition structure will be less stable. This is indeed the case, as these calculations show that the “chair” transition structure is slightly more negative in energy and therefore more stable.
The two main downsides to this QST2 method are that it is extremely tedious to prepare the reactant and product for the optimisation and that the optimisation will probably fail if these molecules are not close to the transition structure.
Intrinsic Reaction Coordinate (IRC) Method
It can be seen that it is almost impossible to determine which of the 10 main conformers will be formed from these transition states. However, the intrinsic reaction coordinate method allows the minimum energy path from a transition state structure to its local minimum on a potential energy surface to be followed. This is achieved by creating a series of points by taking small geometry steps in the direction in which the gradient of the potential energy surface is the steepest.
“Chair” Transition Structure
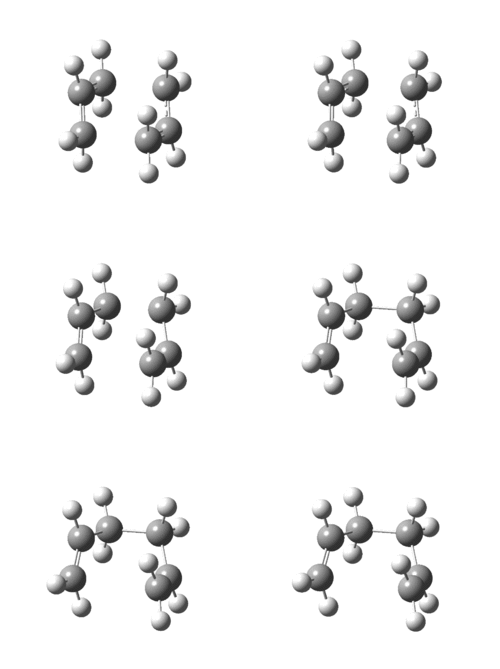
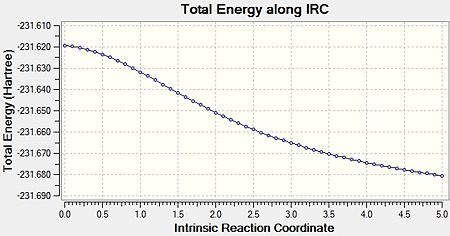
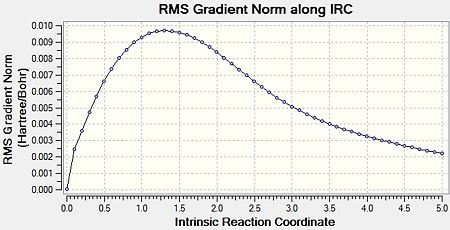
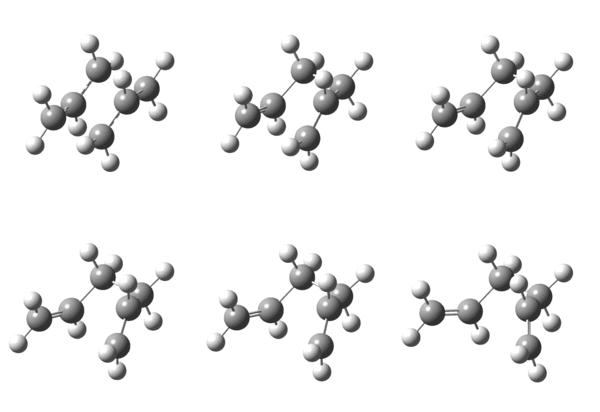
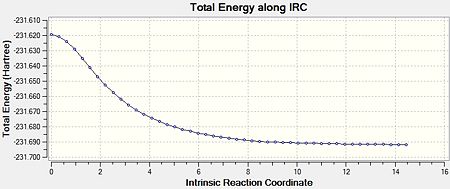
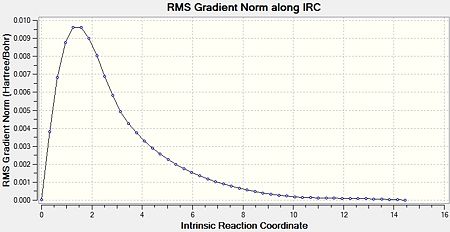
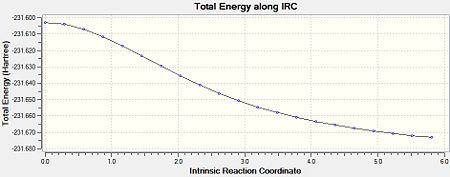
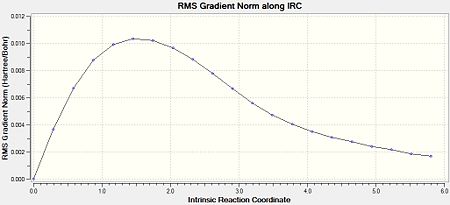
The IRC calculation was run for the optimised “chair” transition structure. Due to the fact that reaction coordinate is symmetrical (as the molecules are symmetrical), the IRC was only calculated in the forward direction, and only calculating the force constants once. Finally, the number of points along the IRC was adjusted to 50. Figure 6 shows an animated version of the IRC calculation. Figures 7a and 7b show the graphical representation of the Gaussian program travelling along the potential energy surface and finding the minimum energy structure, as well as the RMS gradient respectively. Finally, the final structure from this IRC calculation can be seen in Figure 8.
 |
 |
 |
| Figure 8: IRC Optimised Final Structure | |||
|
This calculation showed that the final structure obtained did not reach an energy minimum. This is due to the fact that the final structure does not correspond to any of the conformers shown in Appendix 1. Therefore, a further IRC calculation must be carried out, and there were three options:
- Carry out an energy minimisation on the final structure calculated by the IRC method
- Repeat the IRC calculation with a larger number of points to ensure it reaches a minimum
- Repeat the IRC calculation with the force constants calculated at every step.
The third option was undertaken as it is the most reliable method despite being the most expensive (in terms of both time and cost). However, due to the system being very small, the expense would be relatively small. The results of this calculation can be seen in Figures 9-11.
 |
 |
 |
| Figure 11: Advanced IRC Optimised Final Structure | |||
|
It can be clearly seen that, from this IRC method, the ‘gauche2’ conformer was formed. This is due to the fact that its energy corresponds to that seen in Appendix 1. The difference between these values is 0.055 kJmol-1. This shows that the IRC method can reliably calculate the resulting product from a transition state, as the energy of the final structure matches well to that in Appendix 1.
“Boat” Transition Structure
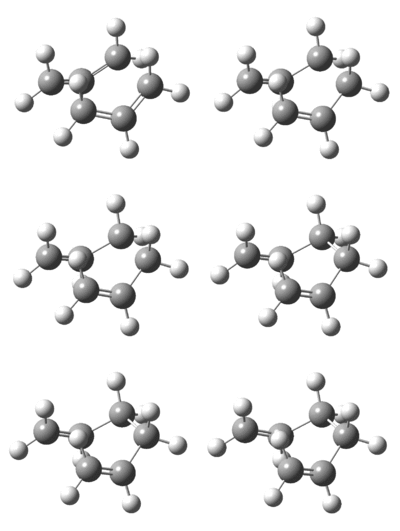
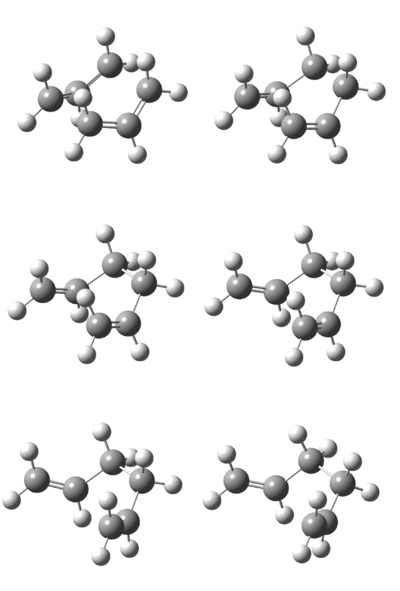
The above was also calculated for the optimised “boat” transition structure using the same method. Initally, the force constants were only calculated once. This yielded an incomplete minimisation from the “boat” transition structure which can be seen in Figures 12-14.
 |
 |
 |
| Figure 14: Advanced IRC Optimised Final Structure | |||
|
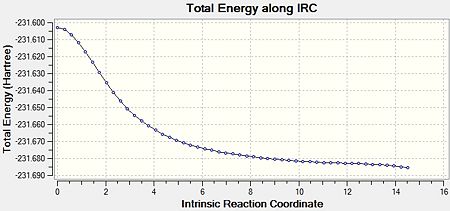
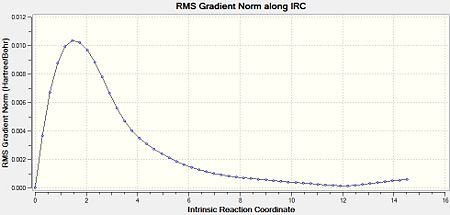
As a result of this incomplete minimisation, the IRC calculation was repeated with the force constants calculated at each step. This yielded the results seen in Figures 15-17.
 |
 |
 |
| Figure 17: Advanced IRC Optimised Final Structure | |||
|
It can be seen that the ‘gauche1’ conformer was formed during this IRC calculation. This is due to the fact that the structure, as well as the energy, corresponds to that seen in Appendix 1. However, the difference in energy is quite large, being 7.44 kJmol-1. This implies that the IRC method did not reach an energy minimum and therefore the final structure obtained is not that of the minimum energy structure. To confirm this another IRC calculation could be run, but this time with a larger number of points as well as calculating the force constants at every step.
Calculated Activation Energies
In order to determine the activation energies of the reaction for both of the transition structures, the transition structures had to be re-optimised. This was done by starting at the HF/3-21G optimised transition states, and optimising each of these structures using the more accurate B3LYP/6-31G(d) method and basis set. These optimised structures can be seen in Table 9 as well as the energy of their HF/3-21G optimised counterparts.
| "Chair" | "Boat" | |||||||||||||||
|---|---|---|---|---|---|---|---|---|---|---|---|---|---|---|---|---|
| HF/3-21G | B3LYP/6-31G(d) | HF/3-21G | B3LYP/6-31G(d) | |||||||||||||
| Optimised Structure |
|
|
|
| ||||||||||||
| Energy / Eh | -231.6193 Eh | -234.5570 Eh | -231.6028 Eh | -234.5413 Eh | ||||||||||||
| Imaginary Frequency / cm-1 |
-818 |
-840 | ||||||||||||||
This table clearly shows that the energy of the transition structures is much lower for the B3LYP/6-31G(d) calculated structures. This shows that the B3LYP/6-31G(d) method and basis set is more accurate and reliable as it gives more stable transition states. Interestingly, the data also shows that the imaginary frequencies calculated by the B3LYP/6-31G(d) method and basis set are very different from those calculated by the HF/3-21G method and basis set. This difference could possibly be due to the fact that the second derivative is significantly changing when using the different method and basis set and, as a result, the imaginary frequency corresponding to this second derivative significantly changes as well.
| B3LYP/6-31G(d) (0 K) |
Expt (0 K) | |
|---|---|---|
| ΔE ("Chair") / kcalmol-1 |
35.9 | 33.5 ± 0.5 |
| ΔE ("Boat") / kcalmol-1 |
43.1 | 44.7 ± 2.0 |
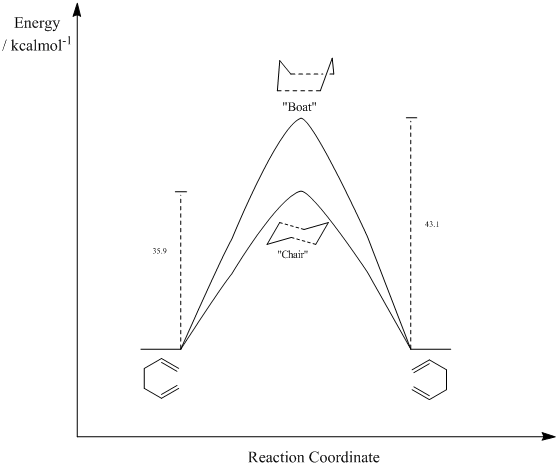
Table 10 shows the difference in energy between the transition structures and the reactant/product 1,5-hexadiene. These are the activation energies of the reaction. This is represented graphically in Figure 18. It can be seen that the calculated activation energies at 0 K are very similar to literature values. This shows that the B3LYP/6-31G(d) method and basis set is accurate enough to calculate transition structures of simple reactions and give results which are very similar to those of literature values. However, the use of the lower level HF/3-21G method and basis set was in order to show that the "chair" transition structure was lower in energy and therefore more stable before more advanced optimisations were carried out.
It can also be clearly seen that there is lower activation energy for the formation of the “chair” transition structure, by 7.2 kcalmol-1. Therefore the kinetic route (the route with the lowest activation energy ) occurs via the “chair” transition structure. Technically, a route that proceeds via the “boat” transition structure could not be defined as the thermodynamic route. This would imply that the product is more stable as the reactant and product will have the same energy as they are the same molecule.
The Diels Alder Cycloaddition
Introduction
The Diels–Alder reaction is a cycloaddition reaction between a conjugated diene and a substituted alkene, called a dienophile, to form a substituted cyclohexene system[6]. Figure 19 shows a standard Diels Alder reaction. However, there are cases where the atoms involved in the reaction are non-carbons and therefore form a heterocycle.

The majority of Diels Alder reactions are irreversible due to the fact that they are under kinetic control. However, there are some cases where these reactions are reversible, with the reversible reaction termed retro-Diels Alder.
Diels Alder reactions have been extensively shown to be very useful in various organic synthesis reactions[7][8].
Reaction of cis-Butadiene with Ethene
Introduction
The reaction of cis-butadiene and ethene is a standard Diels Alder [4s + 2s] cycloaddition, which occurs via a concerted mechanism as seen in Figure 20.

In these types of reactions, the π-orbitals of the dienophile form the two new σ-bonds with the π-orbitals of the diene. Depending on the number of π-electrons involved in the cycloaddition, the reaction may occur in either a concerted stereospecific reaction or not. This reaction will only occur if the HOMO of one of the reactants has the same symmetry as the LUMO of the other reactant. Due to the fact that these reactants are symmetrical, only one product is expected.
Optimisation of the Reactants
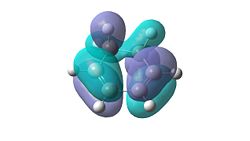
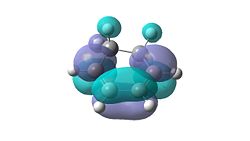
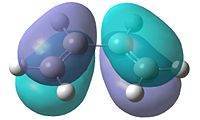
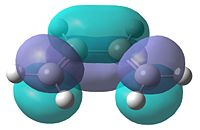
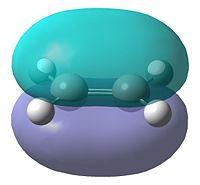
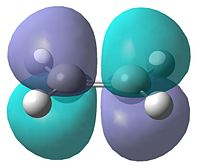
In order to determine the transition state of the Diels Alder cycloaddition reaction between cis-butadiene and ethene, the reactant molecules must first be optimised. They were optimised using AM1 semi-empirical molecular orbital method. The resultant structures can be seen in Table 11, as well as each molecule's plotted HOMO and LUMO levels. Finally, the symmetry of these molecular orbitals was determined as being symmetric or anti-symmetric with respect to the plane of reflection.
| Butadiene | Ethene | ||||||||
|
| ||||||||
 |
 |
 |
 | ||||||
| HOMO | LUMO | HOMO | LUMO | ||||||
|---|---|---|---|---|---|---|---|---|---|
| Anti-Symmetric | Symmetric | Symmetric | Anti-Symmetric | ||||||
It can be seen that the HOMO of butadiene and the LUMO of ethene are both anti-symmetric, while the reverse of each is symmetric. Therefore, in order for the orbitals to overlap and react, the orbitals must have the same symmetry properties. As a result of this, the HOMO of the butadiene can only react with the LUMO of ethene and vice versa. The interaction of these orbitals shows which of the bonds are broken and formed. If the HOMO of butadiene and LUMO of ethene are being observed, the electron density in the butadiene HOMO will go into the LUMO of ethene, which corresponds to the π*-orbital. This would weaken the double bond in ethene, breaking it, while forming the two new single bonds between the butadiene and ethene.
Optimisation of Transition State
Now that the reactants have been optimised, the transition state structure must be determined and optimised. From the previous exercises, it was shown that the most reliable method of forming and therefore optimising a transition structure was the Freeze Coordinate Method. Once this has been achieved, molecular orbital analysis of this optimised transition structure would determine if the reaction will occur between the orbitals of the same symmetry, as expected.
It has been shown previously[9] that this Diels Alder reaction occurs via an envelope transition state structure. This is so that there is a maximum amount of overlap between p-orbitals of both butadiene and ethene, creating a large conjugated π-system in the transition state. This structure was optimised using the Freeze Coordinate method as described above. In this case, the interatomic distance between the termini of the butadiene and ethene molecules was set to 2.2 Å. This distance was used as it was found by Houk et al[10]. This was initially done by the low accuracy semi-empirical AM1 molecular orbital method, followed by the more advanced and accurate B3LYP/6-31G(d) method and basis set in order to accurately determine the energy of the transition states. These results can be seen in Table 12 below:
| AM1 | B3LYP/6-31G(d) | |||||||
|---|---|---|---|---|---|---|---|---|
| Optimised Structure |
|
| ||||||
| Energy / Eh | 0.1116 | -234.5439 | ||||||
| Bond Length / Å | 2.12 | 2.27 | ||||||
| Imaginary Frequency / cm-1 |
|
It can be clearly seen that there is a very large difference in energy between the two methods employed to calculate the transition states. This is due to the fact that the B3LYP/6-31G(d) method and basis set are much more accurate than the semi-empirical AM1 molecular orbital method. As a result, it can be deduced that the energy calculated from the B3LYP/6-31G(d) calculation would be closer in energy to that of the actual transition structure. Also, while the motion that corresponds to the imaginary frequency remains the same for each of the calculations (the concerted bond formation), the imaginary frequency drastically changes between the calculations. This is due to the fact that the second derivative significantly changes when using the different method and basis set and, as a result, the imaginary frequency corresponding to this second derivative significantly changes as well.
This animated imaginary frequency clearly shows that this Diels Alder reaction occurs via a concert mechanism where both bonds are formed at the same time, which is expected for a pericyclic reaction. The lowest real frequency at 136cm-1 shows a twisting motion in the transition structure. This motion occurs around the partly formed σ C-C bonds and these carbon atoms get slightly closer to each other. However, unlike the imaginary frequency, this does not happen in a concerted manner.
Table 12 also shows the various bond lengths in the transition structure, including the bond length of the partly formed σ C-C bonds. Due to the fact that the B3LYP/6-31G (d) method and basis set are much more accurate, only the bond lengths determined from this calculation will be discussed. Firstly, it can be noted that the central bond in the butadiene fragment has a bond length of 1.40 Å. This is much shorter than an average C-C bond length (1.54 Å[11]), and is much closer to that of a C=C bond length (1.34 Å[12]). This implies that in this concerted reaction, this bond is being formed into a double bond, which is as expected from this Diels Alder reaction. Also, the “double bonds” shown in the transition structure have a slightly larger bond length than expected for double bonds. This shows that these bonds are elongating during the reaction and are forming into single bonds, which is as expected. Finally the length of the partly formed σ C-C bond is much larger than that of a a typical C-C single bond (1.54 Å[11]) and a typical C=C double bond (1.34 Å[12]). However, this value is much smaller than the combined van der Waals radii of two carbon atoms (3.40 Å[13]). The van der Waals radius of a carbon atom is the radius of an imaginary hard sphere which can be used to model the atom. As this interatomic distance is much smaller than that of the combined van der Waals radii of two carbon atoms, it implies that a bond forming process is occurring between these atoms as they are close enough to share electron density.
Molecular Orbital Analysis of the Transition State
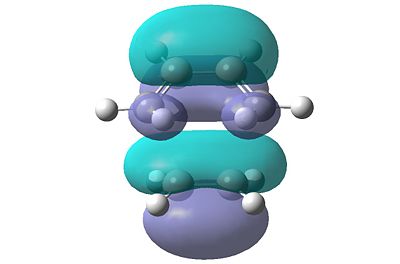
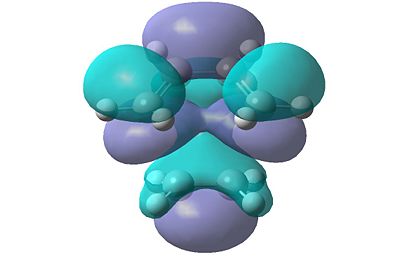
In order to determine which of the HOMOs and LUMOs interacted with each other to form the transition state, the molecular orbitals were analysed. Due to the symmetry rule which states that it is forbidden for orbitals of different symmetry properties to interact, the symmetry of the resultant HOMO and LUMO levels in the transition structure will have the same symmetry as the HOMO and LUMO levels that interacted to form them. The HOMO and LUMO levels for the transition structure calculated using the B3LYP/6-31G(d) calculation are shown in Figure 21.
 |
 |
| HOMO | LUMO |
| Figure 21: Visualised Frontier Orbitals of the Transition Structure | |
It can be clearly seen that both of these orbitals are symmetric. This therefore implies that the orbitals of butadiene and ethene that interacted were also symmetric. Therefore the HOMO of ethene interacted with the LUMO of butadiene to form the transition structure. As the symmetry of the orbitals is retained, the reaction can occur as the symmetry rule is not broken.
Reaction of Cyclohexa-1,3-diene with Maleic Anhydride
Introduction
The Diels Alder reaction between cyclohexa-1,3-diene and maleic anhydride occurs via a concerted regioselective cycloaddition[14]. This reaction can either form the endo or the exo product, as shown in Figure 22.

However, it has been shown experimentally, that only the endo product is formed[14]. This is not only because Diels Alder reactions are under kinetic control and are therefore irreversible[15] but also because of the endo rule[16]. This states that, for a Diels Alder reaction, the most stable transition state occurs when there is a large interaction between the double bonds, which occurs when they congregate near each other[16].
During this exercise, the relative energies of the endo and exo transition structures will be determined and will be used to explain this observed regioselectively.
Optimisation of the Reactants
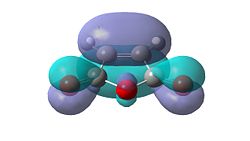
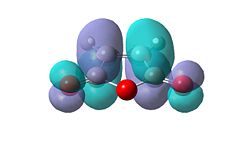
In order to determine the transition state of this regioselective Diels Alder cycloaddition reaction between cyclohexa-1,3-diene and maleic anhydride, the reactant molecules must first be optimised. They were optimised using AM1 semi-empirical molecular orbital method. The resultant structures can be seen in Table 13, as well as each molecules’ plotted HOMO and LUMO levels. Finally, the symmetry of these molecular orbitals was determined as being symmetric or anti-symmetric with respect to the plane of reflection.
In order for the reaction to occur, the orbital symmetry must be conserved. This therefore means that a symmetric HOMO will interact with a symmetric LUMO to form two symmetric molecular orbitals. It can be seen that the HOMO of cyclohexa-1,3-diene and the LUMO of maleic anhydride are both anti-symmetric, while the reverse of each is symmetric. Therefore, in order for the orbitals to overlap and react, the orbitals must have the same symmetry properties. As a result of this, the HOMO of the cyclohexa-1,3-diene can only react with the LUMO of maleic anhydride and the HOMO of maleic anhydride can only react with the LUMO of cyclohexa-1,3-diene.
Optimisation of the Transition States
These optimised reactant molecules were then used to calculate the endo and exo transition structures. From the previous exercises, it was shown that the most reliable method of forming and therefore optimising a transition structure was the Freeze Coordinate Method. Therefore, this method will be implemented during this section.
This type of Diels Alder reaction occurs via an envelope transition state structure with the ethylene group in a bridging position. This is so that there is a maximum amount of overlap between p-orbitals reactant molecules, creating a large conjugated π-system in the transition state. This structure was optimised using the Freeze Coordinate method as described above. Once again, the interatomic distance between the termini of the molecules was set to 2.2 Å. This was initially done using the low accuracy semi-empirical AM1 molecular orbital method, followed by the more advanced and accurate B3LYP/6-31G (d) method and basis set in order to accurately determine the energy of the transition states. Due to the fact that the B3LYP/6-31G(d) calculations have constantly given accurate results, only the results calculated from these calculations will be shown in Table 14 below:
| Endo | Exo | |||||||
|---|---|---|---|---|---|---|---|---|
| Optimised Structure |
|
| ||||||
| Energy / Eh | -612.6834 | -612.6793 | ||||||
| Bond Length / Å | 2.27 | 2.29 | ||||||
| Imaginary Frequency / cm-1 |
|
The animated imaginary frequencies clearly show that both of these Diels Alder reactions occur via a concerted mechanism where both bonds are formed at the same time, which is as expected for a pericyclic reaction. From this table, it is clear to see that the transition structure that leads to the endo product has a lower energy. This agrees with what is predicted by the endo rule, as the endo transition structure is stabilised due to the increased “accumulation of double bonds”[16]. This difference in energy is 10.7 kJmol-1. This slight destabilisation of the exo transition structure can be explained in terms of steric interactions. There would most likely be steric repulsion between the carbonyl oxygen atoms and the hydrogen atoms of the ethylene bridge and, as a result, the energy of the exo transition structure would be raised.
Table 14 also shows the bond length of the partly formed σ C-C bonds. It can be seen that the partly formed σ C-C bond is slightly longer for the exo transition structure compared to the endo structure. However, both of these bond lengths are far longer than a typical C-C single bond (1.54 Å) and a typical C=C double bond (1.34Å). These values are much smaller than the combined van der Waals radii of two carbon atoms (3.40Å). This implies that a bond forming process is occurring between these atoms, as they are close enough to share electron density.
Molecular Orbital Analysis of the Transition States
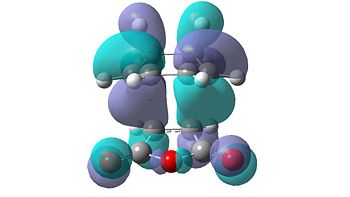
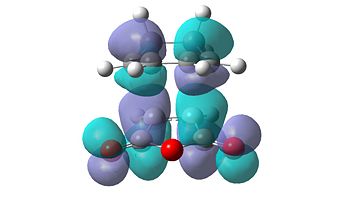
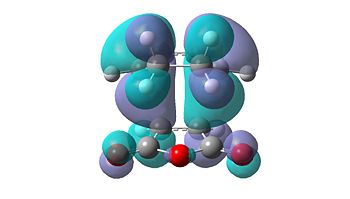
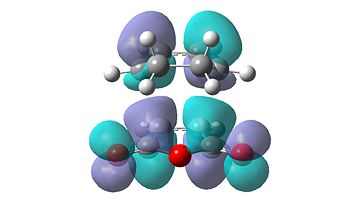
The molecular orbitals of the transition states were also calculated and visualised in order to explain this apparent stability of the endo transition structure. The HOMO and LUMO levels for both the endo and exo transition structures can be seen in Table 15 below.
| Endo | Exo | ||
|---|---|---|---|
 |
 |
 |
 |
| HOMO | LUMO | HOMO | LUMO |
From initial inspection of these molecular orbitals, it is apparent that they are all anti-symmetric orbitals. This therefore implies that the orbitals of the reactants that interacted were also anti-symmetric. Due to the fact that the reaction only occurs when the symmetry of the orbitals is retained, as the symmetry rule cannot be not broken, the HOMO of cyclohexa-1,3-diene and the LUMO of maleic anhydride interact to form both transition structures.
However, this does not explain the relative stability of the endo transition structure. This could be explained via secondary orbital interactions. This type of interaction involves the interactions between atoms which are not directly bonded and is an application of Linear Combination of Bond Orbital (LBAO) theory[17]. In this example, the only type of secondary orbital interaction seen is between the π-systems as seen in Figure 23.
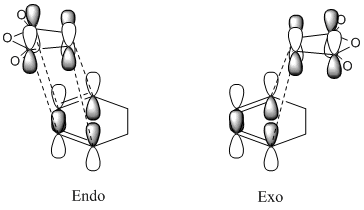
It can be seen from this that there is a greater number of favourable interactions in the endo transition structure. Therefore, from Deslongchamps’ theory[18][19] that “two stereoelectronic interactions are better than one”, it can be concluded that the endo transition structure is more stable, which it is.
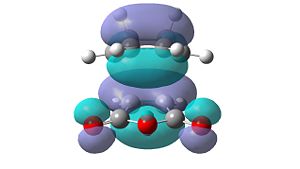
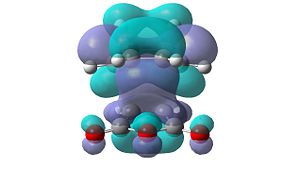
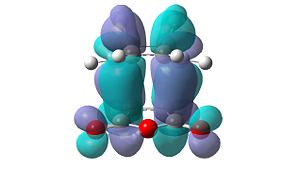
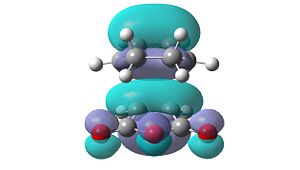
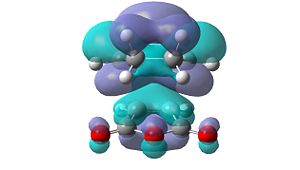
However, these secondary orbital interactions are not observed in either the HOMO or LUMO levels of the endo transition structure. A possible reason for this is that orbitals of similar energy can be interconverted in GaussView. This is an intrinsic error in the program. Therefore, the orbitals around the frontier orbitals were visualised in order to see if any secondary orbital interactions were present. These visualised orbitals can be seen in Table 16.
| HOMO-2 | HOMO-1 | LUMO+1 | LUMO+2 | |
|---|---|---|---|---|
| Endo | 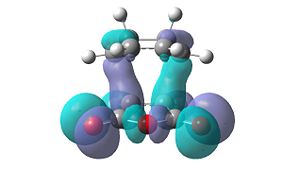 |
 |
 |
 |
| Exo | 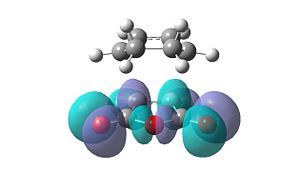 |
 |
 |
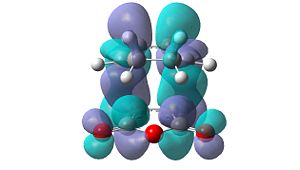 |
Unfortunately, no secondary orbital interactions can be seen in these orbitals either. However, the LUMO+1 and LUMO+2 levels in the endo transition structure show similar interactions. The differences are that, in the LUMO+1 level, only the interaction between the carbonyl π*-orbitals and the cyclohexa-1,3-diene π-orbitals is seen. In the LUMO+2 level, the two interactions are seen, but the orbitals do not have the expected phases.
What is clear from these diagrams is that these interactions are present in the endo transition structure, but are not present in the exo transition structure. These extra interactions most likely stabilise the endo transition structure, therefore making the endo product the kinetic product, which will be formed due to the Diels Alder reaction being under kinetic control.
Another reason why these secondary orbital interactions are not seen could be due to the fact that the quantum mechanically calculated molecular orbitals calculated in this exercise give an accurate description of the molecular orbitals. However, as mentioned before, secondary orbital interactions are an application of Linear Combination of Bond Orbital (LBAO) theory. As implied from its name, this is a theory and is not proven, despite the fact that it is widely used (due to the ease of visualising the interactions). Another reason could be due to the method and basis set used in these calculations not accurate enough to calculate secondary orbital interactions, despite the fact that in the previous exercises, this level of calculations has given accurate results similar to literature values. In order to test this, the calculations should be run using even an even more accurate method and basis set, such as B3LYP/6-311G(d,p), as this basis set allows for diffuse orbitals and polarisation to be calculated.
Conclusion
The exercises in this module showed how various computational techniques can be used not only to model different transition states of reaction pathways, but also to help explain why a reaction occurs in a stereospecific manner. The reactions that were investigated were the Cope rearrangement and two different Diels Alder reactions. These computational methods also allowed the different pathways of a reaction to be investigated, by calculating the activation energy of the pathways, and predicting what the kinetic and thermodynamic products would be.
In conclusion, the use of these various computational methods was successful in calculating the structures of the various reactants and transition states of the mentioned reactions. However, it was shown that the higher accuracy method and basis set, B3LYP/6-31G(d), gave far more accurate results which were similar to literature values. However, even this level of calculations was not accurate enough to explain secondary orbital interactions. It was also shown that, out of the various methods employed to optimise the transition structures, by far the most reliable method was the freeze coordinate method, as this optimised the entire molecule apart from the frozen reaction coordinate, which was subsequently optimised. What was interesting to see was that both the freeze coordinate method and the TS (Berny) method produced identical transition structures. This shows that each method is competent at optimising transition structures, but the main disadvantage of the TS (Berny) method was that, if the initial geometry was not good enough, the calculations would fail to give the optimised transition structure.
References
- ↑ 1.0 1.1 A. C. Cope et al., J. Am. Chem. Soc., 1940, 62, 441
- ↑ R. V. Williams, Chem. Rev. 2001, 101 (5), 1185
- ↑ 3.0 3.1 3.2 3.3 3.4 B. G. Rocque et al., Mol. Phys., 2002, 100 (4), 441
- ↑ 4.0 4.1 G. Schultz, I. Hargittai,J. Mol. Struct., 1995, 346, 63
- ↑ A. K. Mal'tsev et al., B. Acad. Sci, USSR. CH+., 1984, 33, 510
- ↑ O. Diels, K. Alder, Liebigs Ann. Chem., 1928, 460, 98 DOI:10.1002/jlac.19284600106
- ↑ K. C. Nicolaou, S. A. Snyder, T. Montagnon and G. Vassilikogiannakis, Angew. Chem. Int. Edit., 2002, 41, 1668 DOI:<1668::AID-ANIE1668>3.0.CO;2-Z 10.1002/1521-3773(20020517)41:10<1668::AID-ANIE1668>3.0.CO;2-Z
- ↑ M. C. Kloetzel, Org. React. 1948, 4, 1
- ↑ R. Sustmann et al., Tetrahedron Lett., 1988, 29 (37), 4699
- ↑ K. N. Houk et al.,J. Am. Chem. Soc., 1986, 108, 554
- ↑ 11.0 11.1 Handbook of Chemistry & Physics, 65th edn., CRC Press
- ↑ 12.0 12.1 L. G. Wade, Organic Chemistry, 2006, 6thedn., Pearson Prentice Hall, 279
- ↑ A. Bondi, J. Phys. Chem., 1964, 68 (3), 441, DOI:10.1021/j100785a001
- ↑ 14.0 14.1 Z. Zhu, J. H. Espenson, J. Am. Chem. Soc., 1997, 119 (15), 3507
- ↑ J. Sauer, R. Sustmann, Angew. Chem., 1980, 19, 779: DOI:10.1002/anie.198007791
- ↑ 16.0 16.1 16.2 K. Alder, G. Stein, Angew. Chem., 1937, 50, 514: DOI:10.1002/ange.19370502804
- ↑ Brunck, Weinhold, J. Am. Chem. Soc. 1979, 101, 1700 DOI:10.1021/ja00501a009 10.1021/ja00501a009
- ↑ P. Deslongchamps, Tetrahedron, 1975, 31, 2463
- ↑ P. Deslongchamps, Heterocycles, 1977, 7, 1271

