Rep:Mod:KRM
Compulsory Section
Molecular Optimisations
BH3
A molecule of BH3 was created then optimised in Gaussian using the B3LUYP method and a 3-21G basis set. This basis set is of low accuracy, but makes for a quick calculation. The log file can be found here.
| Parameter | Value |
|---|---|
| File Type | .log |
| Calculation Type | FOPT |
| Basis Set | 3-21G |
| Final Energy | -26.46 au |
| Gradient | 0.00020672 au |
| Dipole Moment | 0.00 Debye |
| Point Group | D3H |
| Time to calculate | 21 seconds |
As can be seen from the data below, it converged successfully.
Item               Value     Threshold  Converged?
 Maximum Force            0.000413     0.000450     YES
 RMS     Force            0.000271     0.000300     YES
 Maximum Displacement     0.001610     0.001800     YES
 RMS     Displacement     0.001054     0.001200     YES
 Predicted change in Energy=-1.071764D-06
 Optimization completed.
    -- Stationary point found.
2nd BH3 Optimisation
The BH3 molecule was then reoptimised using a higher basis set (6-31G(d,p)). This basis set can provide a more accurate result. The log file can be found here.
The key word int-ultrafine was also used, as this gives a higher degree of accuracy. Int-ultrafine uses the maximum number of points on the grid used for integrations. From now on, all optimisations will use this keyword for greater accuracy.
| Parameter | Value |
|---|---|
| File Type | .log |
| Calculation Type | FOPT |
| Basis Set | 6-31G(d,p) |
| Final Energy | -26.62 au |
| Gradient | 0.00014139 au |
| Dipole Moment | 0.00 Debye |
| Point Group | D3H |
| Time to calculate | 10 seconds |
Item               Value     Threshold  Converged?
 Maximum Force            0.000283     0.000450     YES
 RMS     Force            0.000185     0.000300     YES
 Maximum Displacement     0.001125     0.001800     YES
 RMS     Displacement     0.000736     0.001200     YES
 Predicted change in Energy=-4.770182D-07
 Optimization completed.
    -- Stationary point found.
test molecule |
The optimised B-H bond distance was found to be 1.19 Å. The optimal H-B-H bond angle was 120.0°
| Basis set of optimisation | Value |
|---|---|
| 3-21G | -26.46 au |
| 6-31+G(d,p) | -26.62 au |
| Difference | 0.15 au |
The difference between the two optimisations was found to equal about 0.15 au.
GaBr3
A molecule of GaBr3 was created then optimised in Gaussian using the B3LUYP method and a LANL2DZ basis set. The log file can be found here.
Digital repository can be found here: http://hdl.handle.net/10042/25183
| Parameter | Value |
|---|---|
| File Type | .log |
| Calculation Type | FOPT |
| Basis Set | LANL2DZ |
| Final Energy | -41.70 au |
| Gradient | 0.00402846 au |
| Dipole Moment | 0.0000 Debye |
| Point Group | D3H |
| Time to calculate | 13.8 seconds |
As can be seen from the data below, it converged successfully.
Item               Value     Threshold  Converged?
 Maximum Force            0.000000     0.000450     YES
 RMS     Force            0.000000     0.000300     YES
 Maximum Displacement     0.000003     0.001800     YES
 RMS     Displacement     0.000002     0.001200     YES
 Predicted change in Energy=-1.282690D-12
 Optimization completed.
    -- Stationary point found.
test molecule |
The optimised Br-Ga bond distance was found to be 2.39 Å. This is close to the literature bond length of 2.239Å.[1]The difference between the two values may be because the basis set used was nto accurate enough. The optimal Br-Ga-Br bond angle was 120.0°. This is as expected as per a symmetrical, trigonal planar molecule.
BBr3
A molecule of BBr3 was created then optimised in Gaussian using the B3LUYP method and a GEN basis set. The log file can be found here
Digital repository can be found here: http://hdl.handle.net/10042/25209
| Parameter | Value |
|---|---|
| File Type | .log |
| Calculation Type | FOPT |
| Basis Set | Gen |
| Final Energy | -64.44 au |
| Gradient | 0.00000382 au |
| Dipole Moment | 0.00 Debye |
| Point Group | D3H |
| Time to calculate | 18.6 seconds |
As can be seen from the data below, it converged successfully.
Item               Value     Threshold  Converged?
 Maximum Force            0.000008     0.000450     YES
 RMS     Force            0.000005     0.000300     YES
 Maximum Displacement     0.000036     0.001800     YES
 RMS     Displacement     0.000023     0.001200     YES
 Predicted change in Energy=-4.027557D-10
 Optimization completed.
    -- Stationary point found.
test molecule |
The optimised Br-B bond distance was found to be 1.93 Å. The optimal Br-B-Br bond angle was 120.0°.
Summary and Analysis
| Molecule | Bond Distance (Å) |
|---|---|
| BH3 | 1.19 |
| BBr3 | 1.93 |
| GaBr3 | 2.39 |
As can be seen from the table above, changing the ligand changes the optimal, average bond length, in this case using Br instead instead of H increases the bond length. H and Br both usually form one bond each, as H is in group 1 and Br in group 7, however the atomic mass of the two elements is very different. Br is around 80 times the mass of H. Br is also more electronegative than H. Br is also larger, having a Van der Waal's (VdW) radius of around 1.9Å[2], compared to 1.2Å for H[3]. This would mean that bonds made with these elements would differ in length also, as the VdW radii differ.
As the atoms get larger, orbital overlap becomes weaker, and so the bond is weakened. GaBr3 has the biggest, most diffuse orbitals and so the weakest bonds.
In all cases, the ligand is more electronegative than the central atom and so electron density is drawn away from the centre to the ligands. This is most pronounced for GaBr3, where the electronegativity difference is greatest.[4]
A bond is simply an area of increased electron density between atoms. Gaussview doesn't automatically draw in the expected bonds, perhaps because the distance between them is greater than the traditional bond length that using the VdW radii would predict for a bond. Gaussview may draw bonds by predicting electron density, so when the atoms are far apart, the electron density might be too small to be classed as a bond. When the distance shrinks upon optimisation, a bond is drawn.
Frequency Analysis
BH3
A frequency analysis of the more higherly optimised BH3 molecule was then carried out, using the 6-31G(D,P) basis set. The log file can be found here
| Parameter | Value |
|---|---|
| File Type | .log |
| Calculation Type | FREQ |
| Basis Set | 6-31G(D,P) |
| Final Energy | -26.62 au |
| Gradient | 0.00000242 au |
| Dipole Moment | 0.00 Debye |
| Point Group | D3H |
| Time to calculate | 21.0 seconds |
the data below shows that this successfully converges.
Item               Value     Threshold  Converged?
 Maximum Force            0.000005     0.000450     YES
 RMS     Force            0.000002     0.000300     YES
 Maximum Displacement     0.000019     0.001800     YES
 RMS     Displacement     0.000010     0.001200     YES
 Predicted change in Energy=-1.378611D-10
 Optimization completed.
    -- Stationary point found.
The low frequencies are within the ±15 cm-1 stated requirement, so this can be thought of as the minimum energy point.
Low frequencies ---  -11.9877  -11.9804   -7.0672   -0.0004    0.0260    0.4183
 Low frequencies --- 1162.9723 1213.1375 1213.1377
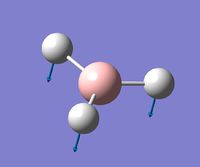
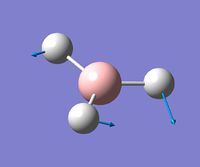
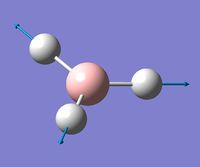
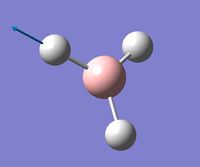
The table below outlines the different 'real' vibrational modes of BH3.
IR Spectrum
The predicted IR spectrum is shown below.
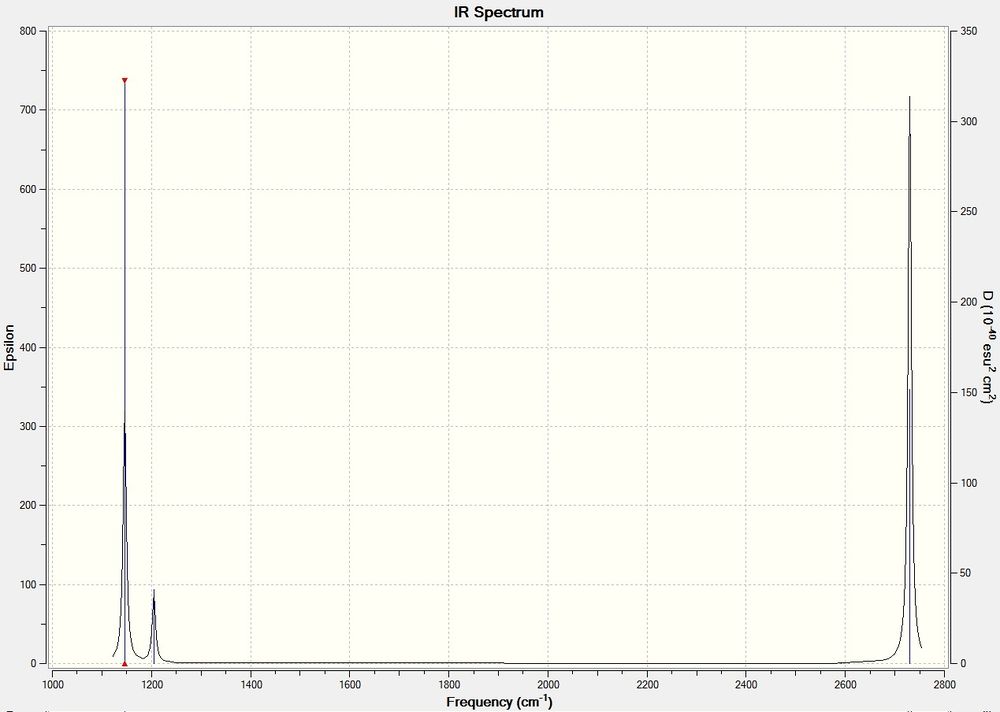
Whilst there are 6 vibrations, there are only 3 peaks visible in the IR spectrum. Mode 4 is totally symmetric, and so does not register with IR, as it requires an asymmetric stretch to create a momentary dipole. Modes 2&3 and 5&6 are degenerate and so have the same energy and so show in the same peak on the spectrum. Only 1 mode (1) is both asymmetric and not degenerate.
GaBr3
The previously optimised molecule of GaBr3 was then submitted for frequency analysis using the LANL2DZ basis set.
Digital repository can be found here:http://hdl.handle.net/10042/25325
| Parameter | Value |
|---|---|
| File Type | .log |
| Calculation Type | FREQ |
| Basis Set | LANL2DZ |
| Final Energy | -41.70 au |
| Gradient | 0.00000011 au |
| Dipole Moment | 0.00 Debye |
| Point Group | D3H |
| Time to calculate | 9.0 seconds |
The data shows that it converged successfully.
Item               Value     Threshold  Converged?
 Maximum Force            0.000000     0.000450     YES
 RMS     Force            0.000000     0.000300     YES
 Maximum Displacement     0.000002     0.001800     YES
 RMS     Displacement     0.000001     0.001200     YES
 Predicted change in Energy=-6.142862D-13
 Optimization completed.
    -- Stationary point found.
Low frequencies ---   -0.5252   -0.5247   -0.0024   -0.0010    0.0235    1.2010
 Low frequencies ---   76.3744   76.3753   99.6982
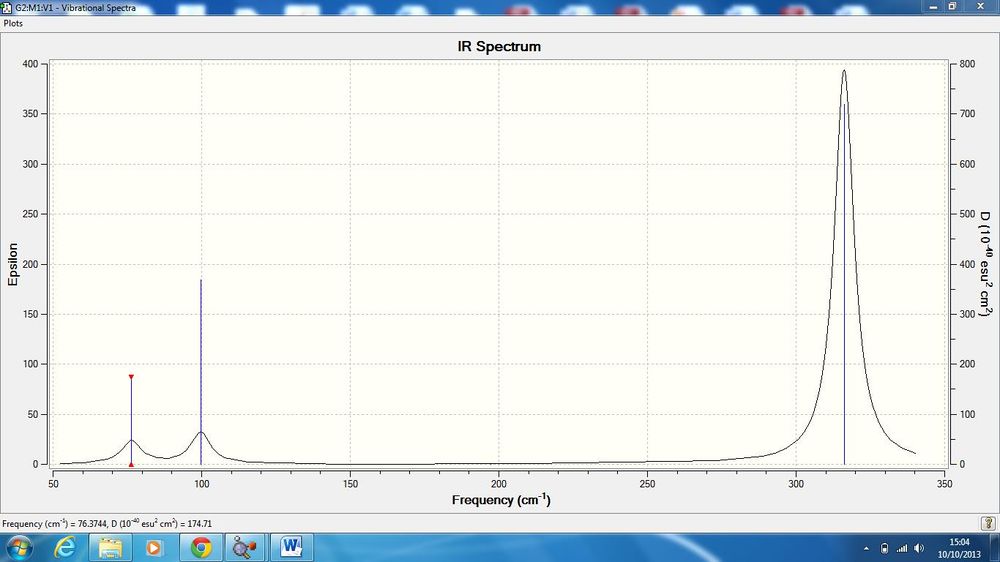
The lowest frequency 'real' modes and 1&2. They are degenerate and at around 76.4 cm-1. The low frequencies suggest that this is an energetic minimum.
IR Spectrum
Summary and Analysis
| Mode | BH3 frequency (cm-1) | GaBr3 frequency (cm-1) |
|---|---|---|
| 1 | 1163 | 76 |
| 2 | 1213 | 76 |
| 3 | 1213 | 100 |
| 4 | 2583 | 197 |
| 5 | 2716 | 316 |
| 6 | 2716 | 316 |
As can be seen from the table above, there is a large disparity between the two sets of data.
The fundamental vibrational frequency (v) of a bond between two atoms (A&B) can be given by the following equation:

Where 'k' is the spring constant of the bond and μ is the reduced mass of the system, given by:
![]()
Where mA is the mass of atom A, and mB the mass of atom B.
These equations go some way to explain the disparity between the data set. The mass of both atoms in GaBr3 are far heavier than those in BH3. This means the the reduced mass will be much higher, and therefore the vibrational frequency lower, as vibrational frequency is inversely proportional to reduced mass. The spring constant will also vary depending on the atoms used.
The modes are the same, but they have been reordered. Modes 2&3 for BH3 and 1&2 for GaBr3 have swapped order.
The spectra are similar in the way that there are three modes grouped at a lower frequency and two grouped at a much higher frequency. The spectrum for BH3 shows much more intense peaks for the lowest and highest energy modes. GaBr3 has one very intense peak only, at 316.19 cm-1.
Four modes are grouped together in pairs because these motions correspond to either a stretching (which is of higher energy) or a bending which requires less energy.
The same method basis sets must be used for both the optimisation and the frequency calculation because if different methods are used, the analyses will be using different molecules, then they will be incomparable. Different levels of basis set and method also give differing levels of accuracy and precision.
A frequency analysis tells us whether the position along the potential energy surface that the molecule is at is a maximum or minimum. An optimisation only finds a point of 0 gradient. There are two points of 0 gradient in this example, a minimum energy and a transition state. Optimisation alone does not differentiate between them.
The 6 low frequencies represent the motions of the centre of mass of the molecule. These are significantly smaller than the other frequencies.
BH3 MO Diagram
The MO's of the previously optimised BH3 molecule were calculated using the setup below. The log file can be found here
| Parameter | Value |
|---|---|
| File Type | .log |
| Calculation Type | FSP |
| Basis Set | 6-31G9(d,p) |
| Final Energy | -26.62 au |
| Gradient | 0.00020672 au |
| Dipole Moment | 0.00 Debye |
| Point Group | D3H |
| Time to calculate | 19 seconds |
Once the MO's were calculated they were visualised in GaussView. These were then added to an MO diagram drawn on ChemDraw. This is shown below.
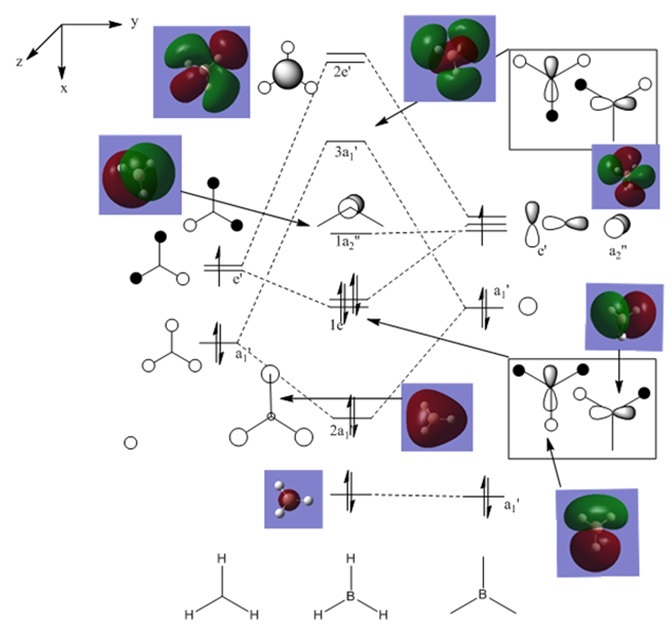
As can be seen, the real and LCAO MO's are very similar. They are almost exactly the same up until the non-bonding orbitals. After that, they start to deviate slightly. This still however shows that qualitative MO theroy is very useful, as all of the occupied orbitals have been estimated with great accuracy.
NH3 NBO
An NH3 molecule was created and optimised with the 6-31G(d,p) basis set and the results are shown below. The optimisation log file can be found here
| Parameter | Value |
|---|---|
| File Type | .log |
| Calculation Type | FOPT |
| Basis Set | 6-31G(d,p) |
| Final Energy | -56.56 au |
| Gradient | 0.00000137 au |
| Dipole Moment | 1.85 Debye |
| Point Group | C1 |
| Time to calculate | 21 seconds |
The data below shows the successful convergence of the optimisation.
Item               Value     Threshold  Converged?
 Maximum Force            0.000004     0.000015     YES
 RMS     Force            0.000001     0.000010     YES
 Maximum Displacement     0.000008     0.000060     YES
 RMS     Displacement     0.000004     0.000040     YES
 Predicted change in Energy=-1.779768D-11
 Optimization completed.
    -- Stationary point found.
A frequency analysis was then carried out to determine if the molecule was correctly optimised. The log file can be found here and is detailed below.
| Parameter | Value |
|---|---|
| File Type | .log |
| Calculation Type | FREQ |
| Basis Set | 6-31G(d,p) |
| Final Energy | -56.56 au |
| Gradient | 0.00000152 au |
| Dipole Moment | 1.85 Debye |
| Point Group | C1 |
| Time to calculate | 25 seconds |
The data below shows a successful convergence.
Item               Value     Threshold  Converged?
 Maximum Force            0.000003     0.000450     YES
 RMS     Force            0.000002     0.000300     YES
 Maximum Displacement     0.000008     0.001800     YES
 RMS     Displacement     0.000003     0.001200     YES
 Predicted change in Energy=-2.187882D-11
 Optimization completed.
    -- Stationary point found.
Low frequencies ---   -9.3678   -8.1299   -5.9522    0.0005    0.0010    0.0012
 Low frequencies --- 1089.3374 1693.9210 1693.9251
Finally a population analysis was carried out on the optimised NH3. This is detailed below. The log file can be found here.
| Parameter | Value |
|---|---|
| File Type | .log |
| Calculation Type | SP |
| Basis Set | 6-31G(d,p) |
| Final Energy | -56.56 au |
| Gradient | |
| Dipole Moment | 1.85 Debye |
| Point Group | C1 |
| Time to calculate | 17 seconds |
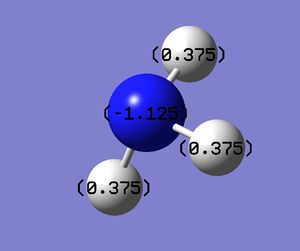
A Natural Bond Orbital Analysis of the NH3 molecule was then carried out.
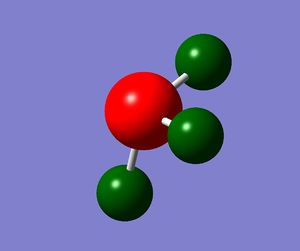
The charge range used was -1.125 to +1.125
Association energy of NH3 and BH3
NH3BH3 Optimisation & Frequency analysis
A molecule of NH3BH3 was created then optimised using the same method and basis set as the NH3 molecule and the BH3. The log file can be found here
| Parameter | Value |
|---|---|
| File Type | .log |
| Calculation Type | FOPT |
| Basis Set | 6-31G9d,p) |
| Final Energy | -83.22 au |
| Gradient | 0.00005975 au |
| Dipole Moment | 5.57 Debye |
| Point Group | C1 |
| Time to calculate | 1 minute 52 seconds |
The data below shows a successful convergence.
Item               Value     Threshold  Converged?
 Maximum Force            0.000122     0.000450     YES
 RMS     Force            0.000058     0.000300     YES
 Maximum Displacement     0.000513     0.001800     YES
 RMS     Displacement     0.000296     0.001200     YES
 Predicted change in Energy=-1.631181D-07
 Optimization completed.
    -- Stationary point found.
A frequency analysis of the molecule was then carried out. The log file can be found here
| Parameter | Value |
|---|---|
| File Type | .log |
| Calculation Type | FREQ |
| Basis Set | 6-31G9d,p) |
| Final Energy | -83.22 au |
| Gradient | 0.00005968 au |
| Dipole Moment | 5.57 Debye |
| Point Group | C1 |
| Time to calculate | 1 minute 2 seconds |
The data below shows a successful convergence.
Item               Value     Threshold  Converged?
 Maximum Force            0.000114     0.000450     YES
 RMS     Force            0.000060     0.000300     YES
 Maximum Displacement     0.000579     0.001800     YES
 RMS     Displacement     0.000346     0.001200     YES
 Predicted change in Energy=-1.730768D-07
 Optimization completed.
    -- Stationary point found.
Low frequencies ---    0.0006    0.0011    0.0015   16.8372   17.4093   37.2732
 Low frequencies ---  265.8194  632.2112  639.3256
The lowest mode occurs at 266 cm-1
Summary and Analysis
All of the data regarding the energies of NH3, BH3 and NH3BH3 were then correlated in the table below
| Molecule | Energy (au) |
|---|---|
| BH3 | -26.62 |
| NH3 | -56.56 |
| NH3BH3 | -83.22 |
The energy difference can be given by the following formula: ΔE=E(NH3BH3)-[E(NH3)+E(BH3). According to this formula and the data, the energy difference is -0.05159668 au. This is equivalent to around -135.47 kJ/mol. The dissociation energy is therefore +135.47 kJ/mol.
Ionic Liquids: Desginer Solvents Mini Project
Molecules of [N(CH3)4]+, [P(CH3)4]+ and [S(CH3)3]+ were created and optimised. The details are shown below.
Optimisations and Analyses
[N(CH3)4]+
The digital repository can be found here:http://hdl.handle.net/10042/25478. The log file can be found here
| Parameter | Value |
|---|---|
| File Type | .log |
| Calculation Type | FOPT |
| Basis Set | 6-31G(d,p) |
| Final Energy | -214.18 au |
| Gradient | 0.00004413 au |
| Dipole Moment | 22.56 Debye |
| Point Group | C1 |
| Time to calculate | 2 minutes 57 seconds |
As can be seen from the data below, it converged successfully.
Item               Value     Threshold  Converged?
 Maximum Force            0.000068     0.000450     YES
 RMS     Force            0.000027     0.000300     YES
 Maximum Displacement     0.000453     0.001800     YES
 RMS     Displacement     0.000124     0.001200     YES
 Predicted change in Energy=-8.897040D-08
 Optimization completed.
    -- Stationary point found.
The optimised molecule was then subjected to a frequency analysis to check the validity of the optimisation.
The log file can be found here. The digital repository can be found here: http://hdl.handle.net/10042/25719
| Parameter | Value |
|---|---|
| File Type | .log |
| Calculation Type | FREQ |
| Basis Set | 6-31G(d,p) |
| Final Energy | -214.18 au |
| Gradient | 0.00004409 au |
| Dipole Moment | 22.56 Debye |
| Point Group | C1 |
| Time to calculate | 6 minutes 42 seconds |
As can be seen from the data below, it converged successfully.
Item               Value     Threshold  Converged?
 Maximum Force            0.000110     0.000450     YES
 RMS     Force            0.000044     0.000300     YES
 Maximum Displacement     0.001077     0.001800     YES
 RMS     Displacement     0.000376     0.001200     YES
 Predicted change in Energy=-9.424128D-08
 Optimization completed.
    -- Stationary point found.
Low frequencies ---  -13.0055   -0.0009   -0.0008   -0.0007    6.2187   12.1424
 Low frequencies ---  181.5408  279.9741  286.8026
[P(CH3)4]+
The log file can be found here, The digital depository can be found here: http://hdl.handle.net/10042/25479.
| Parameter | Value |
|---|---|
| File Type | .log |
| Calculation Type | FOPT |
| Basis Set | 6-31G(d,p) |
| Final Energy | -500.83 au |
| Gradient | -500.83 au |
| Dipole Moment | 22.56 Debye |
| Point Group | C1 |
| Time to calculate | 5 minutes 48 seconds |
As can be seen from the data below, it converged successfully.
Item               Value     Threshold  Converged?
 Maximum Force            0.000190     0.000450     YES
 RMS     Force            0.000037     0.000300     YES
 Maximum Displacement     0.001167     0.001800     YES
 RMS     Displacement     0.000376     0.001200     YES
 Predicted change in Energy=-2.475395D-07
 Optimization completed.
    -- Stationary point found.
The optimised molecule was then subjected to a frequency analysis to check the validity of the optimisation.
The log file can be found here. The digital depository can be found here:http://hdl.handle.net/10042/25720
| Parameter | Value |
|---|---|
| File Type | .log |
| Calculation Type | FREQ |
| Basis Set | 6-31G(d,p) |
| Final Energy | -500.83 au |
| Gradient | 0.00003221 au |
| Dipole Moment | 22.56 Debye |
| Point Group | C1 |
| Time to calculate | 7 minutes 29 seconds |
Item               Value     Threshold  Converged?
 Maximum Force            0.000119     0.000450     YES
 RMS     Force            0.000032     0.000300     YES
 Maximum Displacement     0.000699     0.001800     YES
 RMS     Displacement     0.000214     0.001200     YES
 Predicted change in Energy=-3.966969D-07
[S(CH3)3]+
The log file can be found here. The digital depository can be found here: http://hdl.handle.net/10042/25480.
| Parameter | Value |
|---|---|
| File Type | .log |
| Calculation Type | FOPT |
| Basis Set | 6-31G(d,p) |
| Final Energy | -517.68 au |
| Gradient | 0.00000343 au |
| Dipole Moment | 22.12 Debye |
| Point Group | C1 |
| Time to calculate | 10 minutes 57 seconds |
As can be seen from the data below, it converged successfully.
Item               Value     Threshold  Converged?
 Maximum Force            0.000001     0.000015     YES
 RMS     Force            0.000000     0.000010     YES
 Maximum Displacement     0.000036     0.000060     YES
 RMS     Displacement     0.000012     0.000040     YES
 Predicted change in Energy=-1.298246D-11
 Optimization completed.
    -- Stationary point found.
The optimised molecule was then subjected to a frequency analysis to check the validity of the optimisation.
The log file can be found here. The digital depository can be found here: http://hdl.handle.net/10042/25724.
| Parameter | Value |
|---|---|
| File Type | .log |
| Calculation Type | FREQ |
| Basis Set | 6-31G(d,p) |
| Final Energy | -517.68 au |
| Gradient | 0.00000344 au |
| Dipole Moment | 22.12 Debye |
| Point Group | C1 |
| Time to calculate | 3 minutes 58 seconds |
As can be seen from the data below, it converged successfully.
Item               Value     Threshold  Converged?
 Maximum Force            0.000007     0.000450     YES
 RMS     Force            0.000003     0.000300     YES
 Maximum Displacement     0.000445     0.001800     YES
 RMS     Displacement     0.000138     0.001200     YES
 Predicted change in Energy=-3.778948D-10
 Optimization completed.
    -- Stationary point found.
Low frequencies ---  -18.2424  -15.0956   -0.0029   -0.0020    0.0030   23.3416
 Low frequencies ---  163.3267  196.9306  201.5785
Geometry Analysis
A tabulated view of the bond distances is given below. The central heteroatom is represented by 'X'. Å is the unit of distance in all cases.
| Molecule | C-X Bond Distance | C-H Bond Distance | C-X-C Bond Angle |
|---|---|---|---|
| N(CH3)4]+ | 1.509 | 1.090 | 109.5° |
| P(CH3)4]+ | 1.816 | 1.093 | 109.4° |
| S(CH3)3]+ | 1.823 | 1.092 | 102.7° |
The N(CH3)4]+ and P(CH3)4]+ molecules adopt the tetrahedral geometry, whilst the S(CH3)3]+ adopts a trigonal pyramidal geometry. Because the two larger molecule have the same structure, they have very similar bond angles, close to the perfect bond angle of a tetrahedral arrangement (109.5°). The bond angles of S(CH3)3]+ are lower than that of a tetrahedral, as the lone pair on the sulphur pushes the methyl groups away, contracting the angle to less than 109.5°. In order of size, the heteroatoms are N<S<P. This is roughly in line with C-X bond distances. Bigger atoms tend to make bigger bonds. The C-S bond might be longer than expected. This could be because of lone pair repulsion lengthening the bond. The C-H distance stays very similar throughout which suggests that the central atom is too far away to directly influence this bond.
MO and NBO Analysis
[N(CH3)4]+
A population analysis was carried out on the optimised [N(CH3)4]+. This is detailed below. The log file can be found here and the digital depository here: http://hdl.handle.net/10042/25725
| Parameter | Value |
|---|---|
| File Type | .log |
| Calculation Type | SP |
| Basis Set | 6-31G(d,p) |
| Final Energy | -214.18 au |
| Gradient | |
| Dipole Moment | 22.56 Debye |
| Point Group | C1 |
| Time to calculate | 52 seconds |
[P(CH3)4]+
A population analysis was carried out on the optimised [P(CH3)4]+. This is detailed below. The log file can be found here and the digital repository here: http://hdl.handle.net/10042/25726.
| Parameter | Value |
|---|---|
| File Type | .log |
| Calculation Type | SP |
| Basis Set | 6-31G(d,p) |
| Final Energy | -500.83 au |
| Gradient | |
| Dipole Moment | 22.56 Debye |
| Point Group | C1 |
| Time to calculate | 46 seconds |
[S(CH3)3]+
A population analysis was carried out on the optimised [S(CH3)3]+. This is detailed below. The log file can be found here and the digital repository here: http://hdl.handle.net/10042/25727.
| Parameter | Value |
|---|---|
| File Type | .log |
| Calculation Type | SP |
| Basis Set | 6-31G(d,p) |
| Final Energy | -517.68 au |
| Gradient | |
| Dipole Moment | 22.12 Debye |
| Point Group | C1 |
| Time to calculate | 33 seconds |
Charge Distribution Images
The images of the charge distribution analysis are tabulated below. All coloured images use a scale which ranges from -1.7 to +1.7.
| Image Type | [N(CH3)4]+ | [P(CH3)4]+ | [S(CH3)3]+ |
|---|---|---|---|
| Colour atom by charge |  |
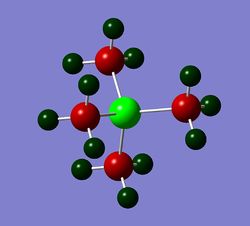 |

|
| Atomic charge | 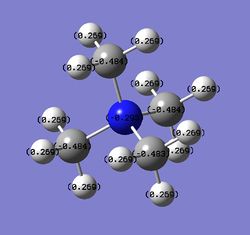 |
 |

|
Charge Distribution Analysis
The data from the NBO analysis was collated below.
| Ion | Heteroatom charge | C charge | H charge | Heteroatom electronegativity |
|---|---|---|---|---|
| [N(CH3)4]+ | -0.295 | -0.484 | +0.269 | 3.04 |
| [P(CH3)4]+ | +1.668 | -1.06 | +0.298 | 2.19 |
| [S(CH3)3]+ | +0.917 | -0.846 | +0.279 | 2.58 |
As can be seen from above, changing the heteroatom wildly changes the charge distribution. H always has a slight positive charge. This doesn't change significantly from complex to complex. Carbon is more electronegative than H (2.55 to 2.1 respectively) and so always has a negative charge. The difference in electronegativity between the heteroatom and the C atom is mirrored by the difference in electronegativity. N is the most electronegative, and so manages to draw electron density to itself preferentially over the C atoms better than the other heteroatoms. Even so, it is still more positively charged than the the C atom. This suggests that the extra positive charge that the ion has is broadly spread over the ion, but slightly concentrated on the N atom.
The other ions spread the positive charge much more poorly and it is localised on the central heteroatom. Even though, for instance, P is more electronegative than H, it carries much more negative charge. P is a lot bigger than C and so would have a poor orbital overlap. This may mean that it is more difficult to delocalise the positive charge across more atoms. S has a better orbital overlap and N the best. When the heteroatom is P or S, the changes are so localised, the bonding is ionic-like.
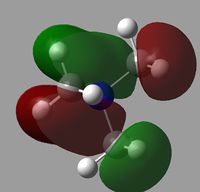
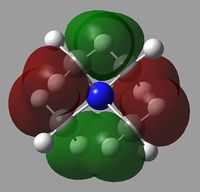
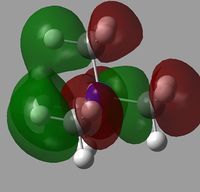
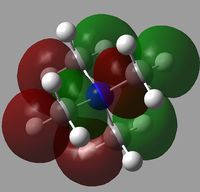
[N(CH3)4]+ MO Visualisation
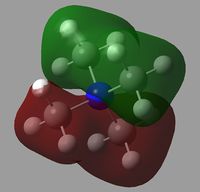
All of the MOs for [N(CH3)4]+ were generated with Gaussview. The occupied, non-core MOs are tabulated below.
| 6th MO | 7th MO | 8th MO | 9th MO |
|---|---|---|---|
 |
 |
 |
|
| 10th MO | 11th MO | 12th MO | 13th MO |
 |
 |
 |

|
| 14th MO | 15th MO | 16th MO | 17th MO |
 |
 |
 |

|
| 18th MO | 19th MO | 20th MO | 21th MO |
 |
 |
 |

|
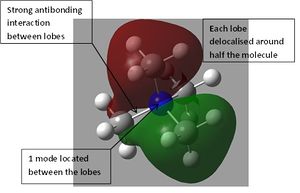
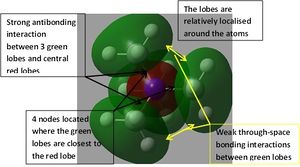
The orbital interactions of 5 of the above MOs were investigated more deeply. The results are displayed below.
| 6th MO | 8th MO | 10th MO |
|---|---|---|
 |
 |
|
| 12th MO | 17th MO | |
 |

|
C-X Bond Contribution
The C-X bonds were analysed using the NBO analysis and the data tabulated below.
| Ion | C % contribution to bond | X % contribution to bond |
|---|---|---|
| [N(CH3)4]+ | 37 | 63 |
| [P(CH3)4]+ | 60 | 40 |
| [S(CH3)3]+ | 49 | 51 |
The results above follow the trend of relative electronegativities, as before. The more electronegative the X compared to C, the less it contributes to the C-X bond. This is the same trend as when analysing charge distribution.
[NR4]+
The [NR4]+ system is traditionally described by having the positive charge on the N. The [N(CH3)4]+ ion analysed previously is a good representative of the [NR4]+ system.
If the positive charge was entirely placed on the central N, it could be assumed that the charge of that nitrogen would be close to +1. Actually, it was estimated the charge would be -0.3. This large discrepancy suggests that the positive charge is in fact not localised entirely on the N but spread across the molecule. This is further suggested by the fact that for this system, the range of charges is small; far smaller than for the other systems with different heteroatoms. A formal charge solely on the N is perhaps not helpful. A better system might be to draw the charge as across the whole molecule and not try to localise it on any one atom.
Influence of Functional Groups
A molecule of [N(CH3)3(CH2OH]+ was created then optimised. The log file can be found here
| Parameter | Value |
|---|---|
| File Type | .log |
| Calculation Type | FOPT |
| Basis Set | 6-31G(d,p) |
| Final Energy | -289.39470781 au |
| Gradient | 0.00000081 au |
| Dipole Moment | 22.3599 Debye |
| Point Group | C1 |
| Time to calculate | 55 minutes 48 seconds |
As can be seen from the data below, it converged successfully.
Item               Value     Threshold  Converged?
 Maximum Force            0.000001     0.000015     YES
 RMS     Force            0.000000     0.000010     YES
 Maximum Displacement     0.000032     0.000060     YES
 RMS     Displacement     0.000007     0.000040     YES
 Predicted change in Energy=-3.016813D-11
 Optimization completed.
    -- Stationary point found.
The optimised molecule was then subjected to a frequency analysis to check the validity of the optimisation.
The log file can be found here
| Parameter | Value |
|---|---|
| File Type | .log |
| Calculation Type | FREQ |
| Basis Set | 6-31G(d,p) |
| Final Energy | -289.39470611 au |
| Gradient | 0.00002667 au |
| Dipole Moment | 22.3600 Debye |
| Point Group | C1 |
| Time to calculate | 9 minutes 35 seconds |
A molecule of [N(CH3)3(CH2CN]+ was created then optimised. The log file can be found here
| Parameter | Value |
|---|---|
| File Type | .log |
| Calculation Type | FOPT |
| Basis Set | 6-31G(d,p) |
| Final Energy | -306.39376108 au |
| Gradient | 0.00000041 au |
| Dipole Moment | 21.4650 Debye |
| Point Group | C1 |
| Time to calculate | 13 minutes 32 seconds |
As can be seen from the data below, it converged successfully.
Item               Value     Threshold  Converged?
 Maximum Force            0.000001     0.000015     YES
 RMS     Force            0.000000     0.000010     YES
 Maximum Displacement     0.000011     0.000060     YES
 RMS     Displacement     0.000003     0.000040     YES
 Predicted change in Energy=-4.728936D-12
 Optimization completed.
    -- Stationary point found.
The optimised molecule was then subjected to a frequency analysis to check the validity of the optimisation.
The log file can be found here
| Parameter | Value |
|---|---|
| File Type | .log |
| Calculation Type | FREQ |
| Basis Set | 6-31G(d,p) |
| Final Energy | -306.39376656 au |
| Gradient | 0.00002430 au |
| Dipole Moment | 21.4650 Debye |
| Point Group | C1 |
| Time to calculate | 10 minutes 26 seconds |
MO and NBO analysis
A population analysis was carried out on the optimised [N(CH3)3(CH2OH]+. This is detailed below. The log file can be found here.
| Parameter | Value |
|---|---|
| File Type | .log |
| Calculation Type | SP |
| Basis Set | 6-31G(d,p) |
| Final Energy | -289.39470611 au |
| Gradient | |
| Dipole Moment | 22.3600 Debye |
| Point Group | C1 |
| Time to calculate | 42 seconds |
A population analysis was then carried out on the optimised [N(CH3)3(CH2CN]+. This is detailed below. The log file can be found here.
| Parameter | Value |
|---|---|
| File Type | .log |
| Calculation Type | SP |
| Basis Set | 6-31G(d,p) |
| Final Energy | -306.39376656 au |
| Gradient | |
| Dipole Moment | 21.4650 Debye |
| Point Group | C1 |
| Time to calculate | 55 seconds |
Charge Distribution Images
The images of the charge distribution analysis are tabulated below. All coloured images use a scale which ranges from -0.8 to +0.8, where bright green is most positive and bright red is most negative.
| Image Type | [N(CH3)3(CH2OH]+ | [N(CH3)3(CH2CN]+ |
|---|---|---|
| Colour atom by charge |  |

|
| Atomic charge |  |

|
NBO Charge Analysis
The charge distribution data from the NBO analysis was collated below. The OH or CN group was named the 'X' group. The C between the X group and the central N atom was named the bridging C
| Ion | Central N charge | C (in CH3) charge | Bridging C charge |
|---|---|---|---|
| [N(CH3)3(CH2OH]+ | -0.322 | -0.492 | +0.088 |
| [N(CH3)3(CH2CN]+ | -0.289 | -0.488 | -0.385 |
As -OH is an electron donating group, it is to be expected that the rest of the molecule would have higher electron density than the corresponding molecule with a -CN group, as -CN is electron withdrawing. It can be seen that changing the X group keeps the central N and attached CH3 broadly similar in terms of charge distribution. The significant change comes when looking at the bridging C. It would be expected that a group adjacent to an electron donating group would be comparatively negatively charged and vice versa. However, the opposite effect is seen here. O is very electronegative and so pulls electron density from the adjacent C, causing it to be relatively positively charged. The bridging C when the X group is -CN experiences no such effect, as it's neighboring atom is also C.
This suggests that the electron donating/withdrawing nature of an X group in reality means little to the central N and CH3 groups.
HOMO/LUMO Comparison
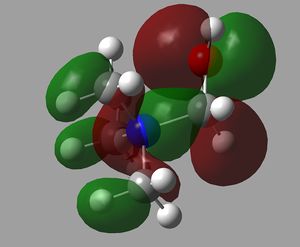
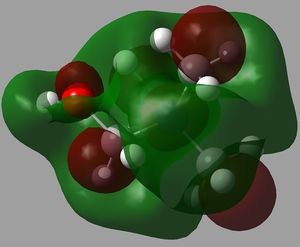
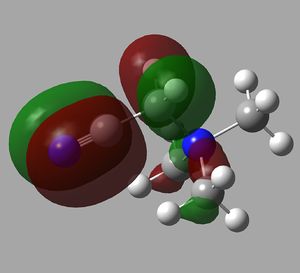
The HOMO and LUMO for [N(CH3)4]+, [N(CH3)3(CH2OH]+ and [N(CH3)3(CH2CN]+ were visualised and tabulated below.
It can be seen that changing the molecules can drastically change the generated MO. In terms of shape and appearance, changing th X group changes the HOMOs to an entirely new form. The LUMO of [N(CH3)4]+ adopts a 'plum-pudding' appearance, where the general cloud of one lobe is regularly punctuated by opposing lobes. This element of the 'plum-pudding' MO is retained when changing the X group, but now with additional AOs from the X group.
The energy of the MOs (both HOMO and LUMO) decrease when the X group changes; with the biggest decrease coming when the X group is -CN. The HOMO-LUMO gap has also gotten smaller, in the order [N(CH3)4]+>[N(CH3)3(CH2OH]+>[N(CH3)3(CH2CN]+.
Generally lower energy orbitals leads to increased stability and unreactivity. It might be expected that [N(CH3)3(CH2CN]+would be a more stable cation than [N(CH3)4]+ and perhaps form more stable ionic structures.
A smaller HOMO-LUMO gap means that it is easier to promote an electron to the LUMO from the HOMO. This also means that emitted light as a consequence this promotion then demotion will be of lower energy and longer wavelength.
Conclusion
A number of complexes were created, optimised, then investigated in a number of ways. I found that computational methods were a good way to predict real-life properties of molecules and my data was close to that of empirical data from the literature.
I was surprised that replacing an electron withdrawing group with an electron donating group (as when the influence of functional groups was investigated) had little effect on the central N. I would have expected a more significant effect.
References
- ↑ B. Réffy, M. Kolonits, and M. Hargittai, Journal of molecular structure, 1998. DOI:10.1016/S0022-2860(97)00420-1
- ↑ Handbook of Chemistry and Physics, 65th Ed. (1984), CRC Press and "Chemical Systems"
- ↑ R. Rowland and R. Taylor, The Journal of Physical Chemistry, 1996, 3654, 7384–7391
- ↑ Cotton, F. A.; Wilkinson, G. (1988). Advanced Inorganic Chemistry (5th ed.). Wiley. p. 1385. ISBN 978-0-471-84997-1.

