Rep:Mod:KQ3CJ92
Modelling of NH3 molecule
In this section we model the NH3 molecule using Gaussview,here is a table containing records of calculation method, basis set as well as properties of the NH3 molecule modeled and optimized.
Here is the *.log file : File:MFC16-NH3-OPTIMISATION2.LOG
NH3 Optimization
Calculation Type = FREQ
Calculation Method = RB3LYP
Basis Set = 6-31G(d,p)
Charge = 0
Spin = Singlet
E(RB3LYP) = -56.55776873 a.u.
RMS Gradient Norm = 0.00000485 a.u.
Imaginary Freq = 0
Dipole Moment = 1.8466 Debye
Point Group = C3V
Below is the item table generated by the gaussian calculations. The table tells us that the forces are converged. Because force is the gradient or slope of the energy vs distance graph, we look at a minimum when the slope is zero. This minimum corresponds the equilibrium position.
Item               Value     Threshold  Converged?
 Maximum Force            0.000004     0.000450     YES
 RMS     Force            0.000004     0.000300     YES
 Maximum Displacement     0.000072     0.001800     YES
 RMS     Displacement     0.000035     0.001200     YES
 Predicted change in Energy=-5.986275D-10
Optimization completed.
    -- Stationary point found.
Jmol picture
The Jmol image below shows the final optimized NH3 molecule.
test molecule |
Vibration modes
We now look at the vibrations of the NH3 molecule by doing a frequency analysis by looking at the curvature of potential energy, in other words the second derivative of the potential energy surface is closely related to the vibrations a molecule undertakes.
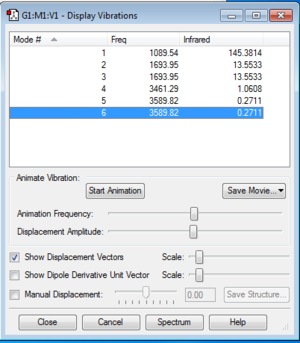
From the 3N-6 rule, we would expect 3 different vibration modes since in the ammonia molecule N=3. If we look closely in the table we see that some vibration modes are degenerate as they have the same frequencies. Hence, modes 2 and 3 are degenerate as well as modes 5 and 6. Since 3 and 4 are equal in energy and so are 5 and 6, the 3N-6 rule is obeyed.
Vibration modes 1,2 and 3 are 'bending' vibrations, whereas 4,5 and 6 are 'bond' vibrations. The 'umbrella' mode is a 'bending' vibration and it corresponds to mode 1.
Also, vibration mode 3 is highly symmetric, one H atom is fixed while the other two bend in a symmetric way.
In the IR spectrum of gaseous ammonia we expect to see 4 peaks corresponding to the 4 vibration modes that are different in energy. However, the computer generated IR spectrum for this molecule shows only three peaks. This is probably due to the fact that bandwidth of mode 4, 5 and 6 are too narrow to be considered in an experimental spectrum.
Charge distribution
The charge distribution of the NH3 molecule is expected to be negative for the N atom as it is very electronegative compared to the H atom. That is because the N atom has a tendency to attract electrons towards it resulting in partially positive charges on the H and partially negative charge on the N. Below is an image representing the ammonium molecule and the values for the charge distribution on each atoms.

Reactivity: the Haber-Bosch process
In this section we look at the Haber-Bosch process, and more precisely at the energy of the reaction. The Haber-Bosch process is the industrial means by which nitrogen gas and hydrogen gas are converted to ammonia. Here we investigate the energy for the reaction leading to ammonia: N2 + 3H2 -> 2NH3 Beforehand, the optimized structures of H2 and N2 need to be computed.
H2 molecule optimization
The H2 molecule is linear and has a D∞h symmetry. Below is the Gaussian calculation summary for the optimization of the H2 molecule.
H2 optimization
File Name = mfc16-H2-optimization
File Type = .log
Calculation Type = FREQ
Calculation Method = RB3LYP
Basis Set = 6-31G(d,p)
Charge = 0
Spin = Singlet
E(RB3LYP) = -1.17853936 a.u.
RMS Gradient Norm = 0.00000017 a.u.
Imaginary Freq = 0
Dipole Moment = 0.0000 Debye
Point Group = D*H
We can assume that optimization is complete as the gradient is very close to zero.
Below is an extract from the 'real' *.log file showing that the job has converged.
Item               Value     Threshold  Converged?
Maximum Force            0.000000     0.000450     YES
RMS     Force            0.000000     0.000300     YES
Maximum Displacement     0.000000     0.001800     YES
RMS     Displacement     0.000001     0.001200     YES
Predicted change in Energy=-1.164080D-13
Optimization completed.
   -- Stationary point found.
                          ----------------------------
                          !   Optimized Parameters   !
                          ! (Angstroms and Degrees)  !
--------------------------                            --------------------------
! Name  Definition              Value          Derivative Info.                !
--------------------------------------------------------------------------------
! R1    R(1,2)                  0.7428         -DE/DX =    0.0                 !
--------------------------------------------------------------------------------
The H2 molecule has one vibration mode, in the table below we see that it has a positive frequency so it is another proof that the optimization is correct.
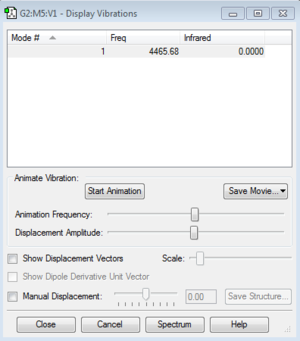
Here is the log file for the H2 molecule : File:MFC16-H2-OPTIMIZATION.LOG
N2 molecule
The N2 molecule is linear and has a D∞h symmetry. Below is the Gaussian calculation summary for the optimization of the N2 molecule.
N2 optimisation
File Name = mfc16-N2-optimization
File Type = .log
Calculation Type = FREQ
Calculation Method = RB3LYP
Basis Set = 6-31G(d,p)
Charge = 0
Spin = Singlet
E(RB3LYP) = -109.52412868 a.u.
RMS Gradient Norm = 0.00000060 a.u.
Imaginary Freq = 0
Point Group = D*H
Below is an extract from the 'real' *.log file showing that the job has converged. Hence optimisation is correctly done.
Item               Value     Threshold  Converged?
 Maximum Force            0.000001     0.000450     YES
 RMS     Force            0.000001     0.000300     YES
 Maximum Displacement     0.000000     0.001800     YES
 RMS     Displacement     0.000000     0.001200     YES
 Predicted change in Energy=-3.401039D-13
 Optimization completed.
    -- Stationary point found.
                           ----------------------------
                           !   Optimized Parameters   !
                           ! (Angstroms and Degrees)  !
 --------------------------                            --------------------------
 ! Name  Definition              Value          Derivative Info.                !
 --------------------------------------------------------------------------------
 ! R1    R(1,2)                  1.1055         -DE/DX =    0.0                 !
 --------------------------------------------------------------------------------
The N2 molecule has one vibration mode, in the table below we see that it has a positive frequency so it is another proof that the optimization is correct. However, this stretching frequency will not be observed in the infrared spectrum, as the molecule is homonuclear and linear thus any dipole would be cancelled out because of the parallel nature of this molecule.
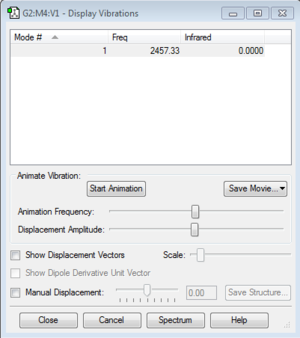
Here is a link for the original LOG file of my optimised N2 molecule: File:MFC16-N2-OPTIMIZATION.LOG
Reaction Energy
Now that all the energies for the individual molecules have been determined, it is now possible to calculate all the total energy of the reaction. The table below contains the values of the energies used for the determination of the reaction energy.
| Energy | Value |
|---|---|
| E(NH3) | -56.5577687 a.u. |
| 2*E(NH3) | -113.1155374 a.u. |
| E(N2) | -109.5241287 a.u. |
| E(H2) | -1.1785394 a.u. |
| 3*E(H2) | -3.5356182 a.u. |
Using these values it is now possible to calculate ΔE using the following formula : ΔE=2*E(NH3)-[E(N2)+3*E(H2)]
Hence: ΔE=2*E(NH3)-[E(N2)+3*E(H2)]=-113.1155374-[-109.5241287+(-3.5356182)]= -0.0557905 a.u.
Since this is a reaction energy this value is converted to kJ/mol, hence ΔE= -146.96 kJ/mol. The literature value for the enthalpy of formation in standard conditions and in the gas phase is -45.94 ± 0.35 kJ/mol. [1]
The calculated value is quite far from the empirically determined one, that is because when calculating them we take into account a certain number of variables. The more variables you take into account the more accurate the final value will be. Gaussview isn't that precise because it enables us to make very quick calculations (only a minute is needed), it hence doesn't have enough variables to get a more accurate energy.
In the Haber-Bosch process, both reactants and products are very stable. However N2 is one of the reactants, N2 has a very strong triple bond that requires a lot of energy to be broken, hence the reactants are more stable than the product.
Analysis of F2 moecule
Jmol picture
In this section we look at the properties of an F2 molecule as well as its molecular orbitals using Gaussview. Below is the jmol representation of the molecule.
F2 molecule |
Optimisation data
Using the summary table option on Gaussview important properties of the molecules are found below:
F2 optimisation
File Name = mfc16-F2-optimisation
File Type = .log
Calculation Type = FREQ
Calculation Method = RB3LYP
Basis Set = 6-31G(d,p)
Charge = 0
Spin = Singlet
E(RB3LYP) = -199.49825218 a.u.
RMS Gradient Norm = 0.00007365 a.u.
Point Group = D*H
Below is an extract from the log file showing that the job has converged, meaning the optimization has been done correctly.
Item               Value     Threshold  Converged?
 Maximum Force            0.000128     0.000450     YES
 RMS     Force            0.000128     0.000300     YES
 Maximum Displacement     0.000156     0.001800     YES
 RMS     Displacement     0.000221     0.001200     YES
 Predicted change in Energy=-1.995024D-08
 Optimization completed.
    -- Stationary point found.
                           ----------------------------
                           !   Optimized Parameters   !
                           ! (Angstroms and Degrees)  !
 --------------------------                            --------------------------
 ! Name  Definition              Value          Derivative Info.                !
 --------------------------------------------------------------------------------
 ! R1    R(1,2)                  1.4028         -DE/DX =    0.0001              !
 --------------------------------------------------------------------------------
Here is the log file: File:MFC16-F2-OPTIMISATION.LOG
Frequency
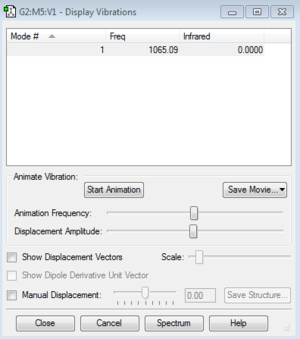
In the table we see that F2 has only one vibration mode at 1065 cm-1. however since F2 is homodinuclear lineatr molecule its stretching frequency doesn't produce a peak in the IR spectrum as the vibration cancels out.
Charge Distribution
As said before, F2 is homodinuclear and linear, its charge distribution is thus zero on both F atoms. On the image below it can be seen that both atoms are colored black, that is because they have the same zero charge distribution.

Molecular Orbitals of F2
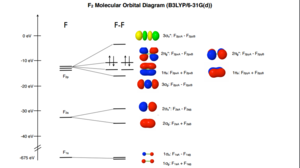
The electronic configuration of F is 1s2 2s2 2p5. When two F atoms combine to form a F2 molecule it is actually the two atomic orbitals that combine to form one molecular orbital. All molecular orbitals in F2 are occupied, therefore fluorine is a paramagnetic molecule like dioxygene.
Lowest occupied molecular orbital
The first two atomic orbitals that have degenerate energies of -24.797 au correspond to the molecular orbitals of the 1s electrons, first one is the bonding orbital and second one is the anti-bonding orbital. As these are deeper in energy than the other molecular orbitals, we can say that valence bonding mostly comes from the overlap of the 1s atomic orbitals.

2σg Molecular Orbitals
Molecular orbitals 3 and 4 are non degenerate, with energies of -1.33659 au and -1.09047 au respectively. These correspond the bonding and anti-bonding molecular orbitals of the 2s atomic orbital overlaps leading to the 2σg bonding and the 2σu* anti-bonding MOs. These two orbitals are pictured below.

Here the picture shows that the two 2s orbital of each individual F atom merge in one shell of electron density. This means that the electrons are delocalized over the entire molecule. This is not surprising as fluorine is homodinuclear and thus there is no polarization going on.
2σu* Molecular Orbitals

For the anti-bonding orbital, the orbital are opposite in phase and so as far away from each other as possible. This results in a nodal plane on the molecule where there is a zero electron density.In the case of fluorine this orbital is occupied, hence this doesn't result in a bond.
3σg Molecular Orbital or the LUMO
the σg and σu* orbitals derived from one of the p-orbital are the third set of orbitals with these symmetry labels in the molecule so they are labelled 3σg and 3σu* respectively. For fluorine, the 3σg orbital is the lowest unoccupied molecular orbital. This orbital is thus key feature of how the molecule reacts.[3]

2πg* Molecular Orbital or the HOMO
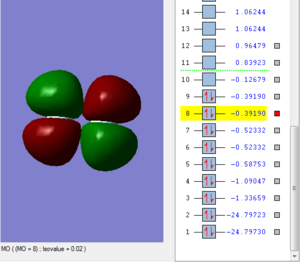
Fluorine also has π molecular orbitals. There are 2 of them that come from the combination of two p atomic orbitals, so there is one for F2pxA + F2pxB and another one for F2pyA + F2pyB combination. These molecular orbitals are degenerate. They are higher in energy and contribute far less to the covalent bonding. Because we had two degenerate π bonding orbitals we can expect two degenerate anti-bonding π orbitals as well. This orbital is also the Highest Occupied Molecular Orbital (HOMO), this agrees with the Lewis model. Below is pictured the 2πg* molecular orbital.
Analysis of another small molecule: HF
I have decided to look at the properties of the HF molecule, as when looking at the fluorine molecule the electron distribution was uniform because of the linear and homodinuclear nature of the F2 molecule. If we substitute an F for a hydrogen atom however, the electron distribution will experience a dramatic change as F is the most electronegative element of the periodic table, with an electronegativity of 3.98, whereas H has an electronegativity of 2.1. Hence the electronegativity difference is of 1.88, the bonding is thus considered mainly ionic.
Jmol image of HF
test molecule |
Optimisation data
Below is a table containing all the relevant data concerning the optimisation of the HF molecule with Gaussview.
HF molecule optimisation
Calculation Type = FREQ
Calculation Method = RB3LYP
Basis Set = 6-31+G(d,p)
Charge = 0
Spin = Singlet
E(RB3LYP) = -100.45136990 a.u.
RMS Gradient Norm = 0.00001273 a.u.
Imaginary Freq = 0
Dipole Moment = 1.9948 Debye
Point Group = C*V
Here is a look at the log file generated by Gaussview, this shows that optimisation is correctly done as all jobs have converged.
Item               Value     Threshold  Converged?
 Maximum Force            0.000022     0.000450     YES
 RMS     Force            0.000022     0.000300     YES
 Maximum Displacement     0.000018     0.001800     YES
 RMS     Displacement     0.000026     0.001200     YES
 Predicted change in Energy=-4.050031D-10
 Optimization completed.
    -- Stationary point found.
                           ----------------------------
                           !   Optimized Parameters   !
                           ! (Angstroms and Degrees)  !
 --------------------------                            --------------------------
 ! Name  Definition              Value          Derivative Info.                !
 --------------------------------------------------------------------------------
 ! R1    R(1,2)                  0.9278         -DE/DX =    0.0                 !
 --------------------------------------------------------------------------------
Here is a link to the log file for the HF molecule: File:MFC16-HF-OPTIMISATION.LOG
Vibration modes
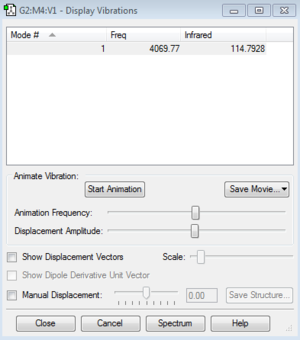
HF molecule only has one vibration mode that leads to one strong absoprtion band in the IR spectrum, it is a stretching frequency. It has a very high stretching frequency of 4069.77 cm-1. This frequency is much higher than for F2, this is because the hydrogen atom is much lighter and smaller in size than the F atom. Also, since the HF molecule is polarized, if H tries to get away from F, electrostatic force quickly brings it back as F has a high electron affinity and attracts the hydrogen atom's electron towards itself.
Charge distribution
The charge distribution of the HF molecule is uneven unlike the previous F2 molecule we talked about previously, as the electron density of H is strongly attracted towards F, hence the charge density is transferred from H to F. This why when we look at the relative charges (on the picture below), we see that on F the charge is of -0.581 compared to 0.581 on H. H becomes delta positive whereas F has stronger negative partial charge.

references
- ↑ National Institute of Standards and Technology on the enthalpy of formation of ammonia.
- ↑ http://www.crc.nd.edu/~wschnei1/courses/CHEM_324/Resources/Diatomic/F2-MO.pdf.
- ↑ Chemistry3: Introducing Inorganic, Organic and Physical Chemistry By Andrew Burrows, John Holman, Andrew Parsons, Gwen Pilling, Gareth Price.
