Rep:Mod:KM816
Molecular modelling is important for predicitng the structure and reactivity of molecules. Molecules can be modeled in multiple ways from MO diagrams using linear combination of atomic orbitals (LCAO) method to using computer programmes like Gaussian. This page will show the applications of Gaussian for modelling different molecules and how predicted MOs using LCAO compare to Gaussian MO predictions.
EX3 section
BH3
3-21G basis set
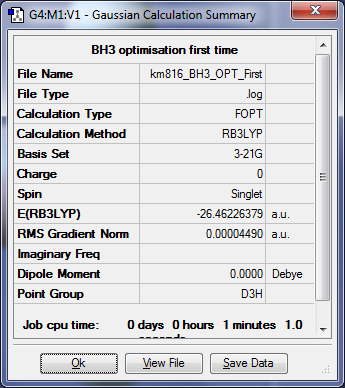

The item shows that the optimisation has gone to completed when everything has converged.
6-31G(d,p) basis set
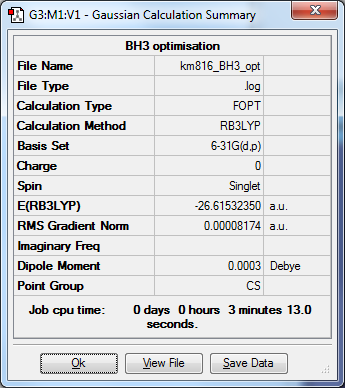

The energy of BH3 is much lower using the 6-31G(d,p) basis set compared to the 3-21G basis set.
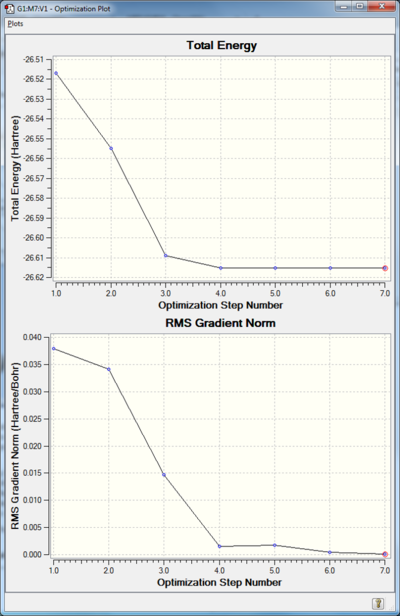
The total energy graph shows the program going through different potential energy surfaces until it finds one with minimum energy. The RMS gradient graph shows how the graident is going towards zero as the minimum potential energy is reached. The point of minimum potential energy is the most stable configuration for the molecule.


Smf115 (talk) 23:56, 25 May 2018 (BST)Nice inclusion of the PES and RMS gradient showing awareness of the optimisation procedure.
BH3 |
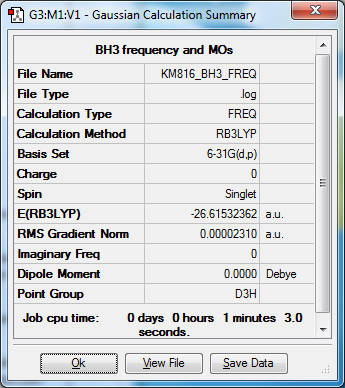
Although there is slight divergence at the 4th low frequency point the optimisation went to completion and was using the same basis set.
Vibrational analysis of BH3
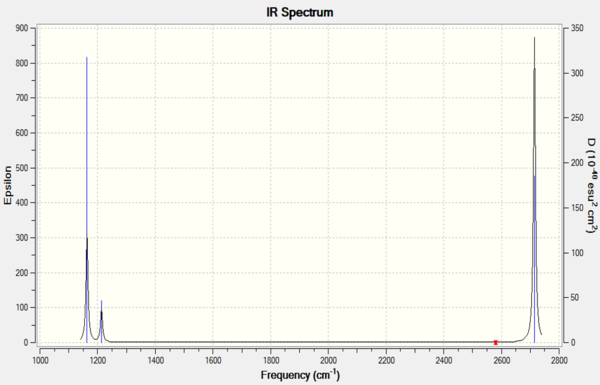
There are 6 calculated vibrations following the 3N-6 rule. However, only 3 peaks are seen. This is because vibrations at 1213 and 2715 cm-1 are degenerate so only one peak is seen. They are an asymmetric stretch and bend respectively. The vibration at 2582 cm-1 is not IR active seen by the 0 intensity. This is because it is a symmetric stretch so there is no change in dipole moment.
| Frequency (cm-1 | Intensity | Symmetry | IR active | Type |
|---|---|---|---|---|
| 1168 | 93 | A1 | Yes | Out-of-plane bend |
| 1213 | 14 | E | Yes | Bend |
| 1213 | 14 | E | Yes | Bend |
| 2582 | 0 | A1 | No | Symmetric stretch |
| 2715 | 126 | E | Yes | Asymmetric stretch |
| 2715 | 126 | E | Yes | Asymmetric stretch |
Comparison of MO diagram to Gaussian MOs
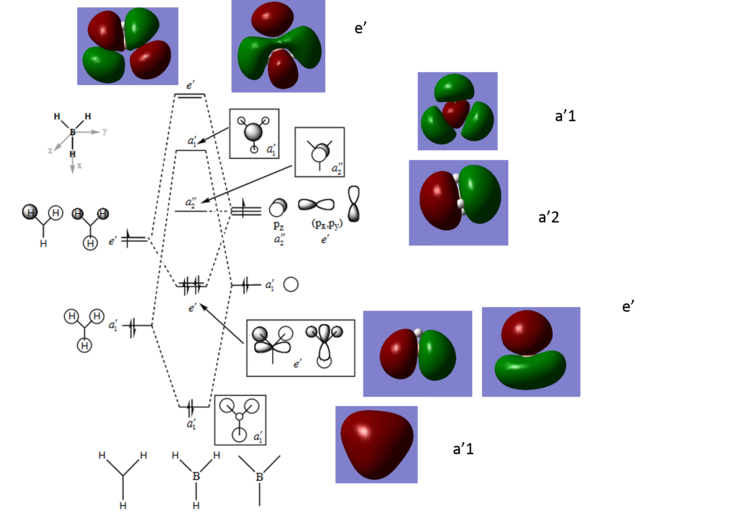
From comparison of the predicted MOs from the MO diagram and the calculated MOs from Gaussian can see that the MO diagram is a good approximation. Although the calculated MOs show the electron density over the whole molecule whereas the MO diagram shows the electron density located in orbitals. The localised electron density in MO diagrams is useful for visualising which AOs contribute to the overall MO it is not representative of the actual MO. The MO diagram for this molecule may be more accurate as B and H are light elements so will not experience relativistic effects to any significant extent.
Smf115 (talk) 23:55, 25 May 2018 (BST)Clear inclusion of the MOs in the diagram and good mention of how the LCAO method may be more accurate for this molecule due to the nature of B and H. You have the right idea for the differences but to improve, you need to develop your answer a bit more. It is the contributions of the AOs which are different between the LCAO qualitative MOs and the calculated MOs which can be seen the most in the antibonding 3a1 and 2e' MOs.
Ammonia-Borane Association Energy, 6-31G basis set RB3LYP method
Ammonia NH3
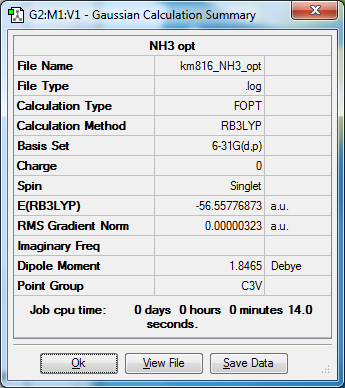


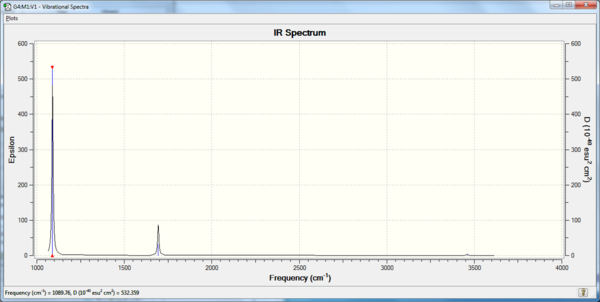
NH3 |
Ammonia-borane
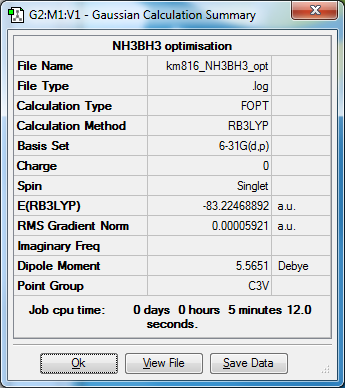

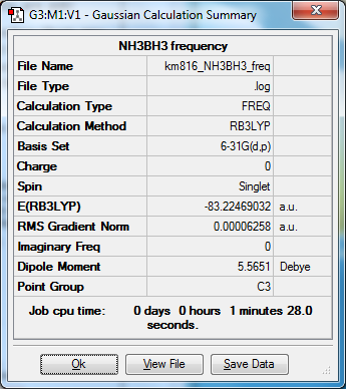


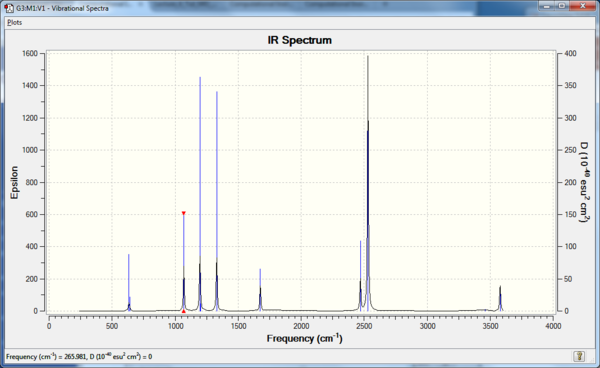
NH3BH3 |
Association energy calculation
E(NH3BH3)=-83.22469032 a.u.
E(NH3)=-56.55776856 a.u.
E(BH3)=-26.61532350 a.u.
Change in energy= E(NH3BH3)-(E(NH3)+E(BH3))=-0.05160(5d.p) a.u. =-136 kJ/mol Therefore, the B-N dative bond is relatively weak compared to B-H and N-H bonds. This is because hydrogen is a small molecule with only s orbitals available for bonding. S orbitals have the largest interaction with other orbitals so the bonding orbitals are stabilised to a larger extent than a p orbital. Therefore, as B and N are bonded through p orbitals there is less stabilisation of bonding orbitals leading to a weaker bond.
BBr3 pseudo-potential optimisation
Pseudo-potential optimisation using basis set GEN with RB3LYP calculation method is used due to heavier atoms such as Br. LanL2DZ pseudo-potentials for BR and B3LYP/6-31G level was used for Al and Cl. This is because the size of Br causes quantum effects that cannot be predicted by the 6-31G(d,p) basis set.
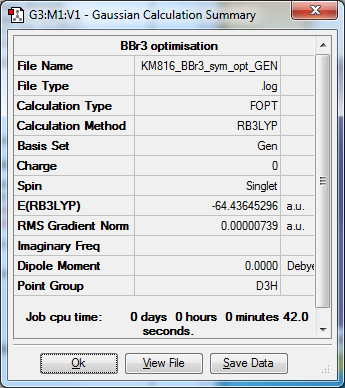

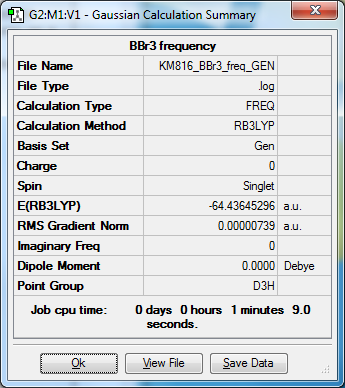


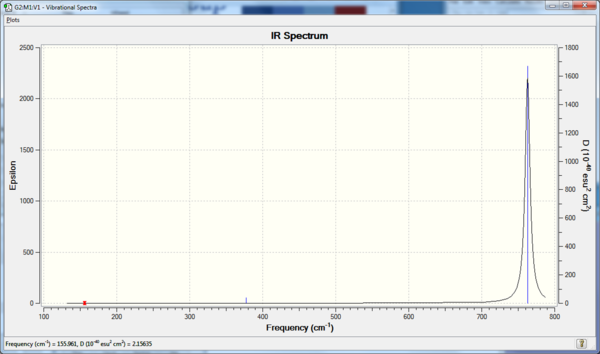
BBr3 |
Project Section, basis set GEN with RB3LYP method
Isomers of Al2Br2Cl4

Isomer 1, bridging Br ligands. LanL2DZ pseudo-potentials for BR and B3LYP/6-31G level was used for Al and Cl


 Item               Value     Threshold  Converged?
 Maximum Force            0.000006     0.000450     YES
 RMS     Force            0.000002     0.000300     YES
 Maximum Displacement     0.000066     0.001800     YES
 RMS     Displacement     0.000021     0.001200     YES
 Predicted change in Energy=-3.736205D-10
 Optimization completed.
    -- Stationary point found.
 Low frequencies ---   -5.1748   -5.0353   -3.1463    0.0026    0.0030    0.0031
 Low frequencies ---   14.8261   63.2702   86.0770
 Diagonal vibrational polarizability:
      102.8320447      75.5305353      47.7506817
 Harmonic frequencies (cm**-1), IR intensities (KM/Mole), Raman scattering
 activities (A**4/AMU), depolarization ratios for plane and unpolarized
 incident light, reduced masses (AMU), force constants (mDyne/A),
 and normal coordinates:
                      1                      2                      3
                     B2U                    AU                     B3G
 Frequencies --     14.8261                63.2702                86.0765
 Red. masses --     41.0115                34.9689                47.7803
 Frc consts  --      0.0053                 0.0825                 0.2086
 IR Inten    --      0.3441                 0.0000                 0.0000
CL2ALBR2ALCL2 |
E=-6189229 kJ/mol
Isomer 2, trans Br ligands. LanL2DZ pseudo-potentials for BR and B3LYP/6-31G level was used for Al and Cl


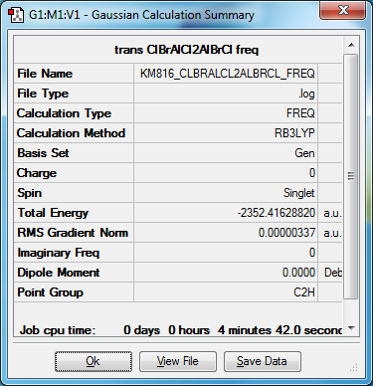
 Item               Value     Threshold  Converged?
 Maximum Force            0.000011     0.000450     YES
 RMS     Force            0.000003     0.000300     YES
 Maximum Displacement     0.000262     0.001800     YES
 RMS     Displacement     0.000106     0.001200     YES
 Predicted change in Energy=-2.270224D-09
 Optimization completed.
    -- Stationary point found.
 Low frequencies ---   -4.2803   -2.4946   -0.0029   -0.0010    0.0017    0.9593
 Low frequencies ---   17.7196   48.9825   72.9516
 Diagonal vibrational polarizability:
       74.9860284      98.5886381      41.2859385
 Harmonic frequencies (cm**-1), IR intensities (KM/Mole), Raman scattering
 activities (A**4/AMU), depolarization ratios for plane and unpolarized
 incident light, reduced masses (AMU), force constants (mDyne/A),
 and normal coordinates:
                      1                      2                      3
                     BU                     AU                     AG
 Frequencies --     17.7196                48.9825                72.9515
 Red. masses --     43.7717                46.9516                52.1453
 Frc consts  --      0.0081                 0.0664                 0.1635
 IR Inten    --      0.4805                 0.0706                 0.0000
CLBRALCL2ALBRCL |
E=-6189255 kJ/mol
The trans isomer with bridging Cl ligands is more stable. This is due to the better overlap of bridging Cl and Al as they are both in row 3 of the periodic table so similar in size and energy. This helps relieve the electron deficient AL centre therefore stabilising the isomer more. Br is too large for an efficient energy gap as Br valence orbitals are very diffuse and the energy difference between Al MOs and Br MOs is much larger leading to a smaller splitting energy so that the isomer with bridging BRs is less stabilised.
Smf115 (talk) 13:26, 27 May 2018 (BST)Nice justification for the relative stabilities however, calculation of the relative energy should have been included. Great structure information though and including the full method details of the pseudopotential and basis set used.
AlCl2Br Monomer


Item               Value     Threshold  Converged?
 Maximum Force            0.000081     0.000450     YES
 RMS     Force            0.000042     0.000300     YES
 Maximum Displacement     0.001588     0.001800     YES
 RMS     Displacement     0.000974     0.001200     YES
 Predicted change in Energy=-1.810813D-07
 Optimization completed.
    -- Stationary point found.
 Low frequencies ---   -0.0059   -0.0056   -0.0047    1.3568    3.6367    4.2604
 Low frequencies ---  120.5042  133.9178  185.8950
 Diagonal vibrational polarizability:
       25.8387453      23.2148312      26.6885746
 Harmonic frequencies (cm**-1), IR intensities (KM/Mole), Raman scattering
 activities (A**4/AMU), depolarization ratios for plane and unpolarized
 incident light, reduced masses (AMU), force constants (mDyne/A),
 and normal coordinates:
                      1                      2                      3
                     B2                     A1                     B1
 Frequencies --    120.5040               133.9178               185.8949
 Red. masses --     37.6456                39.5756                28.4745
 Frc consts  --      0.3221                 0.4182                 0.5798
 IR Inten    --      5.3432                 6.3512                33.1798
AlCl2Br |
E=-3094580 kJ/mol
Dissociation Energy
(2E(monomer)-isomer)=(2x-1176.19013679)--2352.41628816
=-2352.380274+2352.41628816
=0.03601 a.u (5 d.p)
=95 kJ/mol
The monomer is less stable, seen by the positive energy. This is because the electron deficiency at the Al is relieved by more ligands where the Cl (in a valence model) can donate LPs to the Al. This means that the electron deficiency is stabilised in an MO model.
Molecular orbitals of Isomer 2, bridging Cl
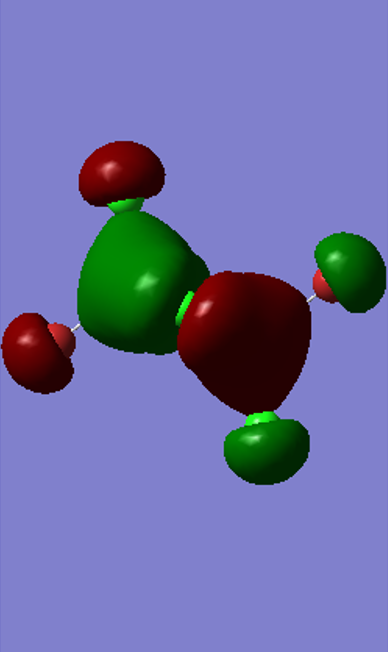
Highly Bonding, MO 37
Gaussian Orbital

Molecular Orbital

There is only one node through the centre of the molecule
Fragment Orbitals


The electron density on the terminal ligands are residual electron density from the calculation. This shows the discrepancy between MO diagrams and the Gaussian calculations
Medium Bonding MO 41
Gaussian Orbital
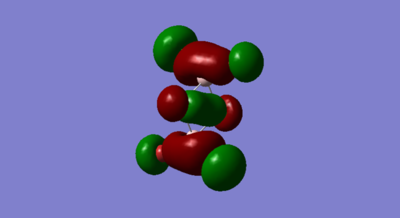
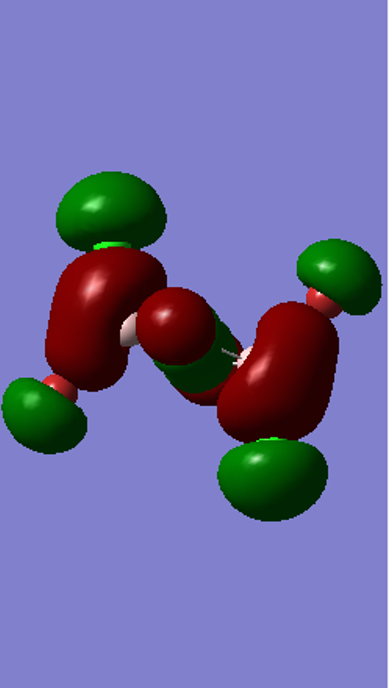
Molecular Orbital

Fragment Orbitals


Highly Anti-bonding MO 54
Gaussian Orbital
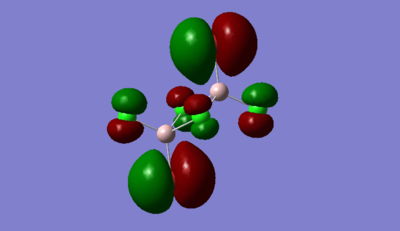
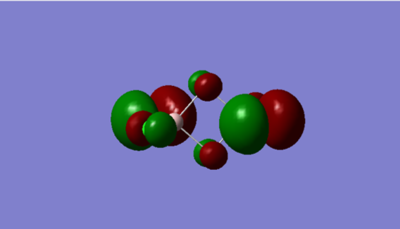
Molecular Orbital

Fragment Orbitals


The atomic orbitals are much larger on Br than Cl for the highly anti-bonding MO. This is because Br is higher in energy than Cl therfore, it has a higher contribution to antibonding orbitals than Cl due to the energy difference between the two ligands.
Smf115 (talk) 13:25, 27 May 2018 (BST)Nice range of MOs selected. The LCAOs are largely correct and nice consideration towards the FOs. To improve, the analysis of the interactions present could have been further developed with some key interactions not labelled, terminology sich as pi- or sigma- could also be used to describe the interactions.
Smf115 (talk) 13:25, 27 May 2018 (BST)Overall a decent wiki report with good structural information throughout.
